A phase-field study of elastic stress effects on phase separation in ternary alloys
Abstract
Most of the commercially important alloys are multicomponent, producing multiphase microstructures as a result of processing. When the coexisting phases are elastically coherent, the elastic interactions between these phases play a major role in the development of microstructures. To elucidate the key effects of elastic stress on microstructural evolution when more than two misfitting phases are present in the microstructure, we have developed a microelastic phase-field model in two dimensions to study phase separation in ternary alloy system. Numerical solutions of a set of coupled Cahn-Hilliard equations for the composition fields govern the spatiotemporal evolution of the three-phase microstructure. The model incorporates coherency strain interactions between the phases using Khachaturyan’s microelasticity theory. We systematically vary the misfit strains (magnitude and sign) between the phases along with the bulk alloy composition to study their effects on the morphological development of the phases and the resulting phase separation kinetics. We also vary the ratio of interfacial energies between the phases to understand the interplay between elastic and interfacial energies on morphological evolution. The sign and degree of misfit affect strain partitioning between the phases during spinodal decomposition, thereby affecting their compositional history and morphology. Moreover, strain partitioning affects solute partitioning and alters the kinetics of coarsening of the phases. The phases associated with higher misfit strain appear coarser and exhibit wider size distribution compared to those having lower misfit. When the interfacial energies satisfy complete wetting condition, phase separation leads to development of stable core-shell morphology depending on the misfit between the core (wetted) and the shell (wetting) phases.
keywords:
Phase field modeling , ternary systems , elastic stress effects , Cahn-Hilliard equations , spinodal decomposition1 Introduction
Technologically important alloys with multiple components often exhibit microstructures containing multiple coexisting phases. To enhance the properties of these alloys, we require a fundamental understanding of the multiphase microstructures and their kinetics of evolution as a function of key processing parameters to establish processing-microstructure-property relations in these alloys. In a multicomponent alloy containing multiple coherent phases, an interplay of several factors, particularly, alloy chemistry, relative interfacial energies between the phases, coherency strains arising due to lattice parameter mismatch between the phases, and kinetic parameters such as composition dependent diffusivities of components, leads to modification in the pathways of morphological evolution.
Elastic stresses developed in the microstructure due to the formation of coherent interfaces among multiple phases induce important morphological changes and affect strain partitioning and as a result solute partitioning [1, 2, 3]. The elastic interactions between the coherent domains in the microstructure depend on the magnitude and sign of misfit between them, as well as the anisotropy and inhomogeneity in elastic moduli [4, 5].
There are several examples in the existing literature elucidating the significance of coherency strain effects on the development of multiphase microstructures. Here we cite some important examples relevant to our study of the development of coherent three-phase microstructures as a result of solid to solid phase trasformations. Long term aging of alloys like Cu-Ni-Cr [6], Fe-Al-Mn-Cr [7] and Fe-Ni-Mn-Al [8] results in the evolution of coherent three-phase microstructures. Moreover, ternary alloys (e.g., Al-Li-Zr, Al-Li-Sc, Al-Sc-Zr, Al-Li-Cu, Inconel, alloy steels) develop microstructures with three structurally distinct phases sharing elastically coherent interfaces during multi-step heat treatment [9, 10, 11], although development of such phases do not happen through spinodal decomposition (SD).
With the advent of ‘high entropy’ alloys (HEA),experimental studies have reported the development of coherent three-phase microstructures via SD [12, 13, 14]. In a recent paper, Morral and Chen [15] conjectured the existence of three-phase miscibility gap in multicomponent HEA systems.
Although there are extensive studies of microstructural evolution during phase separation in binary alloy systems with coherent elastic misfit [16, 17, 18, 19, 20], there are very few studies focusing on the effects of elastic stress when more than two phases are present in the microstructure [21, 22].
De Fontaine [23] and Morral and Cahn [24] analyzed the compositional stability, fluctuations and early stage kinetics of ternary SD and derived Cahn-Morral equations to describe phase separation. Hoyt [25] developed a master equation for ternary SD and derived linearized diffusion equations and three independent partial structure functions. The mean field coarsening theory of Lifshitz, Slyozov and Wagner [26, 27] was extended to study coarsening in ternary alloys [28, 29] and multicomponent, multiphase systems [30, 31].
Chen [32, 33] and Eyre [34] studied the influence of alloy chemistry on morphological evolution during SD in ternary alloys using computer simulations. Later, Bhattacharyya and Abinandanan [35] studied the effect of relative interfacial energies between the coexisting phases on ternary SD. In a recent study, Ghosh et al. [36] extended the model to investigate the influence of immobile particles with selective wetting present in the microstructure on SD in ternary polymer blends. The studies mentioned above do not include the elastic stress effects arising due to lattice parameter mismatch between the coexisting phases. Since the elastic stresses developed in the microstructure may play a crucial role in the morphological evolution of ternary alloys, we have extended the diffuse interface model to study the effect of coherency strains between the phases on the evolution of microstructure during ternary SD. We aim to investigate the effects of degree and sign of relative misfit between the phases on ternary phase separation.
The framework of the paper is as follows: in Section 2, we describe the formulation of the phase field model with a regular solution bulk free energy and the technique of incorporating elasticity. We present the results of our simulations in Section 3 and discuss the effect of relative misfit strains and interfacial energies between coexisting phases on decomposition pathways, solute partitioning, microstructural evolution and coarsening kinetics. We summarize the major conclusions from our study in Section 4.
2 Formulation and numerical implementation of the model
2.1 Energetics
In the phase-field model discussed here, we consider a ternary substitutional alloy containing three atomic species A, B and C. The concentration of th species is a function of position r and time . The bulk energetics presented here is an extension of an existing diffuse-interface formulation [34, 37, 36] of ternary Cahn-Hilliard model incorporating additional terms describing elastic interactions.
The total free energy for the coherent, isotropic, compositionally inhomogeneous system is expressed as a function of composition field variables and ():
| (1) |
where is the number of molecules per unit volume (assumed to be independent of composition and position) and are the gradient energy coefficients associated with compositions fields.
The bulk chemical free energy per atom of the homogeneous alloy is given by the regular solution expression:
| (2) |
where , and are the pair-wise interaction parameters. The elastic strain energy density is given by
| (3) |
where denotes the stress field calculated from mechanical equilibrium equation and indicates the elastic strain field arising due to the coherency strain field, . We represent all the vector and tensor fields using Einstein summation convention.
and . indicates the elastic stiffness tensor (homogeneous across three phases), is the homogeneous strain and is the periodic strain tensor, defined as the gradient of the displacement field vector. is expressed as a function of composition fields:
| (4) |
where and , and is the position independent part of the eigenstrain field associated with . () is the homogeneous alloy composition and is the Kronecker delta. We assume the eigenstrains in the system to be dialataional: and . and denote the lattice expansion coefficients associated with and , respectively. represents the difference between and ().
We consider the alloy system to be a linear elastic solid. Solution of mechanical equilibrium equation () in Fourier space (assuming the local displacement field to be periodic) gives the local elastic strain and stress fields. We obtain an expression for elastic energy in reciprocal space using Khachaturyan’s microelastic theory [38] as follows:
| (5) |
where k denotes the Fourier wave vector, is the unit vector in reciprocal space, represents the Fourier transform of . is the elastic interaction energy between and and is the inverse Green tensor. denotes the complex conjugate of .
2.2 Kinetics
The temporal evolution of the conserved field variables are governed by a set of Cahn-Hilliard equations. We solve the equations for both and to study the microstructural evolution. The temporal evolution of the composition fields is described by the continuity equations:
| (6) |
where represents the net flux of component i (). The kinetic equations for microstructural evolution are obtained by following the results of Kramer [39] and combining them with Gibbs-Duhem equations and Onsager relations for the effective mobilities:
| (7) |
| (8) |
where and are variational derivatives of elastic energy with respect to composition order parameters, , . , and are effective mobilities defined as follows [40]:
| (9) |
2.3 Numerical implementation
We use a semi implicit Fourier spectral method [41, 42] for solving the evolution equations (Eqns. 7 and 8).
| (10) |
| (11) |
where and are the Fourier transforms of the respective compositions in the real space, and are the Fourier transforms of the bulk driving force terms. The symbol denotes a Fourier transform of the quantity within the brackets. The variational derivatives of elastic energy with respect to composition field variables in reciprocal space are derived from the expression of elastic energy in Fourier space (Eqn. 5), considering a change in the functional relative to the change in functions, and :
| (12) |
| (13) |
where and are the Fourier transforms of the and , respectively and is the elastic interaction energy between and ().
2.4 Simulation details
All the simulation parameters in the model are presented in non-dimensional form using characteristic length, time and energy values. We perform simulations of microstructural evolution on a two-dimensional square grid of size with dimensionless grid spacing . For approximating a bulk system (without surfaces), we use periodic boundary conditions.
The simulations start with a homogeneous alloy of a prescribed concentration. Initially, we add a conserved Gaussian noise of strength to each grid point in the simulation box to mimic thermal fluctuations. We choose a non-dimensional time step for the evolution of composition field variables to ensure temporal accuracy of our numerical scheme.
We consider a system (, ) with a symmetric ternary miscibility gap with equal interfacial energies between the equilibrium phases (). Moreover, we vary the alloy composition and the degree and sign of misfit between the phases to study their effects on microstructural evolution during the early stages of phase separation. We have chosen nine different alloy systems listed in Table 1 for the simulations. We have used the following naming convention to specify an alloy system: an uppercase letter denotes the composition of the alloy, an integer subscript represents the state of misfit strain. Integer represents the case where the lattice expansion coefficients, and , associated with concentrations of B and C, respectively, have equal magnitude and same sign. On the other hand, integer represents the case where , and integer represents the case where .
| System | |||
|---|---|---|---|
| (0.33,0.33) | 0.01 | 0.01 | |
| (0.33,0.33) | 0.01 | -0.01 | |
| (0.33,0.33) | -0.0139 | 0.0028 | |
| (0.25,0.25) | 0.01 | 0.01 | |
| (0.25,0.25) | 0.01 | -0.01 | |
| (0.25,0.25) | -0.0139 | 0.0028 | |
| (0.45,0.45) | 0.01 | 0.01 | |
| (0.45,0.45) | 0.01 | -0.01 | |
| (0.45,0.45) | -0.0139 | 0.0028 |
De Fontaine developed a criterion for the stability of ternary alloys with respect to bulk, incoherent SD [23]. According to his analysis, the chemical spinodal surface of a ternary alloy shows three regions of stability based on the eigenvalues and eigenvectors of a stability matrix formed by the second order derivatives of the bulk free energy with respect to the composition fields, and :
-
1.
Region I: central region of absolute instability, where both eigenvalues are negative ( is negative definite) and composition fluctuations grow along all directions for the alloys,
-
2.
Region II: intermediate region of conditional stability, where one of the eigenvalues is negative ( is indefinite) and the eigenvector associated with the negative eigenvalue gives the direction of SD for the alloys,
-
3.
Region III: region of absolute stability at the three corners, where both eigenvalues are positive ( is positive definite) and alloys remain stable with respect to composition fluctuations in any direction,.

The points , and on the isothermal section of the chemical spinodal surface () indicate the prescribed alloy compositions used in our study (Fig. 1). The arrows indicate the directions of instability according to the stability matrix .
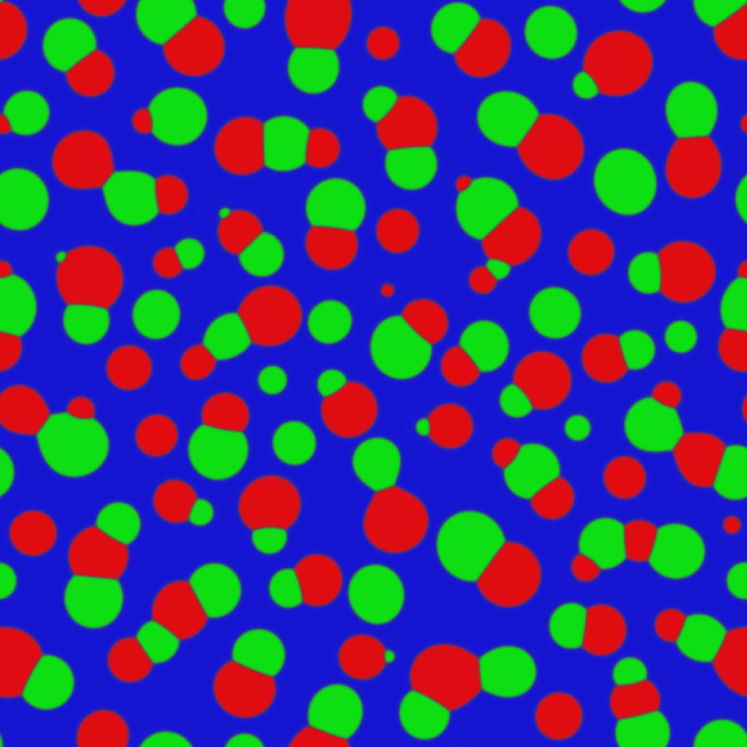
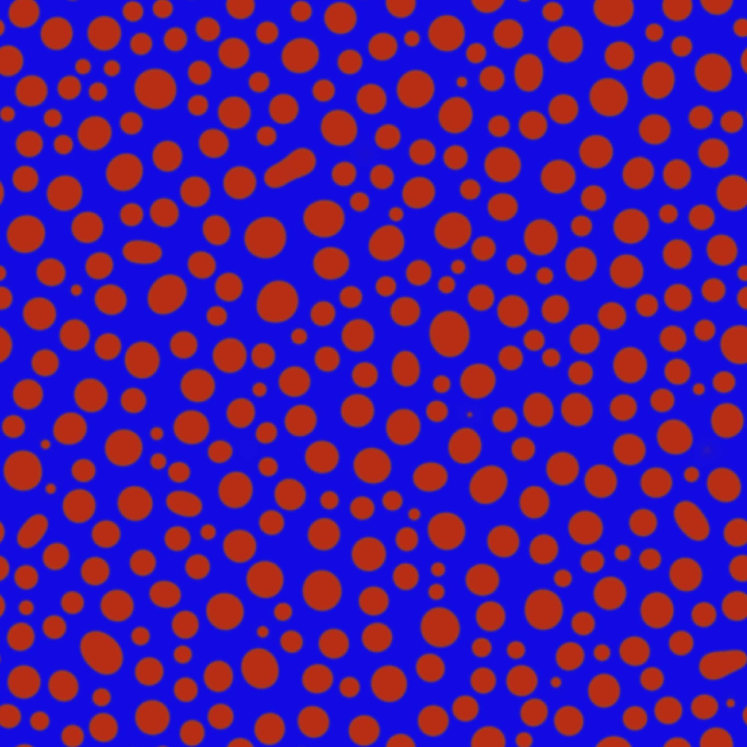
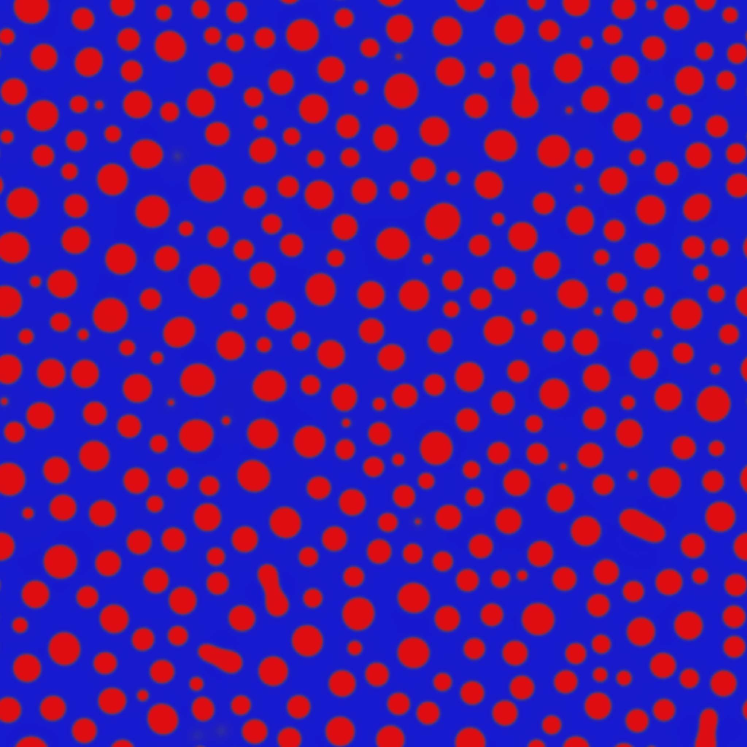
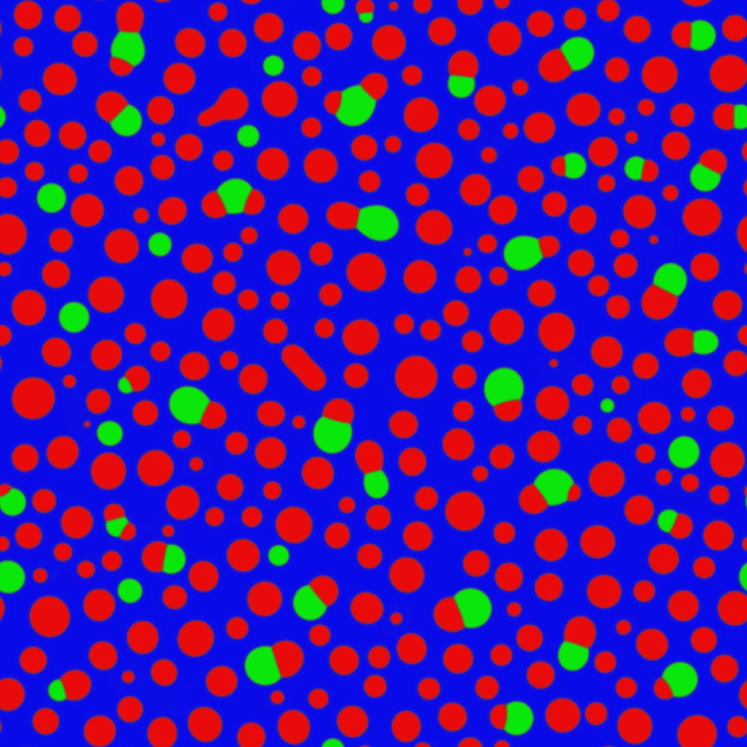
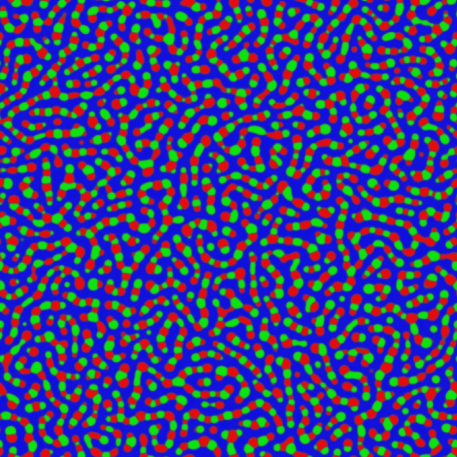
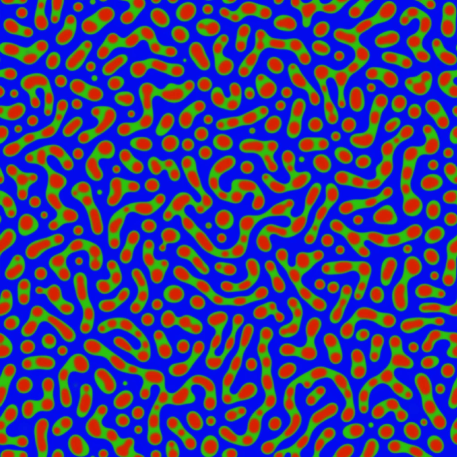
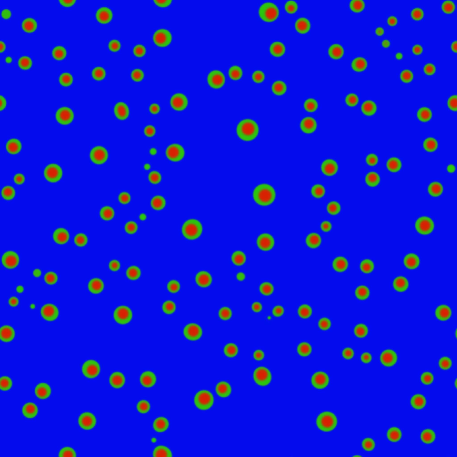
We present the time snapshots of microstructures using an RGB (red-green-blue) map representing the local compositions of components , and . According to the color map, blue hue indicates rich phase, green indicates rich phase, red indicates rich phase and the intermediate shades (linear combination of the terminal colors) represent the interfacial compositions. We also estimate the particle size distribution of different domains in each alloy system using an open source program developed by Fialkowski et al. [43, 44, 45] for 2D morphological analysis.
3 Results and discussion
3.1 Microstructural evolution
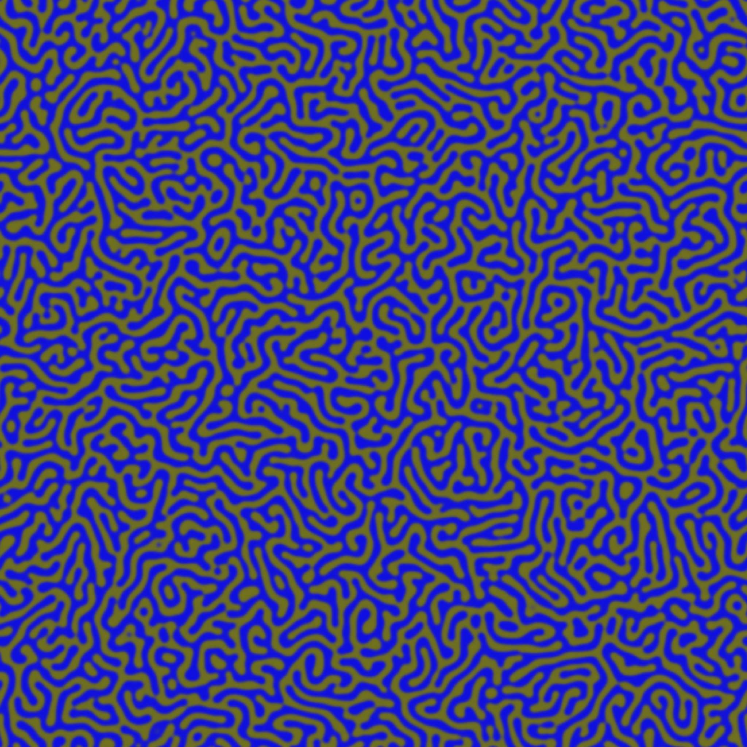
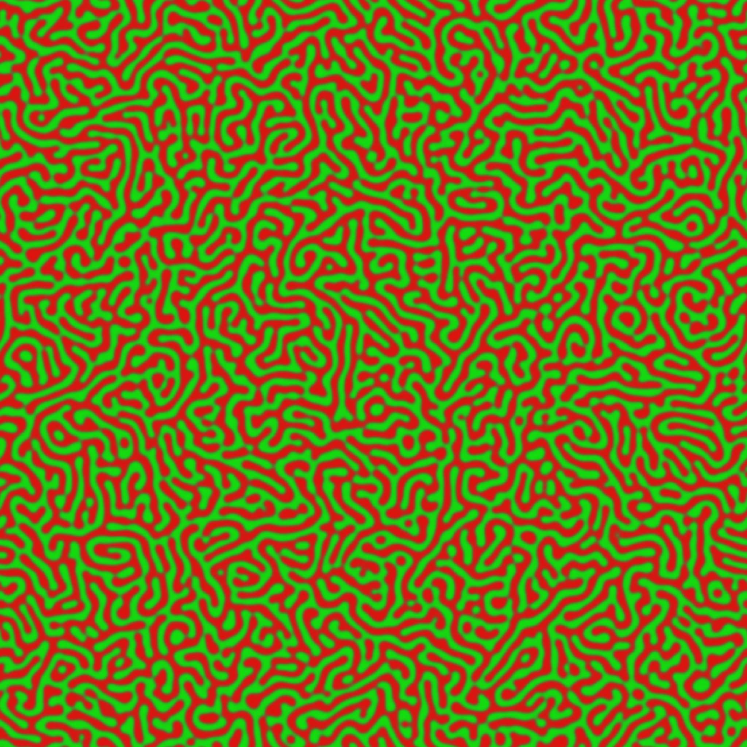
The time snapshots of the evolution of microstructure for equiatomic alloys, rich alloys and poor alloys at early and late stages of SD are shown in Figs. 2 and 3, respectively. In alloy , early stages of SD produce and phases in the microstructure (Fig. 2(a)). Large misfit of phase with and () delays phase separation. Since , the system prefers more interfaces to minimize coherency strain energy. Thus, the microstructure at the late stages of SD (Fig. 3(a)) contains an interconnected network of rich and rich domains. The particles appear coarser compared to and .
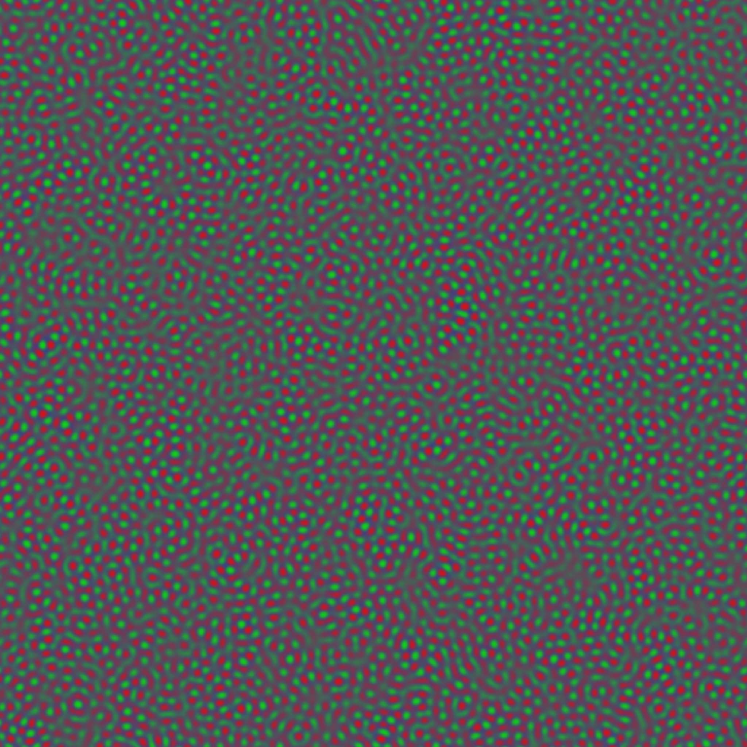
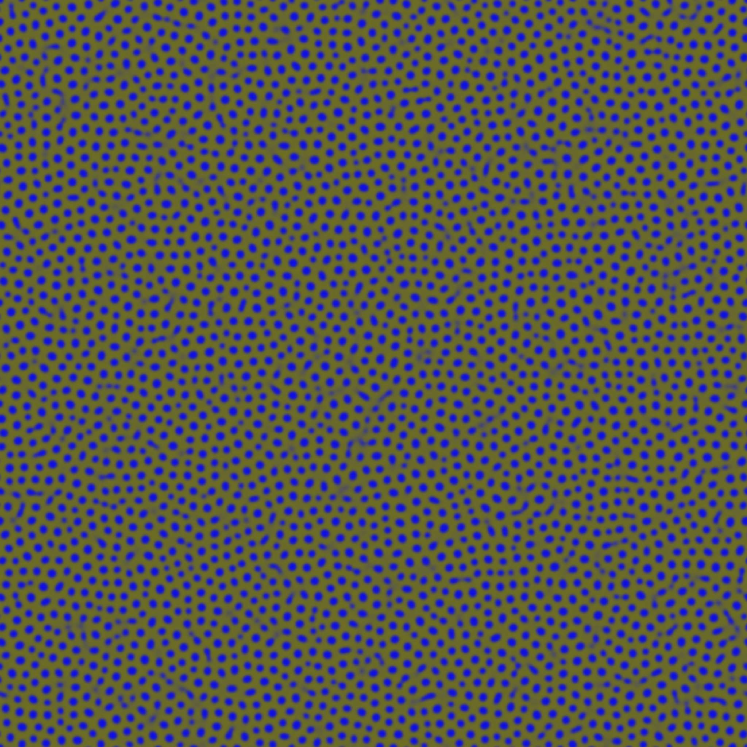
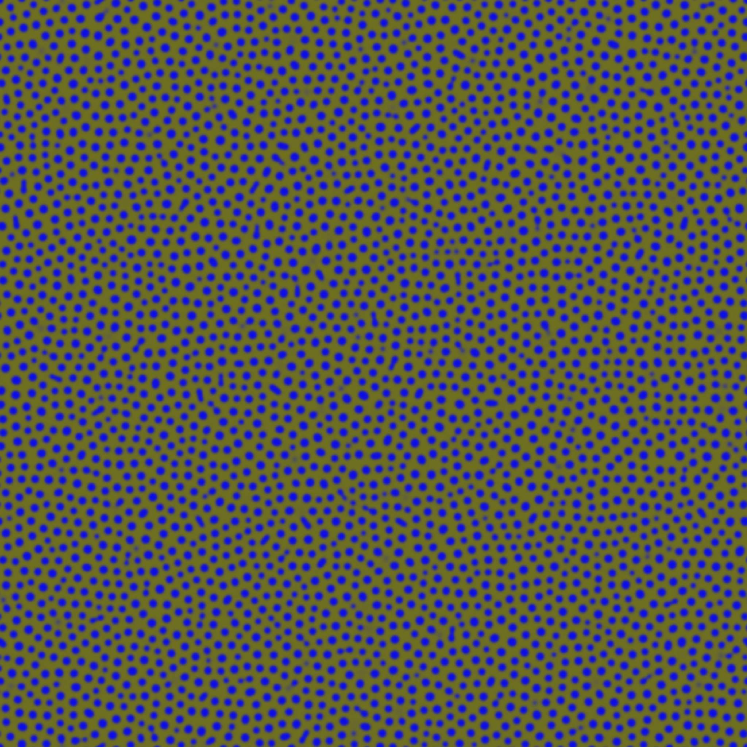

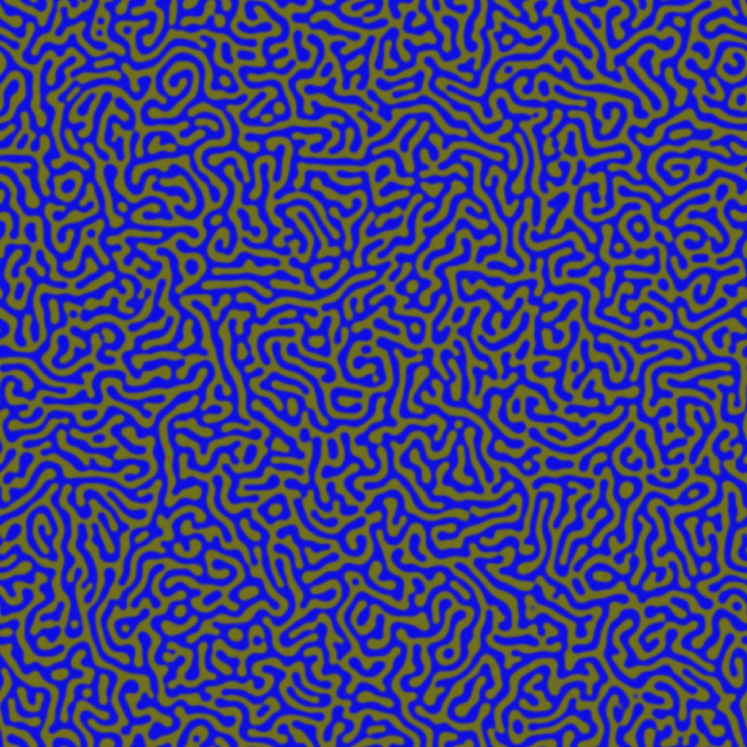


Since the magnitudes of mismatch between and () are large in both and , B and C species do not partition during the early stages of SD. As a result, these alloys undergo pseudo-binary SD during the early stages to form a two-phase microstructure containing rich domains in an poor matrix (Figs. 2(b), 2(c)).


However, the misfit between and phases in is larger than that in . Therefore, secondary decomposition of poor domain to rich and rich phases is suppressed in . The domains remain nearly circular throughout the evolution (Fig. 3(b)). During the early stages of SD, domains coalesce to reduce interfacial energy. Coarsening of domains sets in when .
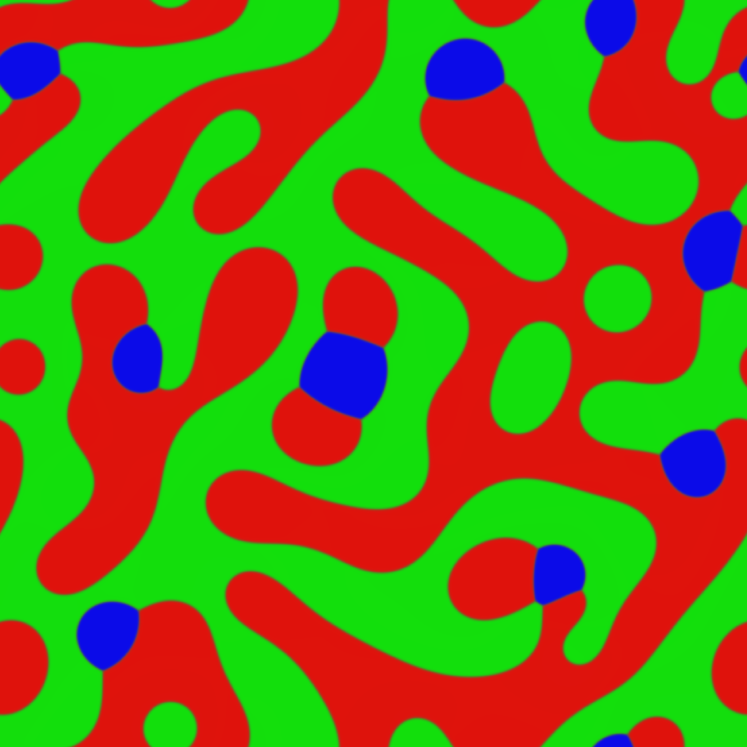
In system , the poor matrix undergoes secondary phase separation resulting in the formation of a network of and domains. Since , the late stage microstructures contain more interfaces than interfaces. During late stages, domains lose their circular shapes due to the impingement of diffusion and strain fields.(Fig. 3(c)).
According to de Fontaine’s stability analysis, primary SD of rich alloy leads to composition fluctuations along the median perpendicular to line , producing rich and poor domains. Subsequent SD of poor domains along line would yield rich and rich phases (Fig 1). In alloy , since and have same magnitude and sign, there is an increase in the effective misfit between the rich and poor regions. As a result, there is a delay in primary phase separation in this alloy system (Fig 2(d)). But, when the poor regions finally appear, they rapidly decompose yielding and phases. The and domains share a strain-free interface between them () and predominantly emerge in the form of networks of conjoined circular particles. They maintain the composite morphology and near circular shapes even at later stages of SD (Fig 3(d)).
Alloys and also undergo primary SD forming a bicontinuous microstructure consisting of rich and poor domains. Since the misfits between and are larger in both alloys, the secondary decomposition of poor domains is delayed (Figs. 2(e), 2(f)).
However, the magnitude of mismatch between and phases in is higher than that in . Hence, secondary decomposition of poor domains to and phases is inhibited in . The microstructure remains bicontinuous throughout the evolution (Fig. 3(e)). Whereas, in system , the poor domains undergo secondary phase separation forming dual semicontinuous networks of alternating and domains embedded in matrix(Fig. 3(f)).
For an poor alloy with composition in the region of conditional stability (Region II), de Fontaine’s analysis predicts decomposition along line producing rich and rich domains. In alloy , since , the primary SD occurs rapidly forming a bicontinuous microstructure consisting of rich and rich domains (Fig. 2(g)). At later stages, the two-phase microstructure is stable and phase does not form due to its high degree of misfits associated with and phases (Fig. 3(g)).
3.2 Kinetic paths of , and phases in equiatomic alloys
We follow the compositional history of six representative rich, rich, and rich regions during microstructural evolution and plot best fitted curves on a Gibbs triangle to show the kinetic paths of evolution of , and phases during SD in equiatomic alloys , and . We compare the sequences of SD obtained from kinetic paths with the directions of decomposition predicted by de Fontaine’s stability analysis [23].
According to de Fontaine’s stability analysis, when an equiatomic ternary alloy (characterized by a symmetric miscibility gap) undergoes bulk, incoherent SD producing three phases with equal interfacial energy, the compositional history of each phase should be symmetric and should lie along the medians of Gibbs triangle (see Fig. 1). Later, Bhattacharyya has shown that the difference in the relative interfacial energies between the phases may alter the kinetic paths of decomposition [46]. Here we aim to show the influence of strain partitioning between the coherent phases on the kinetic paths even when the phases have equal interfacial energies between them.
As shown in Figs. 4(a), 4(b), 4(c), the kinetic paths of formation of , and phases in , and differ from the predictions based on de Fontaine’s stability analysis. The delay in the formation of of in alloy system is evident from the asymmetry of the kinetic paths (see Fig. 4(a)). The initial SD takes place along a line parallel to BC while the phase appears later. On the other hand, in system , absence of kinetic paths associated with and phases indicate a pseudo-binary SD leading to rich and poor regions along a line perpendicular to BC (see Fig. 4(b)). System follows a similar trend at the initial stages (Fig. 4(c)), where primary decomposition occurs perpendicular to BC leading to the formation of rich and poor domains. However, further partitioning of and leads to secondary SD along a line parallel to BC direction in alloy forming and phases in the microstructure.
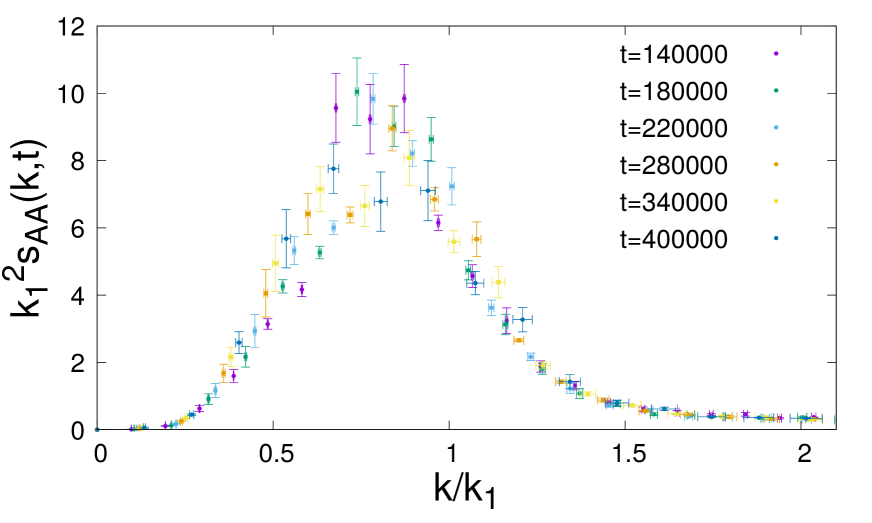
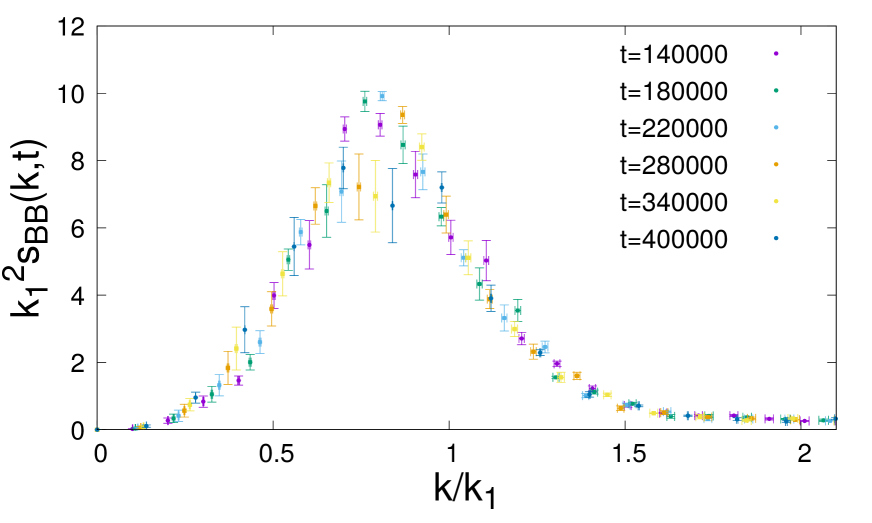
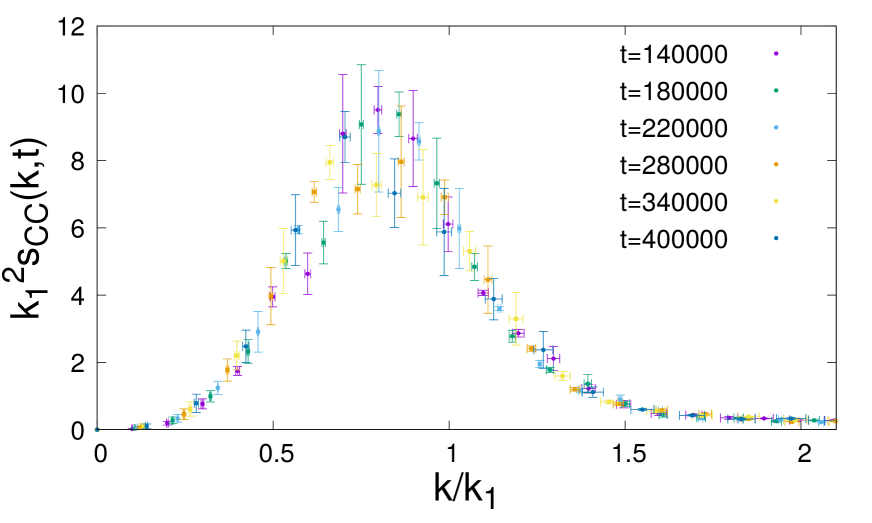
3.3 Structure functions () for equiatomic alloys
We also characterize the three-phase microstructures using three time-dependent and linearly independent structure functions [42, 47]:
| (14) |
where , and denotes the average concentration of the species . denotes the scattering vector whose magnitude is equal to the reciprocal of the wavelength of modulation of the composition field.
provides a measure for the spatial correlations in composition of component in the reciprocal space. A linear combination of mathematically represents the scattered intensity obtained from small angle X-ray and neutron scattering (SAXS,SANS) studies of a ternary solid solution. For isotropic systems, we perform a circular averaging of the structure functions and plot them as a function of radial distance in reciprocal space.
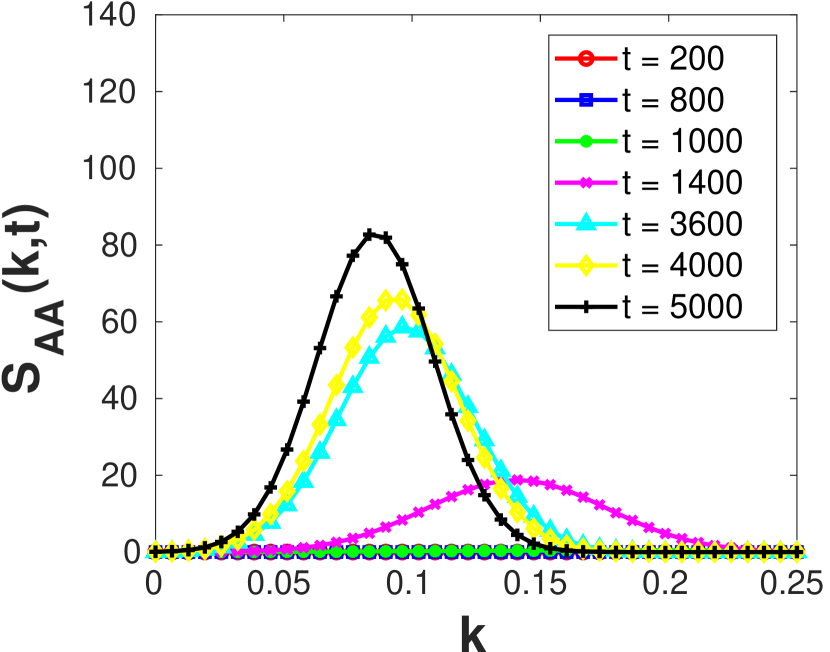
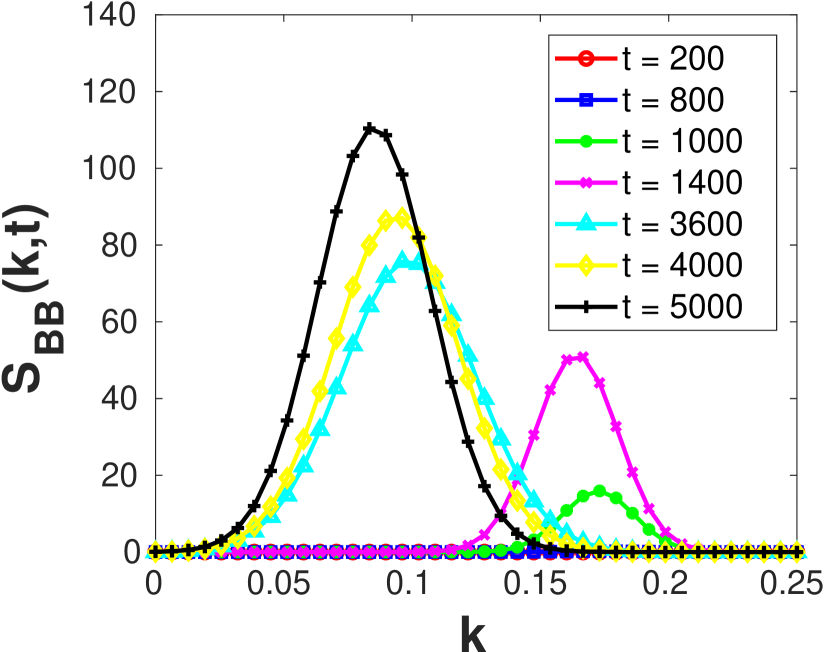
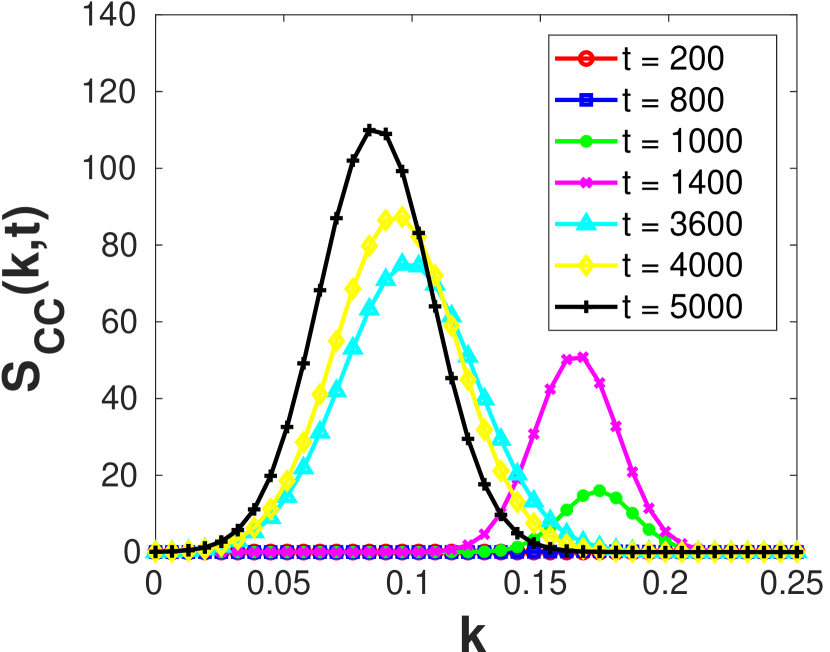
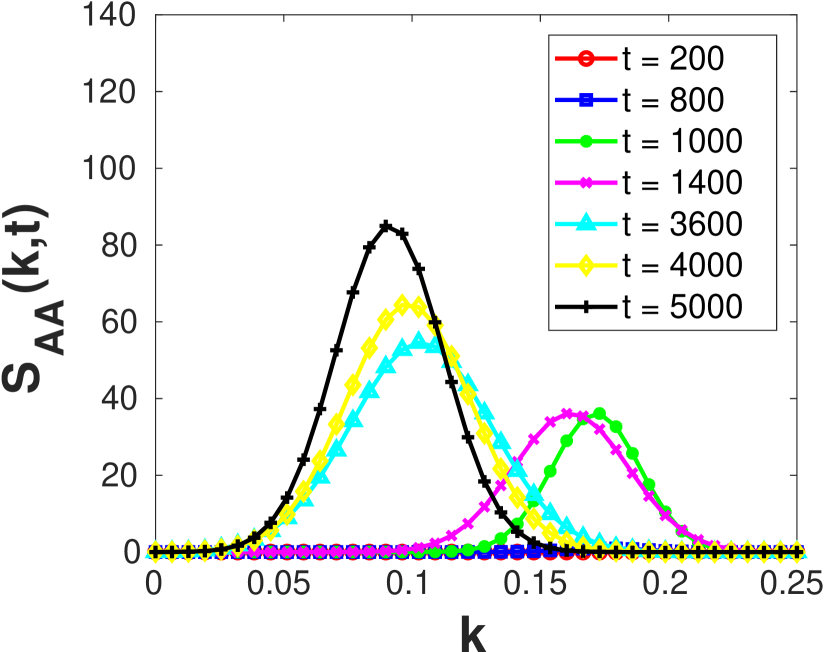
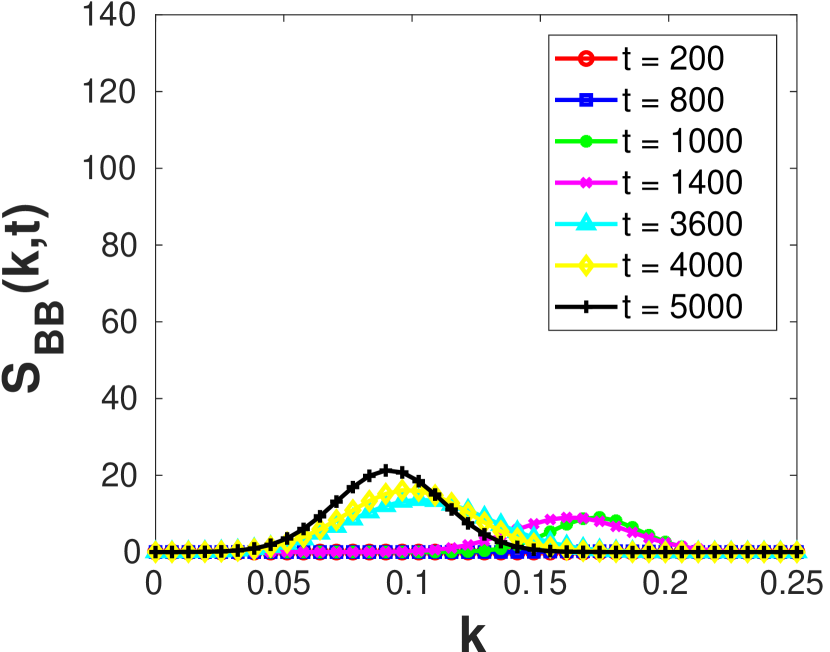
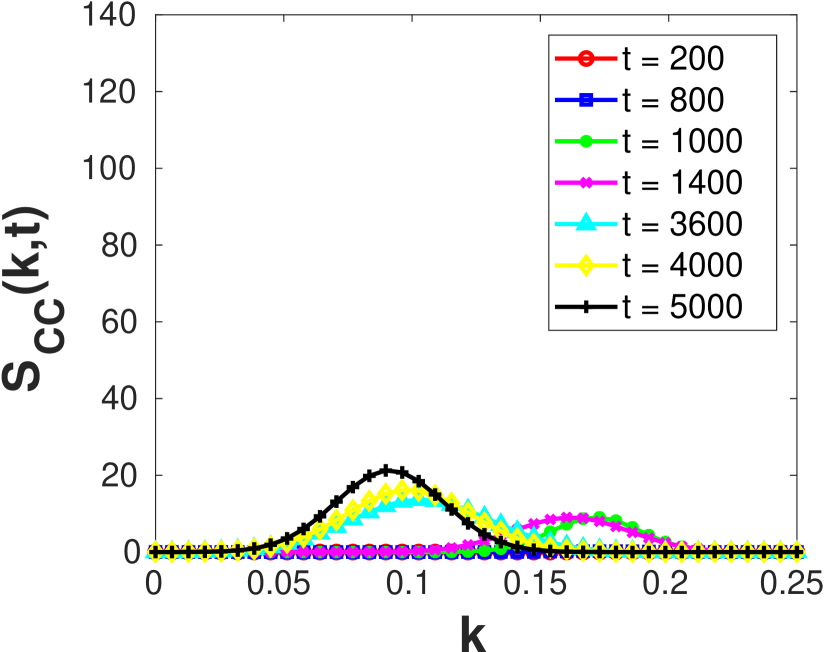
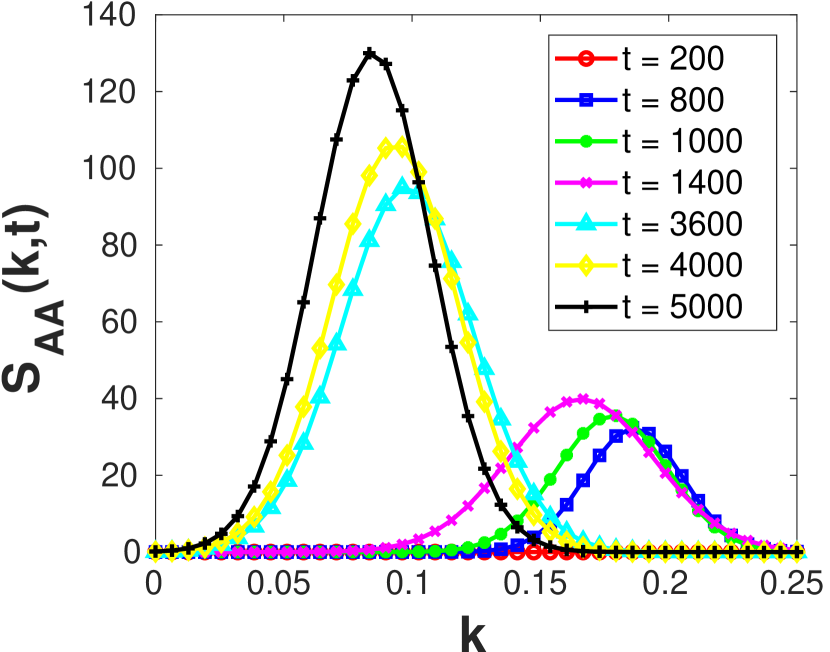
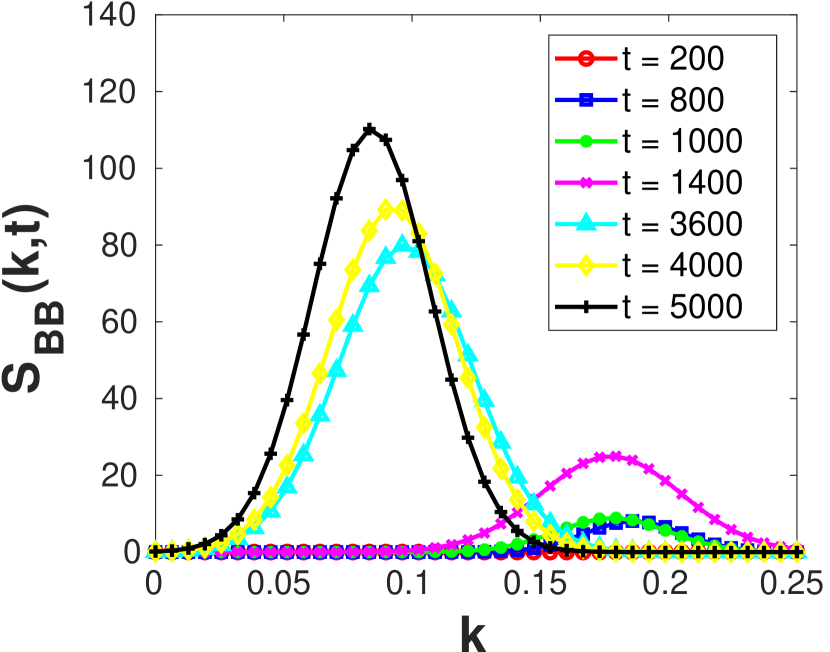
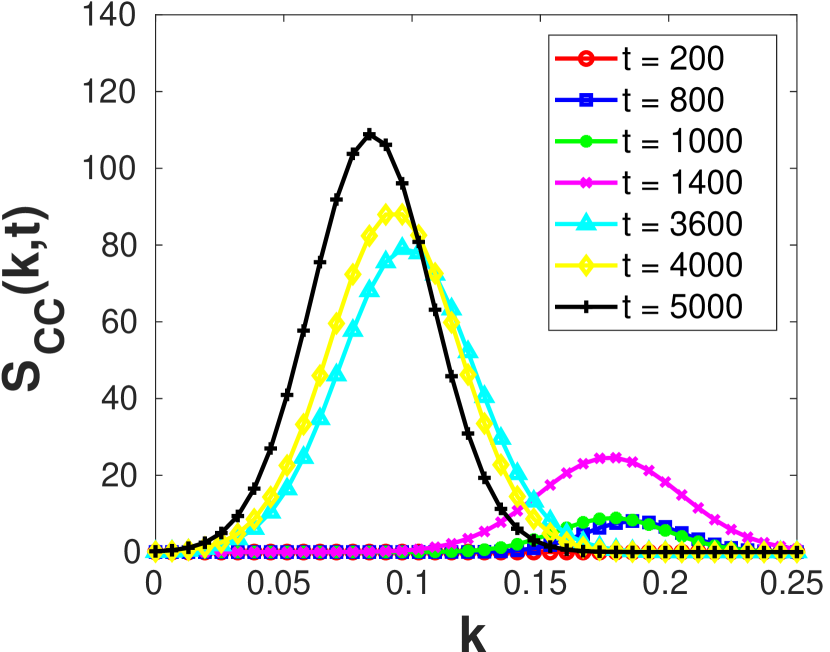
The structure function curves exhibit certain common characteristics for all alloy systems undergoing SD: they are broad and shallow at the initial stages of SD, become narrower and sharper with increasing time, and the position of the peak shifts to lower values of at the later stages, indicating coarsening of domains. Moreover, the area under the curve denotes the extent of partitioning of species during SD. Note that can be used as a measure of the characteristic length scale of rich, -rich and rich clusters.
The evolution of structure functions for alloy systems , , and are shown in Fig. 5. For alloy system , rich domains appear late (), as is evident from the evolution of (Fig. 5(a)). On the other hand, and show similar behavior with respect to the extent of decomposition and domain coarsening (Figs. 5(b), 5(c)). Comparison of areas under the , and curves at indicates that , associated with larger misfit, partitions to a lesser extent.
In alloy , although the curves and develop peaks of low intensity during the evolution (Figs. 5(e), 5(f)), comparison of the areas enclosed by and with respect to that by (Fig. 5(d)) at points to a pseudo-binary phase separation producing -rich and -poor domains. The broad and shallow nature of and curves indicates negligibly small partitioning of and within the poor domains.
In alloy system , the peak in the curve (Fig. 5(g)) appears earlier () than that corresponding to . Thus, the decomposition of into rich and poor regions produce finer domains than in . Moreover, at , a noticeable increase in peak values of and indicates secondary SD of poor region producing rich and rich domains (Figs. 5(h), 5(i)). The behavior of the structure functions confirm our earlier findings on morphological evolution and compositional history for these three systems.
3.4 Effect of misfit strain on solute partitioning
We demonstrate the effect of degree of misfit on solute partitioning using an rich asymmetric alloy , where is a minority constituent (). The alloy is categorized on the basis of misfit strains and as given below:
-
1.
-
2.
-
3.
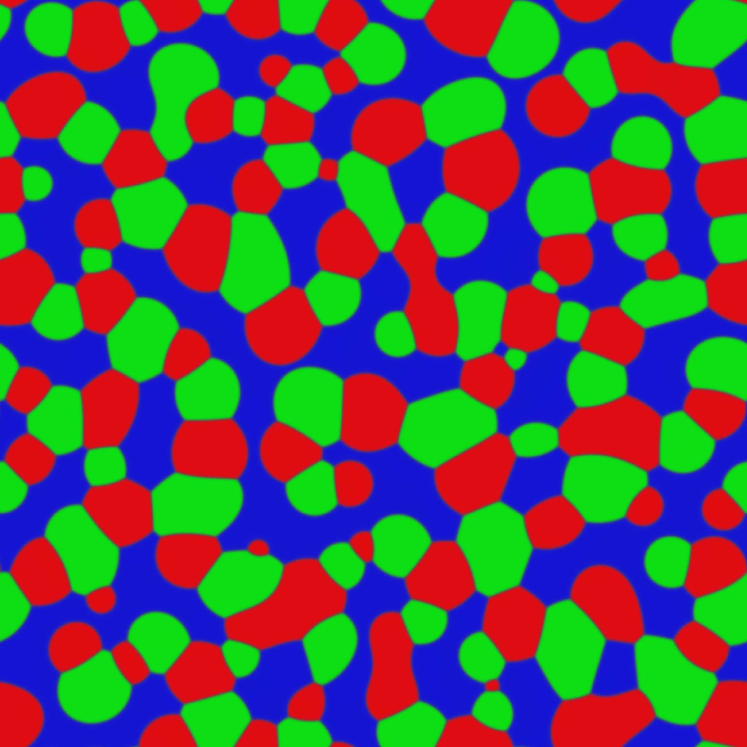
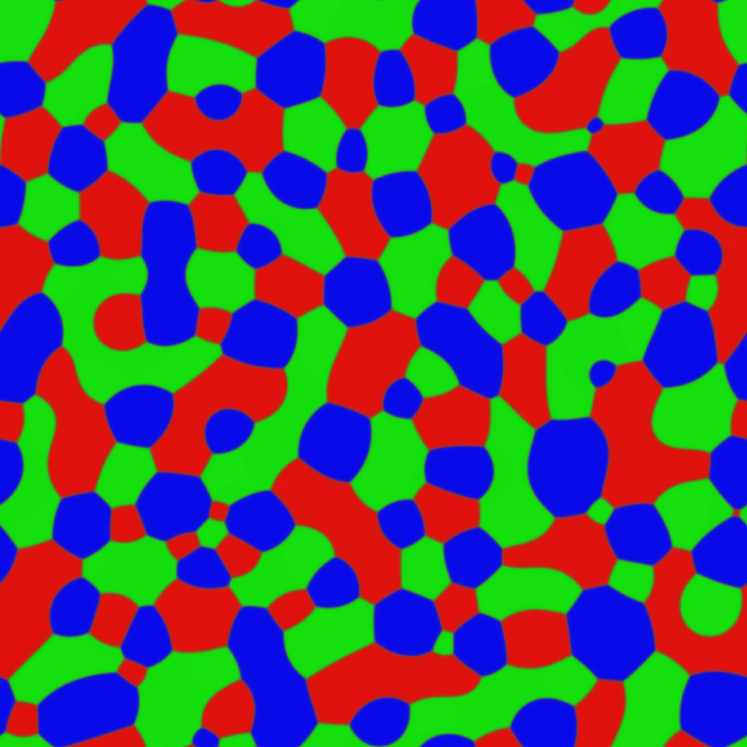
Figs. 6(a), 6(b), and 6(c) show the time snapshots of microstructures of alloys , , and , respectively. In these alloy systems, SD produces rich domains in matrix. In alloy system , has misfit of same magnitude and sign (positive) with both and . Therefore, has a larger lattice parameter than both and . Also, there is no misfit between and (). Large misfit between matrix and rich particles impedes partitioning of at the early stages of SD. Therefore, the decomposition into rich and poor regions require a mechanism to lower the coherency strain energy between them. Reduction in coherency strain involves partitioning of minority component into matrix. Such selective partitioning of leads to the formation of domains in matrix.
The decomposition in alloy , yielding and phases, begins earlier than in . Therefore, the microstructure of contains finer particles in matrix (Fig. 6(b)). In this system, the lattice parameter of lies between those of and (). Preferential partitioning of to rich regions significantly reduces the effective misfit strain between and .
In system , has the same misfit with and (). Therefore, in this case, the interface between and gets enriched in . At the intermediate stages, further decomposition leads to the formation of particles at the - boundaries (Fig. 6(c)).
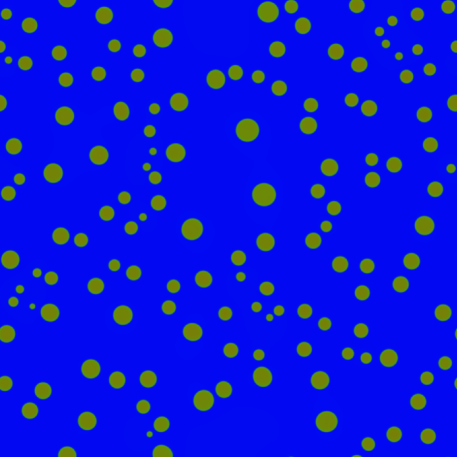
The composition profiles of across - interfaces in , and alloy systems demonstrate the role of degree and sign of misfit on solute partitioning (Fig. 7). The relative magnitude of lattice expansion coefficients associated with B decides the partitioning of to either or . When the degree of misfit of with is higher than that with (), partitions to phase (). On the other hand, partitions to particle when we reverse the condition on the misfit associated with (). However, when has the same degree of misfit relative to and , it segregates to the boundary (). In all cases, strain energy minimization leads to preferential partitioning of .
The partition coefficient of (), defined as the ratio of concentration of in particle to its concentration in the matrix, are estimated for these alloy systems. for , and are , and , respectively. A partition coefficient value close to unity indicates preferential segregation of solute at the interface.
3.5 Effect of relative interfacial energies ()
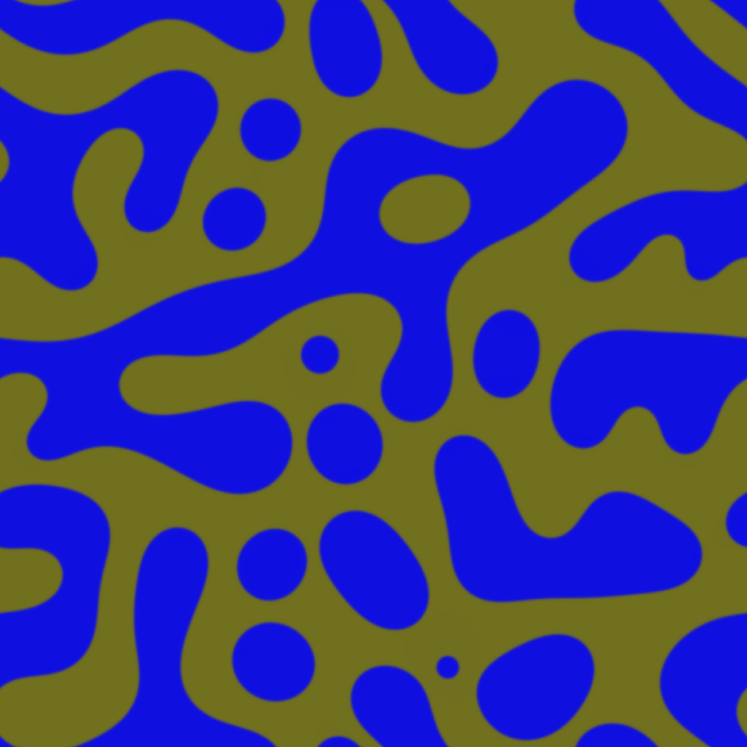
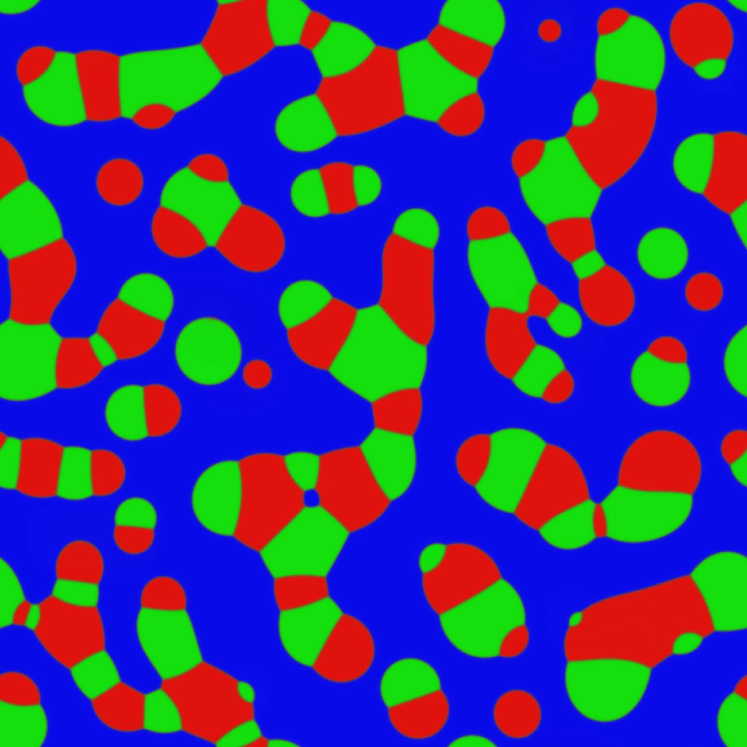
Additionally, we vary the interfacial energies between the phases to understand the interactions between interfacial energy and coherency strain energy on morphological development during ternary SD. To this effect, we introduce a new system by modifying the bulk free energy coefficients () and gradient energy coefficients () such that the relative interfacial energies between the coexisting phases satisfy Cahn’s spinodal wetting condition [48]: ().
We compare the microstructure of alloy with another alloy belonging to the new system where interfacial energies obey perfect wetting condition (Fig. 8). We choose the alloy composition () and the set of misfit strains () of to be the same as those of . Microstructure corresponding to contains chains comprised of alternating beads of and embedded in the matrix. On the other hand, microstructure of shows discrete particles completely wetted by films dispersed in matrix. In both cases, the misfit between and is zero. This example clearly shows how the interaction between elastic and interfacial energies affects the morphology.
3.6 Phase separation in alloys with compositions in the regions of absolute stability (Region III)
Further, we use this model to study phase separation in alloy systems whose compositions lie in the positive definite region (Region III). In this case, phase separation happens via nucleation and growth. Such alloy compositions can be used to study the development of compact core-shell morphology. However, the stability of the compact morphology will depend on the relative interfacial energies and the sign and degree of misfit between the phases.
We illustrate the development of core-shell morphology using an alloy () with perfect wetting condition imposed on interfacial energies between the coexisting phases. The alloy is categorized on the basis of misfit strains and as given below:
-
1.
-
2.
We incorporate nuclei with equilibrium composition at random positions in a supersaturated matrix. We use classical nucleation theory to calculate the radius of the critical nucleus of a given composition. Alloy system shows the development of stable core-shell microstructure at ( core enclosed by shell (Fig. 9(a))). Since in this case, the core-shell morphology remains stable till the late stages. In contrast, rich shell grows inwards with the dissolution of core in system (Fig. 9(b)). The destabilization of core-shell structure is attributed to large misfit strain between and (). This is yet another example describing the interplay between interfacial and elastic strain energies.
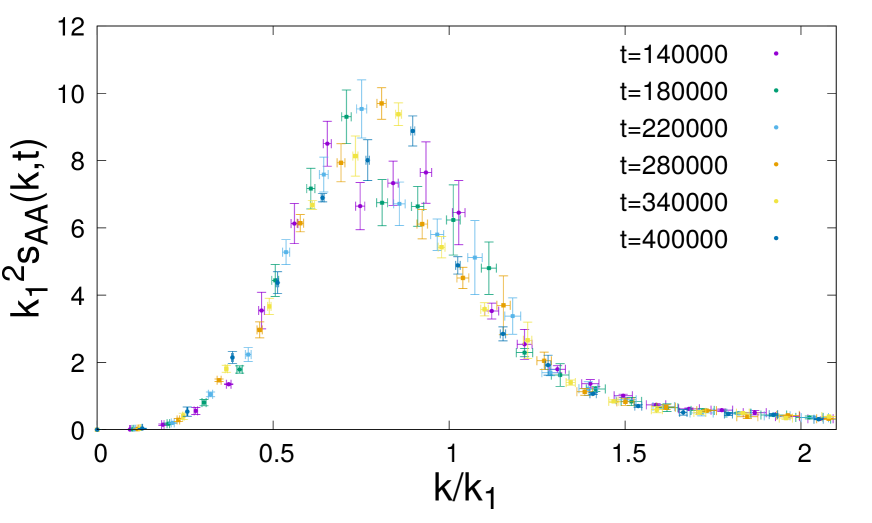
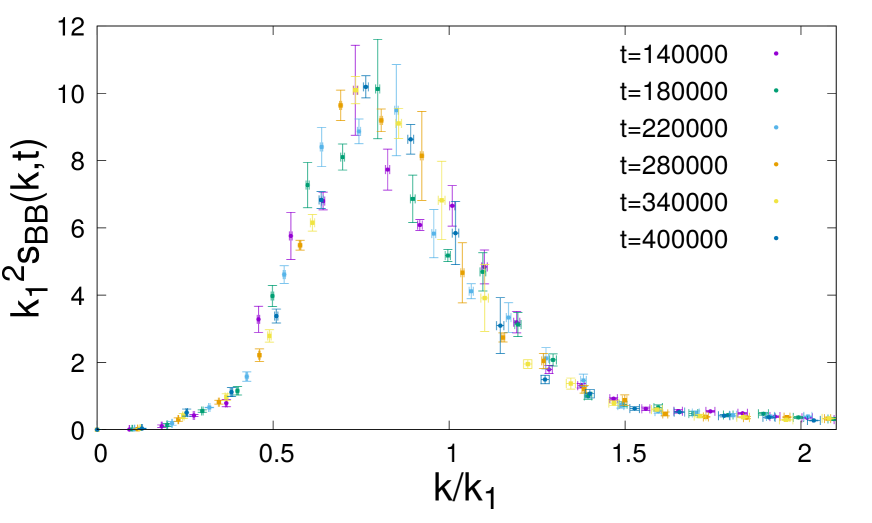
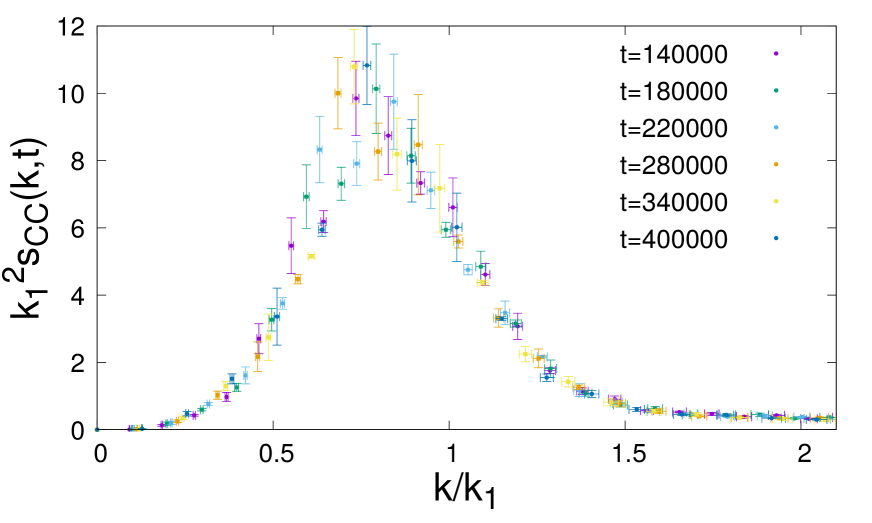
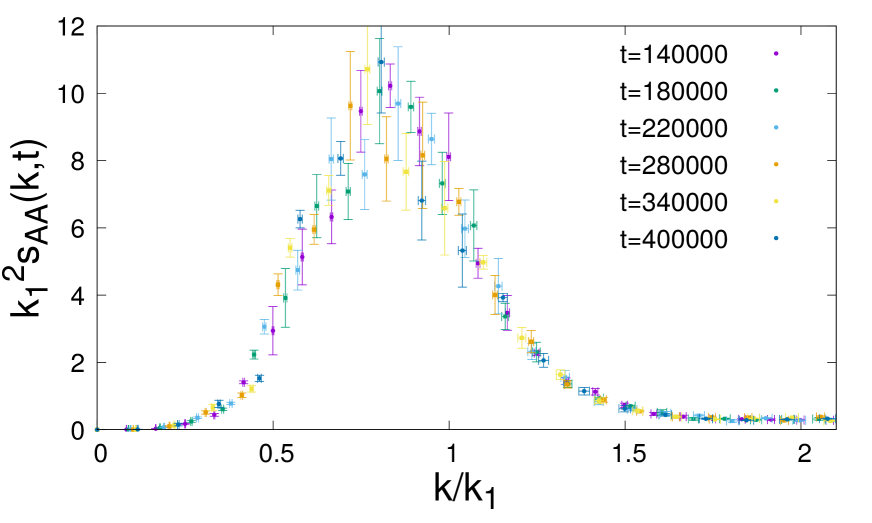
3.7 Coarsening kinetics of , , and domains in equiatomic alloys
In order to determine the dynamics of coarsening of multiple domains in equiatomic alloys , and , we need to ascertain the existence of a self-similar regime where the three-phase microstructure can be dynamically scaled using a characteristic time-dependent length for each phase [49]. Thus, to study the dynamics of coarsening of rich, rich and rich domains, we determine a characteristic length scale of the microstructure for each domain and record its temporal evolution. The characteristic length represents the time-dependent size of a domain.
We can use different measures to define the characteristic length scale. Here we use inverse of the first moment of as the characteristic length [46]:
| (15) |
where .
In all systems, the scaled structure functions for each phase fall on a single curve (accurate within numerical uncertainties) indicating self-similarity of the microstructures during coarsening and the existence of dynamic scaling regime (Fig. 10). Therefore, we apply the classical LSW temporal power law to analyze the coarsening rates of each phase in each system [26, 27]. denotes the characteristic domain size at time . However, in a recent study, Sun et al. argue that the LSW power law holds true although the microstructure does not show self-similarity. Thus, the cubic power law may be applied even in cases where the morphological evolution does not enter dynamic scaling regime [49].


In equiatomic systems and , we compare the coarsening rates of the coexisting phases , , and in Figs. 11(a) and 11(b), respectively. However, system contains particles in a rich matrix. Since phase separation of rich regions is completely arrested in this case, a comparison of the coarsening kinetics of all phases is not possible in system .
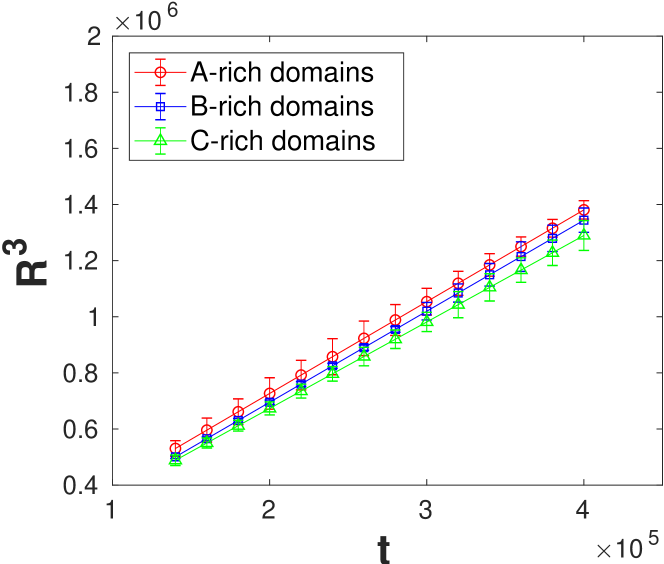
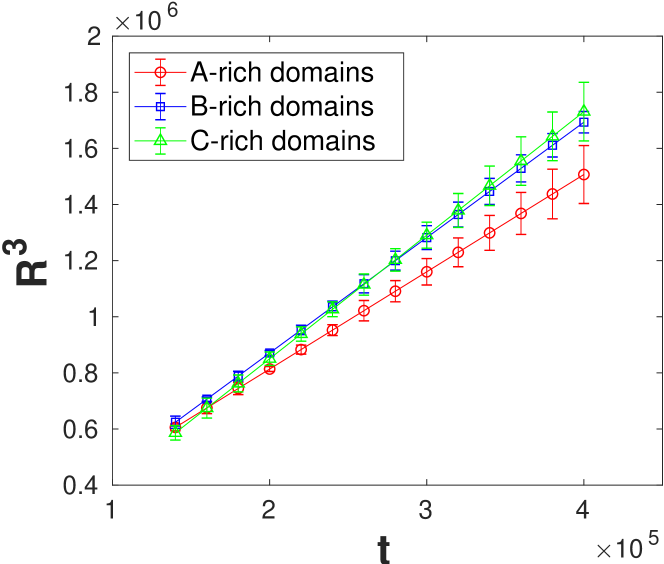
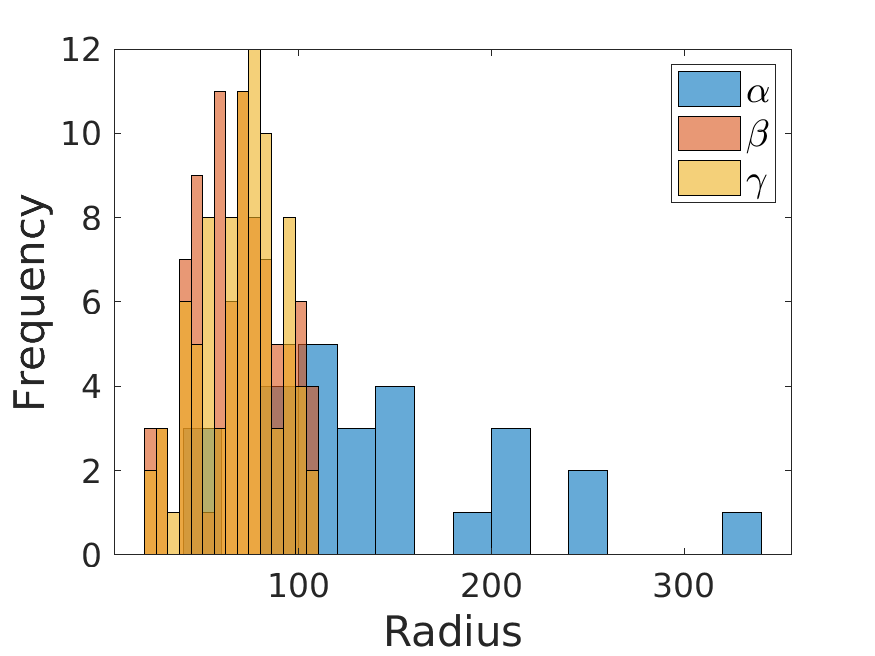
In , domains form late and they appear coarser than and . All the three phases coarsen at a similar rate, although domains are associated with larger coherency strain (Fig. 11(a)). Since in this case, the system tries to maximize the number of interfaces. As a result, and have a narrower size distribution. On the other hand, shows a wider size distribution (see Fig 12(a)). These competing factors lead to similar coarsening rates for all the domains in .
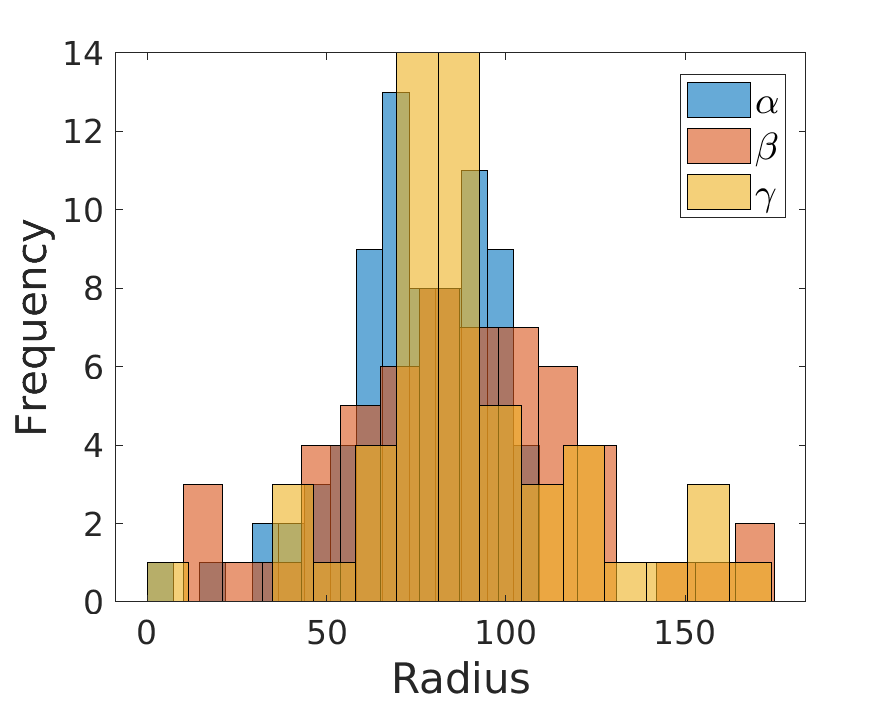
However, in , where the misfits between the coexisting phases are unequal, and domains are coarser and they coarsen faster than (Fig. 11(b)). Although the misfit between and domains is high in this case (, these domains are more extended and have wider size distribution than (see Fig. 12(b)). Thus, the and domains coarsen faster in this case.
4 Conclusions
We developed a phase-field model to study phase separation in ternary alloys with coherent misfit. Our simulations demonstrate the effects of sign and degree of misfit between the phases on their morphological evolution during ternary SD. Both magnitude and sign of relative misfit between the phases significantly alter the kinetic paths during the early stages of phase separation and lead to morphological changes during subsequent growth and coarsening.
Strain partitioning and, as a consequence, solute partitioning influence the morphology as well as the coarsening kinetics of the phases. The phases associated with large misfits appears coarser and exhibit wider particle size distributions, whereas those associated with low misfits coarsen faster and show narrower particle size distributions.
Further, our simulations show the development of stable composite morphologies (core-shell) when the interfacial energies as well as coherency strain energies between the phases favor selective wetting conditions (, ).
Acknowledgments
The authors would like to acknowledge the financial support from R D and SS, Tata Steel Ltd.
References
References
- [1] P. W. Voorhees, W. C. Johnson, The thermodynamics of elastically stressed crystals, Solid State Physics-Advances in Research and Applications 59 (C) (2004) 1–201.
- [2] G. Kostorz, Metals and alloys: Phase separation and defect agglomeration, in: Modern Aspects of Small-Angle Scattering, Springer, 1995, pp. 255–266.
- [3] M. Doi, Elasticity effects on the microstructure of alloys containing coherent precipitates, Progress in Materials Science 40 (2) (1996) 79–180.
- [4] P. Fratzl, O. Penrose, J. L. Lebowitz, Modeling of phase separation in alloys with coherent elastic misfit, Journal of Statistical Physics 95 (5-6) (1999) 1429–1503.
- [5] T. A. Abinandanan, Computer modelling of elastic stress effects during precipitation, Bulletin of Materials Science 20 (6) (1997) 901–908.
- [6] F. Findik, Modulated structures in Cu-32Ni-3Cr and Cu-46Ni-17Cr alloys, Canadian metallurgical quarterly 41 (3) (2002) 337–347.
- [7] T. F. Liu, C. M. Wan, -mn structure in a fealmncr alloy, Scripta metallurgica 19 (6) (1985) 727–732.
- [8] J. A. Hanna, I. Baker, M. W. Wittmann, P. R. Munroe, A new high-strength spinodal alloy, Journal of materials research 20 (4) (2005) 791–795.
-
[9]
R. Cozar, A. Pineau, Morphology
of y’ and y” precipitates and thermal stability of inconel 718 type
alloys, Metallurgical Transactions 4 (1) (1973) 47–59.
doi:10.1007/bf02649604.
URL https://doi.org/10.1007{%}2Fbf02649604 - [10] V. Radmilovic, C. Ophus, E. A. Marquis, M. D. Rossell, A. Tolley, A. Gautam, M. Asta, U. Dahmen, Highly monodisperse core–shell particles created by solid-state reactions, Nature materials 10 (9) (2011) 710.
-
[11]
S. Kumar Makineni, S. Sugathan, S. Meher, R. Banerjee, S. Bhattacharya,
S. Kumar, K. Chattopadhyay,
Enhancing elevated
temperature strength of copper containing aluminium alloys by forming L12
Al3Zr precipitates and nucleating ″ precipitates on them,
Scientific Reports 7 (1) (2017) 11154+.
doi:10.1038/s41598-017-11540-2.
URL https://doi.org/10.1038/s41598-017-11540-2 - [12] E. J. Pickering, H. J. Stone, N. G. Jones, Fine-scale precipitation in the high-entropy alloy Al0. 5CrFeCoNiCu, Materials Science and Engineering: A 645 (2015) 65–71.
- [13] L. J. Santodonato, Y. Zhang, M. Feygenson, C. M. Parish, M. C. Gao, R. J. K. Weber, J. C. Neuefeind, Z. Tang, P. K. Liaw, Deviation from high-entropy configurations in the atomic distributions of a multi-principal-element alloy, Nature communications 6 (2015) 5964.
- [14] D. H. Xiao, P. F. Zhou, W. Q. Wu, H. Y. Diao, M. C. Gao, M. Song, P. K. Liaw, Microstructure, mechanical and corrosion behaviors of AlCoCuFeNi-(Cr, Ti) high entropy alloys, Materials & Design 116 (2017) 438–447.
- [15] J. E. Morral, S. L. Chen, High entropy alloys, miscibility gaps and the Rose geometry, Journal of Phase Equilibria and Diffusion 38 (3) (2017) 319–331.
- [16] W. C. Johnson, P. W. Voorhees, D. E. Zupon, The effects of elastic stress on the kinetics of Ostwald ripening: the two-particle problem, Metallurgical Transactions A 20 (7) (1989) 1175–1187.
- [17] T. A. Abinandanan, W. C. Johnson, Coarsening of elastically interacting coherent particles—I. Theoretical formulation, Acta metallurgica et materialia 41 (1) (1993) 17–25.
-
[18]
J. K. Lee, J. M. T. Univ., Houghton, M. U. S. D. o. M. Engineering), Materials,
Coherency
strain analyses via a discrete atom method, Scripta Metallurgica et
Materialia 32 (4) (1995) 559–564.
doi:10.1016/0956-716X(95)90837-A.
URL http://linkinghub.elsevier.com/retrieve/pii/0956716X9590837A - [19] H. Nishimori, A. Onuki, Pattern formation in phase-separating alloys with cubic symmetry, Physical Review B 42 (1) (1990) 980.
- [20] A. Onuki, H. Nishimori, Anomalously slow domain growth due to a modulus inhomogeneity in phase-separating alloys, Physical Review B 43 (16) (1991) 13649.
- [21] N. Zhou, D. C. Lv, H. L. Zhang, D. McAllister, F. Zhang, M. J. Mills, Y. Wang, Computer simulation of phase transformation and plastic deformation in IN718 superalloy: microstructural evolution during precipitation, Acta Materialia 65 (2014) 270–286.
- [22] R. Shi, D. P. McAllister, N. Zhou, A. J. Detor, R. DiDomizio, M. J. Mills, Y. Wang, Growth behavior of ’/”coprecipitates in ni-base superalloys, Acta Materialia 164 (2019) 220–236.
- [23] D. De Fontaine, An analysis of clustering and ordering in multicomponent solid solutions—I. Stability criteria, Journal of Physics and Chemistry of Solids 33 (2) (1972) 297–310.
- [24] J. E. Morral, J. W. Cahn, Spinodal decomposition in ternary systems, Acta metallurgica 19 (10) (1971) 1037–1045.
- [25] J. J. Hoyt, Spinodal decomposition in ternary alloys, Acta metallurgica 37 (9) (1989) 2489–2497.
- [26] I. M. Lifshitz, V. V. Slyozov, The kinetics of precipitation from supersaturated solid solutions, Journal of physics and chemistry of solids 19 (1-2) (1961) 35–50.
- [27] C. Wagner, Theorie der alterung von niederschlägen durch umlösen (ostwald-reifung), Zeitschrift für Elektrochemie, Berichte der Bunsengesellschaft für physikalische Chemie 65 (7-8) (1961) 581–591.
- [28] S. K. Bhattacharyya, K. C. Russell, Activation energies for the coarsening of compound precipitates, Metallurgical Transactions 3 (8) (1972) 2195–2199.
- [29] J. Hoyt, Coarsening in multiphase multicomponent systems—i. the mean field limit, Acta materialia 47 (1) (1998) 345–351.
- [30] T. Philippe, P. W. Voorhees, Ostwald ripening in multicomponent alloys, Acta Materialia 61 (11) (2013) 4237–4244.
- [31] K. G. Wang, G. Q. Wang, Phase coarsening in multicomponent systems, Physical Review E 95 (2) (2017) 22609.
- [32] L. Q. Chen, A computer simulation technique for spinodal decomposition and ordering in ternary systems, Scripta Metallurgica et Materialia;(United States) 29 (5).
- [33] L. Q. Chen, Computer simulation of spinodal decomposition in ternary systems, Acta metallurgica et materialia 42 (10) (1994) 3503–3513.
- [34] D. J. Eyre, Systems of Cahn–Hilliard equations, SIAM Journal on Applied Mathematics 53 (6) (1993) 1686–1712.
-
[35]
S. Bhattacharyya, T. A. Abinandanan,
Evolution
of multivariant microstructures with anisotropic misfit: A phase field
study, Acta Materialia 57 (3) (2009) 646–656.
doi:https://doi.org/10.1016/j.actamat.2008.10.008.
URL http://www.sciencedirect.com/science/article/pii/S1359645408007209 - [36] S. Ghosh, A. Mukherjee, T. A. Abinandanan, S. Bose, Particles with selective wetting affect spinodal decomposition microstructures, Physical Chemistry Chemical Physics 19 (23) (2017) 15424–15432.
- [37] S. Bhattacharyya, T. A. Abinandanan, A study of phase separation in ternary alloys, Bull. Mater. Sci 26 (1) (2003) 193–197.
- [38] A. G. Khachaturyan, Theory of structural transformations in solids, Courier Corporation, 2013.
- [39] E. J. Kramer, P. Green, C. J. Palmstrøm, Interdiffusion and marker movements in concentrated polymer-polymer diffusion couples, polymer 25 (4) (1984) 473–480.
- [40] A. R. Allnatt, A. B. Lidiard, Atomic Transport in Solids, Cambridge University Press, 1993. doi:10.1017/CBO9780511563904.
- [41] L. Q. Chen, J. Shen, Applications of semi-implicit Fourier-spectral method to phase field equations, Computer Physics Communications 108 (2-3) (1998) 147–158.
-
[42]
J. Zhu, L.-Q. Chen, J. Shen, V. Tikare,
Coarsening kinetics
from a variable-mobility Cahn-Hilliard equation: Application of a
semi-implicit Fourier spectral method, Phys. Rev. E 60 (4) (1999)
3564–3572.
doi:10.1103/PhysRevE.60.3564.
URL https://link.aps.org/doi/10.1103/PhysRevE.60.3564 - [43] M. Fiałkowski, A. Aksimentiev, R. Hołyst, Scaling of the Euler characteristic, surface area, and curvatures in the phase separating or ordering systems, Physical review letters 86 (2) (2001) 240.
- [44] A. Aksimentiev, M. Fialkowski, R. Holyst, Morphology of surfaces in mesoscopic polymers, surfactants, electrons, or reaction-diffusion systems: Methods, simulations, and measurements, Advances in Chemical Physics 121 (2002) 141–240.
- [45] M. Fiałkowski, R. Hołyst, Morphology from the maximum entropy principle: Domains in a phase ordering system and a crack pattern in broken glass, Physical Review E 65 (5) (2002) 57105.
- [46] S. Bhattacharya, Ternary Spinodal Decomposition: Effect of Interfacial Energy (Doctoral dissertation), Indian Institute of Science, Bangalore.
- [47] A. Chakrabarti, R. Toral, J. D. Gunton, Late-stage coarsening for off-critical quenches: Scaling functions and the growth law, Physical Review E 47 (5) (1993) 3025.
- [48] J. W. Cahn, Critical point wetting, The Journal of Chemical Physics 66 (8) (1977) 3667–3672.
- [49] Y. Sun, W. B. Andrews, K. Thornton, P. W. Voorhees, Self-similarity and the dynamics of coarsening in materials, Scientific reports 8 (1) (2018) 17940.