Theory of a cavity around a large floating sphere in complex (dusty) plasma
Abstract
In the last experiment with the PK-3 Plus laboratory onboard the International Space Station, interactions of millimeter-size metallic spheres with a complex plasma were studied [M. Schwabe et al., New J. Phys. 19, 103019 (2017)]. Among the phenomena observed was the formation of cavities (regions free of microparticles forming a complex plasma) surrounding the spheres. The size of the cavity is governed by the balance of forces experienced by the microparticles at the cavity edge. In this article we develop a detailed theoretical model describing the cavity size and demonstrate that it agrees well with sizes measured experimentally. The model is based on a simple practical expression for the ion drag force, which is constructed to take into account simultaneously the effects of non-linear ion-particle coupling and ion-neutral collisions. The developed model can be useful for describing interactions between a massive body and surrounding complex plasma in a rather wide parameter regime.
I Introduction
Understanding fundamental interactions between an object and surrounding plasma is an exceptionally important problem with application to astrophysical topics Goertz (1989); Shukla (2002), plasma technology Bouchoule (1999), plasma medicine Kong et al. (2009), complex (dusty) plasmas Fortov et al. (2004, 2005); Morfill and Ivlev (2009) and fusion related problems Winter (1998). Considerable progress on the interaction of micron-size plastic particles with weakly ionized plasma medium has been achieved thanks to complex plasma research program under microgravity conditions onboard the International Space Station (ISS). This particularly concerns particle charging, the ion drag force, interparticle interactions, linear and non-linear wave phenomena, see for instance Ref. Thomas et al. (2018) for a recent review.
Here another related problem is addressed, namely how a bigger object interacts with surrounding complex plasma. New information about these interactions has been obtained from the last experimental campaign with PK-3 Plus laboratory onboard ISS Schwabe et al. (2017). In these experiments the metallic spheres of one millimeter diameter were injected into a low-temperature rf discharge together with microparticles forming a complex plasma. Various phenomena were observed, including motion of spheres through a complex plasma cloud, generation of bubbles, “repulsive attraction”, and excitation of low-frequency waves Schwabe et al. (2017).
It was also observed that when a sphere passes through a complex plasma cloud, it is surrounded by a cavity of a few millimeter in diameter, where no microparticles are present. It is the size of the cavity which is the main object of interest here. The size of the cavity is relatively easy to measure and it contains important information about the system parameters. The size obviously depends on the balance of forces acting on the particles located at the cavity edge. The main forces identified are the short-range electric repulsion from the highly charged sphere and the long-range attraction triggered by the ion flow (the ion drag force), which is directed towards the sphere surface Schwabe et al. (2017). In this article we first propose a simple practical expression for the ion drag force for the conditions relevant for the experiment. In particular, this expression allows us to take into account simultaneously the effects of non-linear ion-particle coupling and ion-neutral collisions. Then, using this expression, we formulate the force balance condition and estimate theoretically the cavity diameter. We show that the estimated diameter agrees well with the results of experimental measurements.
The theoretical approximation developed here should be applicable (possibly with some modifications) to other situations corresponding to the interaction of large objects with complex plasmas, such as for instance probe-induced voids and particle circulations Law et al. (1998); Thompson, D’Angelo, and Merlino (1999); Samsonov et al. (2001); Thomas, Avinash, and Merlino (2004); Klindworth et al. (2004); Harris, Matthews, and Hyde (2015), as well as the formation of boundary-free clusters Usachev et al. (2009).
II Experiment
The experiment to be discussed is the last experiment of the PK-3 Plus laboratory, which operated onboard the ISS in 2006-2013 Thomas et al. (2018, 2008); Khrapak et al. (2016). The experiment is described in detail in Ref. Schwabe et al. (2017). Here we provide only the brief summary, necessary for the understanding of this article.
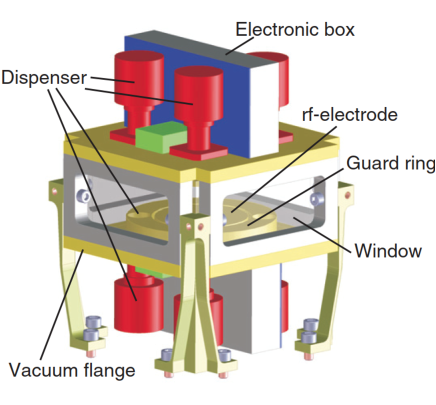
The PK-3 Plus laboratory consisted of a radio-frequency plasma chamber with two electrodes of cm in diameter separated by a distance of 3 cm. The electrodes were surrounded by grounded guard rings, see sketch in Fig. 1. Dispensers mounted in the guard rings were used to introduce microparticles of various sizes into the gas discharge. Highly charged microparticles formed large symmetric three-dimensional clouds in the plasma bulk. Typically, these clouds contained a central particle-free region – the so-called “void” – attributed to the action of the ion drag force, pushing the particles to the periphery Thomas et al. (2018); Goree et al. (1999); Gozadinos, Ivlev, and Boeuf (2003); Kretschmer et al. (2005); Lipaev et al. (2007); Goedheer and Land (2008). Strong interparticle interactions between microparticles resulted in structures typical for the fluid and solid states. Structural and dynamical properties of the particle component were studied at the most fundamental kinetic level, providing new insight into the physics of a new plasma state of soft condensed matter Chaudhuri et al. (2011).
Many important fundamental phenomena were studied using PK-3 Plus laboratory, including, for instance, equilibrium and non-equilibrium phase transitions Wysocki et al. (2010); Sütterlin et al. (2010); Khrapak et al. (2011, 2012), lane formation Du et al. (2012), wave excitation Schwabe et al. (2008), instabilities Schwabe, Zhdanov, and Räth (2017); Heidemann et al. (2011), Mach cones Schwabe et al. (2011); Zhukhovitskii et al. (2015), etc.
In the experiment discussed here interactions between millimeter size metallic spheres and complex plasmas under microgravity conditions were studied. Previously, penetration of complex plasma clouds by fast charged projectiles was already investigated under microgravity conditions Arp, Caliebe, and Piel (2011); Caliebe, Arp, and Piel (2011). In particular, the dynamics of the formation of an elongated cavity in the projectile’s wake was analyzed in detail. Present work deals with much larger and slower objects interacting with complex plasma.
For the purpose of the experiment, the dispensers were shaken so strong that the metallic spheres of 1 mm diameter that were present inside the dispensers broke through the sieve and entered the bulk plasma region together with the microparticles remaining in the dispensers Schwabe et al. (2017). Furthemore, the cosmonaut Pavel Vinogradov, who performed the experiment, shook the experimental container to impact momentum on the spheres. The shaking had little effect on the plasma and microparticles, but accelerated spheres by collisions with chamber walls. As a result, the spheres experienced an almost force-free motion inside the discharge chamber Schwabe et al. (2017).
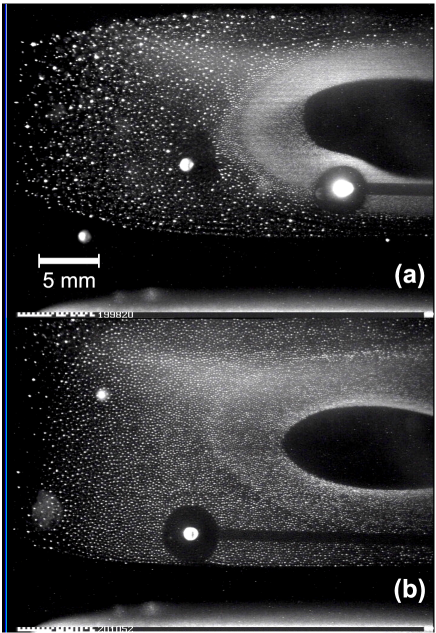
The analysis of the motion of spheres through complex plasma clouds was reported previously Schwabe et al. (2017). Here the main interest is to the size of the cavities that are created around the spheres. The size can be relatively easily estimated for events when the spheres cross the plane formed by the laser sheet used to illuminate complex plasma. Two such exemplary events are shown in Fig. 2. About twenty such events have been analyzed and the sizes of the cavities have been estimated as follows. The crossing of a laser sheet by the sphere corresponds to several video frames. From these frames a single frame with the largest cavity size is selected. After correcting the aspect ratio of the video frame, it has been verified that the observed cross sections of the cavities have a shape close to a circle. In a graphical editor, a circle has been selected that fits most accurately into the cavity observed on the frame. The diameter of this circle is used as an estimate of the cavity diameter. The relative error in estimating the diameter does not exceed 5 . More accurate evaluation of the cavity size and shape can be made from a careful analysis of three-dimensional trajectories of the spheres, as described in Ref. Schwabe et al., 2017 for a single crossing event, but this is not necessary for the present purpose.
The sizes of the cavities have been measured for different neutral gas pressures (in the range between and Pa) and for situations where the spheres were interacting with microparticles of different sizes (complex plasma cloud consisted of particles with diameters of 1.55, 2.55, 3.42, 6.8, 9.19, and 14.9 m as well as their agglomerates; this mixture was heterogeneous with smaller particles located closer to the discharge center and bigger particles pushed further to the periphery, see Fig 2). It has been observed that the cavity size increases with pressure, but is practically insensitive to the microparticles size with which sphere is interacting. These trends correlate well with the results of theoretical consideration performed below.
III Theory
When a sphere is immersed into a plasma it starts to collect electrons and ions on its surface, just as smaller microparticles do. As a result both spheres and microparticles are charged negatively, the surface (floating) potential being roughly of the order of the electron temperature, which ensures that the ion and electron fluxes to the surface can balance each other. If the sphere is surrounded by a complex plasma, the particles experience the following forces. At short distances there is a strong electrostatic repulsion of negatively charged particles from the negatively charged sphere. At sufficiently long distances from the sphere, the ion drag force associated with the ion flux towards the sphere surface can overcome the electrostatic repulsion. There can be also the pressure force exerted by the microparticle cloud, directed towards the metallic sphere. This, however, was shown to be numerically small for typical experimental conditions Schwabe et al. (2017) and will not be considered.
Our main assumption is that the cavity boundary position is mainly determined by the balance between the electric repulsion at short distances and the ion-drag-mediated attraction at long distances. In the following we consider the force balance for an individual microparticle located at an equilibrium position, where both forces compensate each other. In this way we neglect (i) the effect of particles on the distribution of the electrostatic potential around the sphere and (ii) some reduction of the ion drag force in dense dust clouds Yaroshenko, Khrapak, and Morfill (2013). Both assumptions are reasonable in not too dense microparticle clouds as those observed in the experiment.
The ratio of the ion drag to the electric forces, , is known to be approximately constant for subthermal ion flows and then to decrease relatively fast in the super-thermal regime Khrapak et al. (2005). For this reason, the cavity boundary should be roughly located at a position where , where is the ion drift velocity, is the ion thermal velocity, and is the ion thermal Mach number. This implies that the perturbations created by a large floating metallic sphere at the position of the boundary are relatively small (much smaller than in the sheath region formed around the sphere surface, where the ion drift is super-sonic). This suggests to focus on the long-range asymptote of the electric potential generated by a large floating body and not on the plasma properties in its immediate vicinity. In this comparatively far region the effects associated with plasma absorption on the sphere govern the distribution of the electric potential and this simplifies considerably the consideration, as we will see below. The first step, however, is to develop an appropriate model for the ion drag force.
III.1 Ion drag force
In the parameter regime investigated, the characteristic length scale of ion-particle interactions exceeds the plasma screening length, indicating that ion-particle interactions are non-linear. Several theoretical approaches have been developed for this regime, mostly using binary collision approximation Khrapak et al. (2002, 2003, 2004); Khrapak (2014); Semenov, Khrapak, and Thomas (2017). However, these purely collisionless treatments are not very appropriate for our purpose, because ion-neutral collisions can be important in the pressure range investigated Khrapak and Morfill (2009). Collisional effects can be incorporated into kinetic or hydrodynamic calculations using the linear plasma response formalism Ivlev et al. (2004a, b, 2005); Khrapak et al. (2007). Unfortunately, as we have just discussed, the linear approximation is not justified in present conditions (as well as in most other complex plasma experiments), because of significant non-linearities in ion-particle interactions. An approach, which accounts for both non-linearity in ion-particle interactions and the effect of ion-neutral collisions is required.
Recently, the ion drag force has been calculated self-consistently and non-linearly using particle in cell codes, taking into account ion-neutral collisions Hutchinson and Haakonsen (2013). These calculations demonstrated that the magnitude of the force is sensitive to the ion velocity distribution function for superthermal ion flows. It was shown that the finite collisionality initially enhances the ion drag force up to a factor of 2 relative to the collisionless result. Larger collisionality eventually reduces the ion drag force, which can even reverse sign in the continuum limit Khrapak et al. (2007); Filippov, Zagorodny, and Momot (2008); Vladimirov et al. (2008); Semenov, Zagorodny, and Krivtsun (2013); Momot (2017), but this regime is too far from typical experimental conditions. Most important for our present purpose is that the collisional drag enhancement can be represented by an almost universal function of scaled collisionality and flow velocity, for which simple fits are available Hutchinson and Haakonsen (2013).
We pursue the following strategy. First, an ad hoc simple practical expression for the collisionless ion drag force, based on our earlier theoretical results from the binary collision approach, is derived. It is demonstrated to be in good agreement with the non-linear collisionless simulation results of Ref. Hutchinson and Haakonsen (2013). Then a correction factor, expressing the influence of ion-neutral collisions on the ion drag force, as suggested in Hutchinson and Haakonsen (2013), is added to the collisionless expression. This provides us with a new practical expression for the non-linear ion drag force in the collisional regime, which will be then used to estimate the size of the cavity around the metallic sphere.
We start with an expression for the ion drag force derived for the regime of intermediate non-linearity Khrapak et al. (2002)
| (1) |
where is the modified Coulomb logarithm
| (2) |
Other notation is as follows: is the particle radius, , , , are the ion density, mass, temperature, thermal velocity, is the particle surface potential () expressed in units of the electron temperature , is the electron-to-ion temperature ratio, and is the effective plasma screening length.
This expression applies to subthermal ion flows, . It can be considered a generalization of the standard Coulomb scattering theory, by taking into account the impact parameters beyond the plasma screening length: all ions which approach the grain closer than are included in the consideration. Therefore, it is sometimes referred to as the modified Coulomb scattering approach. Quantitatively, the approach has been originally proposed for the regime , where is known as the scattering parameter Khrapak et al. (2003). In the regime , it reduces to the conventional Coulomb scattering theory.
We can further simplify Eqs. (1) and (2) as follows. We neglect the collection part of the momentum transfer [first two terms in brackets of Eq. (1)]. In the expression for the modified Coulomb logarithm we make use of the typical condition to arrive at
Thus, the modified Coulomb logarithm depends mainly on , and it is easy to demonstrate (by way of direct numerical integration) that for the integral above can be very well approximated as . In the non-linear regime considered this becomes simply . This allows us to write
| (3) |
This represents an expression for the non-linear ion drag force in the collisionless regime to be compared with numerical results from Ref. Hutchinson and Haakonsen (2013). In that numerical investigation the particle surface potential as well as the electron-to-ion temperature ratio were fixed to and , respectively. The ratio varied in the range from 10 to 200, where is the electron Debye radius. The ion drag force was expressed in units of . To simplify the comparison we can rewrite Eq. (3) as
| (4) |
where is the ion sound velocity. In arriving to Eq. (4) we assumed quasineutrality, , and used the dominance of ion screening, . Note also that . The obtained formula (4) demonstrates very close agreement with the numerical results presented in Figs. 8, 9 and 10(a) of Ref. Hutchinson and Haakonsen (2013). Thus, the region of validity of the approximation (3), , is somewhat expanded in the non-linear regime compared to the original approach (1) designed for . Moreover, detailed comparison shows that it is reliable not only for the subthermal regime, but also for near-thermal and slightly superthermal ion flows (in the regime where difference in ion velocity distribution functions does not lead to considerable variations in the ion drag force). Further insight comes from the careful analysis of the data shown in Fig. 10(b) of Hutchinson and Haakonsen (2013), which demonstrates that in the collisionless limit Eq. (4) remains accurate even at (), provided the microparticles are not too small ( ).
The collisional enhancement of the ion drag force can be expressed as a product of the collisionless force and a collisional correction factor Hutchinson and Haakonsen (2013)
| (5) |
with
| (6) |
where is the reduced collisionality and is the non-linear shielding cloud radius, derived in Ref. Hutchinson and Haakonsen (2013). The latter is approximately
The coefficients provided in Ref. Hutchinson and Haakonsen (2013) for the drift distribution of ion velocities (which is more appropriate for ions drifting through the stationary background of neutrals under the action of electric force, compared to a conventional shifted Maxwellian distribution) are
Let us now compare the magnitudes of the electrostatic and ion drag forces in the limit of a weak electric field , when the ion drift is subthermal. The ion drift velocity is expressed
| (7) |
where is the effective collision frequency, which is field-dependent in general, but constant in the subthermal drift regime (weak electric field) Frost (1957); Khrapak (2013). The electrostatic force is
| (8) |
where is the particle charge. The ratio of the collisionless ion drag force, Eq. (3), to the electric force, Eq (8), is then
| (9) |
where is the ion plasma frequency, is the ion mean free path with respect to collisions with neutrals. In deriving Eq. (9) it was assumed that screening is mostly associated with the ion component and, hence, . For the particle charge we used . Equation (9) is very similar to that derived earlier in Ref. Khrapak et al. (2002). It can now be improved by taking ion-neutral collisions into account. An obvious modification reads
| (10) |
The necessary condition of particle attraction to the sphere at long distances is in the limit of weak electric field. The electric field at which the ratio drops to unity will determine the cavity radius in this approximation.
III.2 Electric potential around sphere
At sufficiently long distances from the sphere, the electric potential distribution is dominated by ion absorption on the sphere surface. The ion flux conservation allows to obtain the electric potential in the weakly perturbed quasi-neutral region. For a large sphere () and collision-dominated ion flux to its surface () simple expressions for the potential and electric field are Raizer (2011)
| (11) |
where is the sphere radius.
III.3 Cavity radius
The radius of the cavity is found as follows. We approximate the effective collision frequency with
| (12) |
where for argon ions in argon gas ( is the neutral gas pressure expressed in Pa), and Khrapak (2013). The physics behind Eq. (12) is as follows. In a weak electric field, the ion drift velocity is directly proportional to the field, , and, thus, the effective collision frequency is constant . In a strong field, however, the drift velocity scales approximately as the square root of the field, . This implies . Equation (12) is constructed to reproduce these two limiting regimes and provides a reasonable interpolation between them using experimental information on drift velocities of Ar+ ions in argon gas (see Appendix A for a comparison). We substitute this in Eq. (10) and find the critical Mach number corresponding to the condition . Then using together with the long-range asymptote of the electric field (11) we finally obtain for the cavity radius
| (13) |
where we have used and . The procedure only applies to sufficiently slow drifts, , so that equation (5) for the ion drag force remains adequate.
A priori it is difficult to predict correctly the dependence of the cavity size on the neutral gas pressure. If, as one may expect intuitively, is nearly constant (about ), the cavity size should shrink with the increase of the pressure. We shall see, however, in a moment that the actual experimental tendency is opposite and is consistent with the numerical solution of the equations displayed above.
III.4 Numerical estimates
For the conditions relevant for the experiments on the injection of milimeter-size metallic spheres in PK-3 Plus facility we adopt the following plasma parameters, based on our previous simulations with the SIGLO-2D code Thomas et al. (2008); Khrapak et al. (2011, 2012). The central plasma density depends linearly on pressure and, to a reasonable accuracy, described by , where is in cm-3. The electron temperature decreases very weakly with pressure and in the range investigated we can take a fixed value eV. Ions and neutrals are at about room temperature, eV.
The force balance model developed is almost independent of the size of the microparticles forming the complex plasma. The only point where the dependence on the particle radius appears explicitly is when defining the non-linear shielding cloud radius . Furthermore, this dependence is extremely weak, . For this reason we take a fixed “average” radius m, providing a relevant “logarithmic” length scale for the mixture of particles present in the experimental chamber (diameter varies from to m Schwabe et al. (2017)).
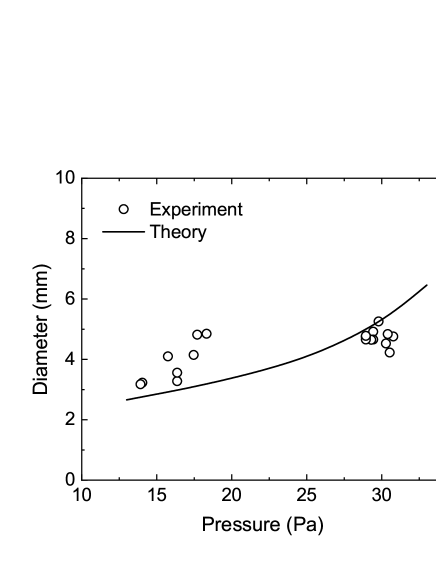
With the specified parameters, a numerical calculation is easy to perform. We have first verified that the necessary condition at is satisfied in the regime investigated. We then estimated and the cavity size as described in Sec. III.3. The resulting dependence of the cavity diameter on the neutral gas pressure is shown in Fig. 3. The agreement with experimental results is reasonable.
Note that on the low-pressure side, the cavity diameter can be underestimated, because the critical velocity from Eq. (10) exceeds (at Pa). This is where the model developed overestimates the ion drag force and hence pushes microparticles closer to the sphere. The actual cavity size can be larger than the theory predicts, as we indeed see in the experiment.
IV Discussion
The experimentally measured cavity size and its dependence on the neutral gas pressure have been demonstrated to be in good agreement with the theoretical approximation developed. It is appropriate to discuss several issues related to limitations and generalizations of the theoretical model.
The cavity size is predicted to be independent (or, at least, very weakly dependent) on the size of microparticles interacting with the big sphere. This is, however, true only when the non-linear model for the ion drag force is appropriate, that is for sufficiently large microparticles when the condition is satisfied.
According to the pressure range investigated experimentally, collisional regime for the ions has been considered. Generalization of the approach to the regime of collisionless ions is discussed in Appendix B.
In the force balance model we neglected the pressure force coming from interparticle repulsion in the complex plasma cloud, because it was previously estimated smaller than the electric and ion drag forces. The pressure force pushes microparticles towards the sphere and, if retained, it would result in somewhat smaller theoretical values for the cavity size.
The specifics of our approach is that we formulate the force balance condition for the weakly perturbed region sufficiently far from the sphere surface. In the original consideration of the force balance, a Yukawa potential around the sphere with the screening length given by the electron Debye radius was assumed inside the cavity Schwabe et al. (2017). In addition, the charge of the sphere was required. Our present approximation is considerably simpler in this respect, because the long-range asymptote of the electric field depends only on the electron temperature and sphere radius and is insensitive to other parameters, which are often not known.
The cavity size around a floating object is most sensitive to the electron-to-ion temperature ratio. Since in a typical gas discharge the ion temperature is normally close to the room temperature, while the electron temperature can vary in a relatively wide range, the observation of cavities can potentially be used as a diagnostic tool for the electron temperature.
It should be noted again that the cavity formation is not the only observation from the original experiment. Further interesting phenomena included the formation of bubbles, repulsive attraction (characterization of the long-range ion-drag-mediated attraction of microparticles to the sphere), and wave excitation. These are described in detail in the original paper Schwabe et al. (2017).
V Conclusion
Interactions between millimeter size floating spheres and a complex plasma have been studied in the PK-3 Plus laboratory onboard ISS. One of the manifestations of these interactions represents the formation of cavities (regions free of microparticles) around the spheres. The cavity size is dictated by the balance of forces acting on the particles at the cavity edge, most important forces being the electric repulsion at short distances and the ion-drag-mediated attraction at long distances. In this article we have proposed a simple practical approach to estimate the ion drag force for experimentally relevant conditions (with the main point to account simultaneously for non-linear ion-particle ineractions and ion-neutral collisions). This has resulted in a simple theoretical approximation for the force balance condition and allowed us to estimate the size of the cavity and its dependence on plasma parameters. The results of theoretical calculation have been demonstrated to agree well with the experimental results. In addition, generalization of the model for the regime of collisionless ions has been made (see below in the Appendix). The theoretical approach reported can be useful in situations when large objects interact with complex plasmas.
Acknowledgements.
We thank Mierk Schwabe and Erich Zähringer for careful reading of the manuscript. The microgravity research is funded by the space agency of the Deutsches Zentrum für Luft- und Raumfahrt e.V. (DLR) with funds from the federal ministry for economy and technology according to a resolution of the Deutscher Bundestag under grant No. 50WP0203 and 50WM1203. Support from ROSCOSMOS of the PK-3 Plus project is also acknowledged.Appendix A Mobility of Ar+ ions in Ar gas
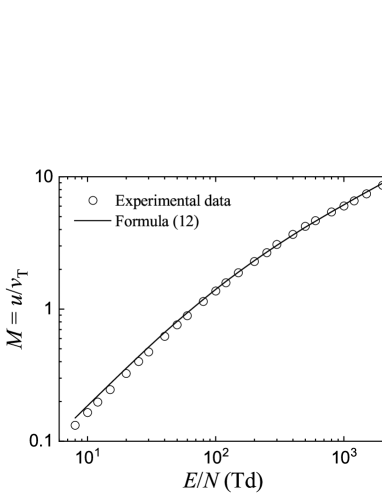
Figure 4 shows the comparison between experimental data on Ar+ ion mobility in Ar gas Ellis et al. (1976) and the approximation of Eqs. (7) and (12). For subthermal () drifts the theoretical approximation slightly overestimate the experimental mobility. For nearly-thermal and superthermal drifts the theory and experiment agree well. There is clearly some room for improvements, but for the present purposes the accuracy of Eq. (12) is quite sufficient.
Appendix B Cavity size in the collisionless regime
Let us consider a hypothetical situation of a floating sphere in the collisionless regime for the ion component. This corresponds to the regime , which can be realized at very low pressures. This situation can also be of some relevance and interest in the context of astrophysical plasmas. In this case the long-range asymptote of the electrostatic potential around a sphere is again dictated by the ion absorption on the sphere surface. Quite generally, the potential can be estimated from
| (14) |
where is the flux of ions on the sphere surface and is their influx into the spherical surface of radius Chaudhuri et al. (2011). (This consideration works also in the collisional case, but in that case we made use of already existing expressions for the potential and electric field Raizer (2011)). In the case of thin collisionless sheath around a large sphere we have
| (15) |
where is the plasma density at the sheath edge and is the ion sound velocity. In the weakly perturbed region sufficiently far from the sphere the influx is simply
| (16) |
This yields
| (17) |
In the case of a smaller object (e.g. microparticle), the orbital motion theory (OML) Fortov et al. (2005); Allen (1992); Kennedy and Allen (2003) can be applied to give
| (18) |
and in this regime
| (19) |
The well known long-range asymptote is reproduced Al’pert, Gurevich, and Pitaevskii (1965). We identify the main difference from the collisional regime: The potential drops faster as instead of decay Khrapak, Klumov, and Morfill (2008). The location of the boundary can be estimated from the condition , because in the collisionless regime the ratio decreases very quickly with . The energy conservation then simply yields
| (20) |
Combining (17) and (20) we finally get for the collisionless regime
| (21) |
This describes the cavity size in the collisionless limit. For we arrive at . This is not very far from the present experimental results on the low-pressure side, see Fig. 3.
References
- Goertz (1989) C. K. Goertz, Rev. Geophys. 27, 271 (1989).
- Shukla (2002) P. K. Shukla, Dust Plasma Interaction in Space (Nova Science Pub Inc, 2002).
- Bouchoule (1999) A. Bouchoule, Dusty Plasmas: Physics, Chemistry, and Technological Impact in Plasma Processing (Wiley, 1999).
- Kong et al. (2009) M. G. Kong, G. Kroesen, G. Morfill, T. Nosenko, T. Shimizu, J. van Dijk, and J. L. Zimmermann, New J. Phys. 11, 115012 (2009).
- Fortov et al. (2004) V. E. Fortov, A. G. Khrapak, S. A. Khrapak, V. I. Molotkov, and O. F. Petrov, Phys.-Usp. 47, 447 (2004).
- Fortov et al. (2005) V. E. Fortov, A. Ivlev, S. Khrapak, A. Khrapak, and G. Morfill, Phys. Rep. 421, 1 (2005).
- Morfill and Ivlev (2009) G. E. Morfill and A. V. Ivlev, Rev. Mod. Phys. 81, 1353 (2009).
- Winter (1998) J. Winter, Plasma Phys. and Control. Fusion 40, 1201 (1998).
- Thomas et al. (2018) H. M. Thomas, M. Schwabe, M. Y. Pustylnik, C. A. Knapek, V. I. Molotkov, A. M. Lipaev, O. F. Petrov, V. E. Fortov, and S. A. Khrapak, Plasma Phys. Control. Fusion 61, 014004 (2018).
- Schwabe et al. (2017) M. Schwabe, S. Zhdanov, T. Hagl, P. Huber, A. M. Lipaev, V. I. Molotkov, V. N. Naumkin, M. Rubin-Zuzic, P. V. Vinogradov, E. Zaehringer, V. E. Fortov, and H. M. Thomas, New J. Phys. 19, 103019 (2017).
- Law et al. (1998) D. A. Law, W. H. Steel, B. M. Annaratone, and J. E. Allen, Phys. Rev. Lett. 80, 4189 (1998).
- Thompson, D’Angelo, and Merlino (1999) C. O. Thompson, N. D’Angelo, and R. L. Merlino, Phys. Plasmas 6, 1421 (1999).
- Samsonov et al. (2001) D. Samsonov, A. V. Ivlev, G. E. Morfill, and J. Goree, Phys. Rev. E 63, 025401 (2001).
- Thomas, Avinash, and Merlino (2004) E. Thomas, K. Avinash, and R. L. Merlino, Phys. Plasmas 11, 1770 (2004).
- Klindworth et al. (2004) M. Klindworth, A. Piel, A. Melzer, U. Konopka, H. Rothermel, K. Tarantik, and G. E. Morfill, Phys. Rev. Lett. 93, 195002 (2004).
- Harris, Matthews, and Hyde (2015) B. J. Harris, L. S. Matthews, and T. W. Hyde, Phys. Rev. E 91, 063105 (2015).
- Usachev et al. (2009) A. D. Usachev, A. V. Zobnin, O. F. Petrov, V. E. Fortov, B. M. Annaratone, M. H. Thoma, H. Höfner, M. Kretschmer, M. Fink, and G. E. Morfill, Phys. Rev. Lett. 102, 045001 (2009).
- Thomas et al. (2008) H. M. Thomas, G. E. Morfill, V. E. Fortov, A. V. Ivlev, V. I. Molotkov, A. M. Lipaev, T. Hagl, H. Rothermel, S. A. Khrapak, R. K. Suetterlin, M. Rubin-Zuzic, O. F. Petrov, V. I. Tokarev, and S. K. Krikalev, New J. Phys. 10, 033036 (2008).
- Khrapak et al. (2016) A. G. Khrapak, V. I. Molotkov, A. M. Lipaev, D. I. Zhukhovitskii, V. N. Naumkin, V. E. Fortov, O. F. Petrov, H. M. Thomas, S. A. Khrapak, P. Huber, A. Ivlev, and G. Morfill, Contrib. Plasma Phys. 56, 253 (2016).
- Goree et al. (1999) J. Goree, G. E. Morfill, V. N. Tsytovich, and S. V. Vladimirov, Phys. Rev. E 59, 7055 (1999).
- Gozadinos, Ivlev, and Boeuf (2003) G. Gozadinos, A. V. Ivlev, and J. P. Boeuf, New J. Phys. 5, 32 (2003).
- Kretschmer et al. (2005) M. Kretschmer, S. A. Khrapak, S. K. Zhdanov, H. M. Thomas, G. E. Morfill, V. E. Fortov, A. M. Lipaev, V. I. Molotkov, A. I. Ivanov, and M. V. Turin, Phys. Rev. E 71, 056401 (2005).
- Lipaev et al. (2007) A. M. Lipaev, S. A. Khrapak, V. I. Molotkov, G. E. Morfill, V. E. Fortov, A. V. Ivlev, H. M. Thomas, A. G. Khrapak, V. N. Naumkin, A. I. Ivanov, S. E. Tretschev, and G. I. Padalka, Phys. Rev. Lett. 98, 265006 (2007).
- Goedheer and Land (2008) W. J. Goedheer and V. Land, Plasma Phys. Control. Fusion 50, 124022 (2008).
- Chaudhuri et al. (2011) M. Chaudhuri, A. V. Ivlev, S. A. Khrapak, H. M. Thomas, and G. E. Morfill, Soft Matter 7, 1287 (2011).
- Wysocki et al. (2010) A. Wysocki, C. Räth, A. V. Ivlev, K. R. Sütterlin, H. M. Thomas, S. Khrapak, S. Zhdanov, V. E. Fortov, A. M. Lipaev, V. I. Molotkov, O. F. Petrov, H. Löwen, and G. E. Morfill, Phys. Rev. Lett. 105, 045001 (2010).
- Sütterlin et al. (2010) K. R. Sütterlin, A. Wysocki, C. Räth, A. V. Ivlev, H. M. Thomas, S. Khrapak, S. Zhdanov, M. Rubin-Zuzic, W. J. Goedheer, V. E. Fortov, A. M. Lipaev, V. I. Molotkov, O. F. Petrov, G. E. Morfill, and H. Löwen, Plasma Phys. Control. Fusion 52, 124042 (2010).
- Khrapak et al. (2011) S. A. Khrapak, B. A. Klumov, P. Huber, V. I. Molotkov, A. M. Lipaev, V. N. Naumkin, H. M. Thomas, A. V. Ivlev, G. E. Morfill, O. F. Petrov, V. E. Fortov, Y. Malentschenko, and S. Volkov, Phys. Rev. Lett. 106, 205001 (2011).
- Khrapak et al. (2012) S. A. Khrapak, B. A. Klumov, P. Huber, V. I. Molotkov, A. M. Lipaev, V. N. Naumkin, A. V. Ivlev, H. M. Thomas, M. Schwabe, G. E. Morfill, O. F. Petrov, V. E. Fortov, Y. Malentschenko, and S. Volkov, Phys. Rev. E 85, 066407 (2012).
- Du et al. (2012) C.-R. Du, K. R. Sütterlin, K. Jiang, C. Räth, A. V. Ivlev, S. Khrapak, M. Schwabe, H. M. Thomas, V. E. Fortov, A. M. Lipaev, V. I. Molotkov, O. F. Petrov, Y. Malentschenko, F. Yurtschichin, Y. Lonchakov, and G. E. Morfill, New J. Phys. 14, 073058 (2012).
- Schwabe et al. (2008) M. Schwabe, S. K. Zhdanov, H. M. Thomas, A. V. Ivlev, M. Rubin-Zuzic, G. E. Morfill, V. I. Molotkov, A. M. Lipaev, V. E. Fortov, and T. Reiter, New J. Phys. 10, 033037 (2008).
- Schwabe, Zhdanov, and Räth (2017) M. Schwabe, S. Zhdanov, and C. Räth, Phys. Rev. E 95, 041201 (2017).
- Heidemann et al. (2011) R. J. Heidemann, L. Couëdel, S. K. Zhdanov, K. R. Sütterlin, M. Schwabe, H. M. Thomas, A. V. Ivlev, T. Hagl, G. E. Morfill, V. E. Fortov, V. I. Molotkov, O. F. Petrov, A. I. Lipaev, V. Tokarev, T. Reiter, and P. Vinogradov, Phys. Plasmas 18, 053701 (2011).
- Schwabe et al. (2011) M. Schwabe, K. Jiang, S. Zhdanov, T. Hagl, P. Huber, A. V. Ivlev, A. M. Lipaev, V. I. Molotkov, V. N. Naumkin, K. R. Sütterlin, H. M. Thomas, V. E. Fortov, G. E. Morfill, A. Skvortsov, and S. Volkov, EPL (Europhys. Lett.) 96, 55001 (2011).
- Zhukhovitskii et al. (2015) D. I. Zhukhovitskii, V. E. Fortov, V. I. Molotkov, A. M. Lipaev, V. N. Naumkin, H. M. Thomas, A. V. Ivlev, M. Schwabe, and G. E. Morfill, Phys. Plasmas 22, 023701 (2015).
- Arp, Caliebe, and Piel (2011) O. Arp, D. Caliebe, and A. Piel, Phys. Rev. E 83, 066404 (2011).
- Caliebe, Arp, and Piel (2011) D. Caliebe, O. Arp, and A. Piel, Phys. Plasmas 18, 073702 (2011).
- Yaroshenko, Khrapak, and Morfill (2013) V. V. Yaroshenko, S. A. Khrapak, and G. E. Morfill, Phys. Plasmas 20, 043703 (2013).
- Khrapak et al. (2005) S. A. Khrapak, A. V. Ivlev, S. K. Zhdanov, and G. E. Morfill, Phys. Plasmas 12, 042308 (2005).
- Khrapak et al. (2002) S. A. Khrapak, A. V. Ivlev, G. E. Morfill, and H. M. Thomas, Phys. Rev. E 66, 046414 (2002).
- Khrapak et al. (2003) S. A. Khrapak, A. V. Ivlev, G. E. Morfill, and S. K. Zhdanov, Phys. Rev. Lett. 90, 225002 (2003).
- Khrapak et al. (2004) S. Khrapak, A. Ivlev, G. Morfill, S. Zhdanov, and H. Thomas, IEEE Trans. Plasma Sci. 32, 555 (2004).
- Khrapak (2014) S. A. Khrapak, Phys. Plasmas 21, 044506 (2014).
- Semenov, Khrapak, and Thomas (2017) I. L. Semenov, S. A. Khrapak, and H. M. Thomas, Phys. Plasmas 24, 033710 (2017).
- Khrapak and Morfill (2009) S. Khrapak and G. Morfill, Contrib. Plasma Phys. 49, 148 (2009).
- Ivlev et al. (2004a) A. V. Ivlev, S. A. Khrapak, S. K. Zhdanov, G. E. Morfill, and G. Joyce, Phys. Rev. Lett. 92, 205007 (2004a).
- Ivlev et al. (2004b) A. V. Ivlev, S. K. Zhdanov, S. A. Khrapak, and G. E. Morfill, Plasma Phys. Control. Fusion 46, B267 (2004b).
- Ivlev et al. (2005) A. V. Ivlev, S. K. Zhdanov, S. A. Khrapak, and G. E. Morfill, Phys. Rev. E 71, 016405 (2005).
- Khrapak et al. (2007) S. A. Khrapak, S. K. Zhdanov, A. V. Ivlev, and G. E. Morfill, J. Appl. Phys. 101, 033307 (2007).
- Hutchinson and Haakonsen (2013) I. H. Hutchinson and C. B. Haakonsen, Phys. Plasmas 20, 083701 (2013).
- Filippov, Zagorodny, and Momot (2008) A. V. Filippov, A. G. Zagorodny, and A. I. Momot, JETP Letters 88, 24 (2008).
- Vladimirov et al. (2008) S. V. Vladimirov, S. A. Khrapak, M. Chaudhuri, and G. E. Morfill, Phys. Rev. Lett. 100, 055002 (2008).
- Semenov, Zagorodny, and Krivtsun (2013) I. L. Semenov, A. G. Zagorodny, and I. V. Krivtsun, Phys. Plasmas 20, 013701 (2013).
- Momot (2017) A. I. Momot, Phys. Plasmas 24, 103704 (2017).
- Frost (1957) L. S. Frost, Phys. Rev. 105, 354 (1957).
- Khrapak (2013) S. A. Khrapak, J. Plasma Phys. 79, 1123 (2013).
- Raizer (2011) Y. P. Raizer, Gas Discharge Physics (Springer, 2011).
- Ellis et al. (1976) H. Ellis, R. Pai, E. McDaniel, E. Mason, and L. Viehland, Atomic Data and Nuclear Data Tables 17, 177 (1976).
- Allen (1992) J. E. Allen, Phys. Scripta 45, 497 (1992).
- Kennedy and Allen (2003) R. V. Kennedy and J. E. Allen, J. Plasma Phys. 69, 485 (2003).
- Al’pert, Gurevich, and Pitaevskii (1965) Y. L. Al’pert, A. Gurevich, and L. Pitaevskii, Space Physics with Artificial Satellites (Consultant Bureau, 1965).
- Khrapak, Klumov, and Morfill (2008) S. A. Khrapak, B. A. Klumov, and G. E. Morfill, Phys. Rev. Lett. 100, 225003 (2008).