Epidemics on Networks: Reducing Disease Transmission Using Health Emergency Declarations and Peer Communication
Abstract
Understanding individual decisions in a world where communications and information move instantly via cell phones and the internet, contributes to the development and implementation of policies aimed at stopping or ameliorating the spread of diseases. In this manuscript, the role of official social network perturbations generated by public health officials to slow down or stop a disease outbreak are studied over distinct classes of static social networks. The dynamics are stochastic in nature with individuals (nodes) being assigned fixed levels of education or wealth. Nodes may change their epidemiological status from susceptible, to infected and to recovered. Most importantly, it is assumed that when the prevalence reaches a pre-determined threshold level, , information, called awareness in our framework, starts to spread, a process triggered by public health authorities. Information is assumed to spread over the same static network and whether or not one becomes a temporary informer, is a function of his/her level of education or wealth and epidemiological status. Stochastic simulations show that threshold selection and the value of the average basic reproduction number impact the final epidemic size differentially. For the Erdős-Rényi and Small-world networks, an optimal choice for that minimize the final epidemic size can be identified under some conditions while for Scale-free networks this is not case.
Keywords: Awareness spread, Behavior change, Outbreak and epidemic threats, Erdős-Rényi network, Small-world Network, Scale-free Network,
School of Human Evolution and Social Change; Simon A. Levin Mathematical Computational Modeling Science Center, Arizona State University, Tempe, AZ 85281
Division of Applied Mathematics, Brown University, Providence RI, 02906
Sciences and Mathematics Faculty, College of Integrative Sciences and Arts, Arizona State University, Mesa, AZ 85212, USA
1 Introduction
The decisions that individuals make over an epidemic outbreak depend on multiple factors. Here, they are assumed to depend on available information, misinformation, and the income/education of those making them [9, 15, 5, 36, 30]. There are multiple possible scenarios that consider the decisions that individuals may make over the course of an outbreak. Individuals may modify their behaviors in order to reduce their environmental susceptibility to a disease by washing their hands frequently, avoiding handshakes and avoiding kissing salutes, not taking public transportation during rush hours, using masks and more. The frequency and effectiveness of these decisions may depend on the perceived risk of infection, a function of what each individual “knows”. In short, individual responses to new circumstances are adaptive and may depend on real or perceive risks of infection. Current disease prevalence, may become a marker or a tipping point, that when crossed, triggers individual or policy decisions. Whether or not individuals follow public health officials’ recommendations may be a function of individuals’ economic/educational status. The determination to make a drastic decision may be weakened or reinforced by each individual’s networks of friends. Responses are altered by the opinions of work-related connections. Personal needs play a role, and they include the need to use public transportation or the desire to attend a social event.
The landscape where behavioral decisions take place is not fixed. On the contrary, it may be altered from within (individual decisions) or by the use of preventive or active public health policy decisions or recommendations, some “obvious” like vaccination or quarantine, others drastic like mandated social distancing, as in the 2009-10 flu pandemic in Mexico [14]. Now, whether the dynamical changes experienced by the socio-epidemiological landscape are slow or fast, will depend on many factors. It is within this, often altered, complex adaptive dynamical system, that individual decisions such as individually-driven social distancing, the use of face masks, frequent hand washing, increased condom use, and or the routine use of non-pharmaceutical interventions (NPIs), takes place [39]. It has been theoretically documented [11, 29, 12, 16, 23, 37] that massive behavioral changes can impact the patterns of infection spread, possibly playing a critical role in efforts to prevent or ameliorate disease transmission. Today policies are implemented regardless of our knowledge of who are the “drivers” responsible for inducing behavioral changes. Modeling frameworks exist that allow for the systematic exploration of possible scenarios. Through a systematic exploratory analyses of appropriately selected classes of scenarios, it is possible to identify possibly effective (model-evaluated) public health policies. The use of highly detailed models including individual-based models has some advantages since they can incorporate individuals’ awareness of risk based on available of local information. The evaluations carried out on the effectiveness of changes, at the individual level, can be used to assess, for example, the impact of NPIs in reducing disease prevalence.
Models that couple disease dynamics and awareness to levels of infection risk have been proposed. These models have been used to explore the impact of behavioral changes on the spread of infection. In the review paper of Wang et al. [39] classify models as Rule-Based Models (RBMs), those where individuals make their decision about changing behavior independently of others, and Economic-Epidemiology models (EE models), that is, models where individuals change their behavior in order to maximize their own utility function (what they value) subject to available resources. The EE models account for the responses that individuals take in response to infection risks on disease prevalence at the population level. The modeling and results reported in this manuscript are more closely related to those used in RBMs.
Ruled-Based Models [16, 7, 34, 29, 18, 23, 31, 32, 33] vary from compartmental ODE models [16, 23, 37] to individual-based network models [41, 11, 13, 22]. These models have been used to study the dynamics of highly diverse diseases including, for example, influenza and HIV [31, 10], or in the study of generic infections [29, 18, 23, 33, 32]. Compartmental models (often using a phenomenological approach) categories designed to capture levels of awareness of infection. Such approach that can be used to incorporate ‘awareness’ in network models, is the objective of this manuscript. Some models assume that “awareness” spreads along with the invading disease, that is, through identical contact networks. Here, it is assumed that the disease and information spread over the same social network (a drastic simplification). The possibility that awareness and responses to the presence of a new infection among a subset of the population at risk, may significantly alter regular temporal patterns of disease prevalence (lower highs) have been studied. Studies have also shown that epidemic thresholds can be altered [34, 33] [29] in response to the effectiveness of NPI. Here, the focus is on the role of policy decisions/recommendations in altering disease dynamics, possibly the final epidemic size, within a model where awareness (generated by official actions) spreads among those susceptible to infection and their ‘friends’.
In this paper, we explore the impact of various, prevalence-dependent pre-selected thresholds (decisions made by public health officials) as triggers of possibly temporarily behavioral change. The time to a triggering event is assumed to depend on the prevalence of infection– a decision taken by health authorities (declaring some level of health emergency). We carry out simulations to explore the impact of variations on triggering prevalence-driven levels on the final epidemic size of a non-fatal infection under three distinct fixed artificial social structures modeled as, Erdos-Raynei, Small-world, and Scale-free networks.
2 Modeling Framework
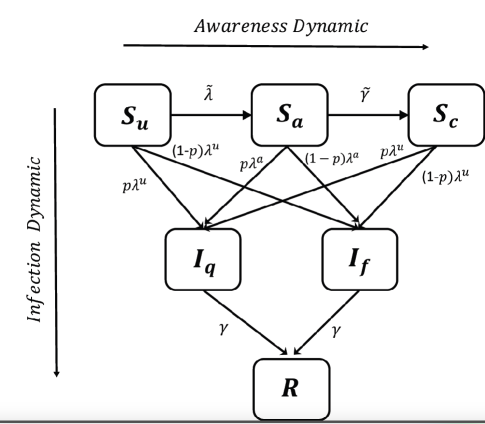
The model captures changing disease transmission dynamics by incorporating, after a health emergency has been declared. The spread of risk information, that play by assumption over the same social network. Risk information is transmitted at different rates depending on the economic/education levels of individuals. We focus on single outbreaks, within a Susceptible–Infected–Recovered (SIR) framework. The dissemination of awareness (risk information) among the susceptible population, a process triggered by the declaration of a health emergency by the public health authorities, generates temporary changes on the knowledge and understanding of risk of infection, thus altering their activity and effectiveness as communicators of risk. Becoming aware of the risk of infection and inciting our ability to communicate risk, takes place at a rate modeled as a function of the economic/educational level of individuals in the network. Economic/educational levels are preassigned qualities to individuals in the network from pre-selected distributions. A susceptible individual may be a member of three sub-classes of susceptible: Unaware, , Aware, and Indifferent, . Unaware individuals that become aware of the risk of infection may (depending on their economic/educational level), change their state to Aware, that is, be ready to convey information, with different levels of enthusiasm, on the risks of the infection to neighbors in the network. Aware, is assumed to be a temporary state and so a transition to the Indifferent state is included. The triggers that determine or drive awareness state are a function of the disease prevalence level and not the time since start of the outbreak. The case when delays in transmitting real-time prevalence information to public health officials takes place, the most likely scenario is not considered. However, we know that it brings additional consequences (see [38]).
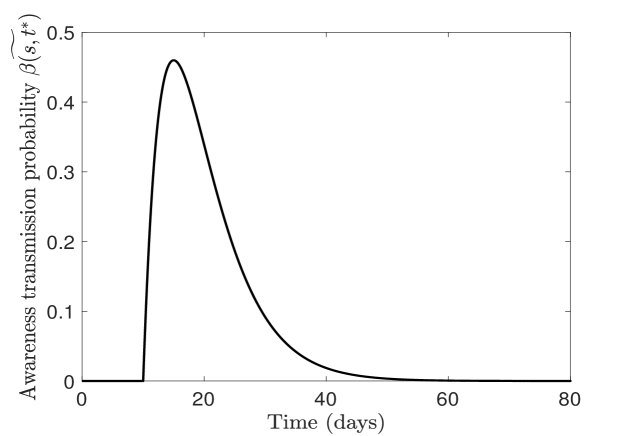
The activation process of public awareness takes place within a time framework determined by the actual (reported in general) disease prevalence and so, it is a function of the epidemic outbreak growth rate. We let denote the pre-selected level of prevalence identified by public health officials as the triggering threshold after which, a public awareness process campaign is initiated via mass media, word of mouth, social media and the like. The timing is selected when, according to public health officials. A disease outbreak may be about to reach unacceptable levels, with , being the pre-selected tolerance level before a health emergency is declared. The determines the time when the information campaign starts (see Figure 1). The identifies the public health system threshold that forces public health action aimed at reducing outbreak consequences. The actual changes in behavior are determined by an stochastic process, and so, the shift in behaviors, is a function of “chance”.
Before , the dynamics are governed only by the disease transmission process. At the time , the model activates information process that models to behavioral change that reduce disease transmission. Therefore, denotes the time when prevalence reaches for the first time, Figure(1).

Sub-section 2.1 introduces the details of our network model, starting with the network structure and node attributes that are used to represent individuals in the network.
2.1 Network Structure
The network is denoted by which includes a set of nodes representing individuals together with a binary adjacency relation defined by the set of edges , where ij denotes the edge between individual (node) i and individual (node) j.
We make use of three network structures, namely, Erdős-Rényi , Small-world, and Scale-free networks -defined in the Appendix- as models of our social landscape, the place where infection and awareness spread and behavioral change take place.
After generating the network [8, 26, 3], we assign some attributes to the nodes (individuals) as follows: each node
i is associated with a random variable , generated from a beta-distribution, denoting the level of education of individual i, values closer to corresponding to higher levels of education while those close to indicate limited education, an individual i is assigned a random number from a beta distribution with shape parameters and .
The underlying network G is weighted, where the weight for edge ij is the probability, of physical contact between neighbors i and j on any specific day. We assume that the values are randomly generated from a uniform distribution . For example if , that means that these two neighbors meet with probability and do not meet with probability on a specific day. We also assume that there are no birth or deaths in the population of nodes or edges, during the epidemic outbreak.
2.2 Dynamic of awareness among susceptible individuals
At any given time , a person k is classified as susceptible, , infected, , or recovered, , to the disease under consideration.
Disease risk awareness among susceptible individuals spreads after public health officials make the deliberate decision to stress vigorously the risk of infection, as it may be the case under an influenza epidemic or other health emergency. The model assumes that the decision to promote risk prevention starts once a pre-determined prevalence level , at time , has been reached.
Health authorities start to spread information about a pathogen’s outbreak, information that gets communicated by those individuals, actively aware, in the network, with different degrees of efficiency. The spread of information is a function of chance (probability model) and economical/educational level. The state of active information-communicator is assumed to be temporary, with individuals moving into a“passive” state, indifferent, after a short period of time. Before time every susceptible individual is unaware of the information campaigns but for times , members of may change status from unaware () to aware (), then moving, with some probability, into the indifferent class ().
We define as the probability that informs at time , and causes . Thorough the probability -generated from an exponential distribution with parameter , the average awareness period is therefore days. The members of leave the awareness class into indifferent class, that is, , with probability , after spending, on the average days in the aware class; the mean of waiting time distribution for the class .
2.2.1 Awareness transmission probability
denotes the probability that an aware person will inform an unaware neighbor at time via their contact: . The value denotes the probability of contact between neighbors j and k, with denoting the average probability that risk information will pass from an aware individual to an unaware neighbor. is the average of a first increasing and then decaying and waning function over the awareness period, that is, , where is the first day that a person becomes aware. is a function of , because before this time the person was unaware and therefore, incapable of spreading risk information. Figure (2) helps visualize the probability function for , a function acting on initially aware individual, that is, individuals who became aware on the first day of awareness spread . After days, information enters the system, people learn that an epidemic is taking place and the risk and severity of infection. The higher the value of the less effective the campaign in reducing the impact of information on the outbreak.
3 Simulations
In this Section, we perform our analysis and simulations on three different networks: Erdős-Rényi random network , Small-world network , and Scale-free network . These networks are defined in the appendix. To generate the networks, we use Networkx111We use the NetworkX124 https://networkx.github.io/ open software platform to generate and analyze the network. and Erdős-Rényi -graph algorithm to generate with probability of connection . Using the same package, the Watts-Strogatz algorithm is used to generate Small-world network with probability of rewiring . We also use Barabasi–Albert’s preferential attachment model in Networkx to generate a Scale-free network with degree distribution [2]. The size of all networks is 10000 and the average number of neighbors for all networks is equal to 10. However, the networks differ in terms of degree distributions and other properties due to their different structures. Simulations start by infecting the most connected node (index case) to reach a balanced initial condition [1]. They are came out with the model baseline parameters in Table (1), unless stated otherwise.
| Parameter | Description | Unit | Baseline | |
| Network Parameters | N | Number of nodes in the Network | People | |
| GE | Erdős-Rényi random network | – | ||
| GW | Small-world network | – | ||
| GS | Scale-free random network | – | ||
| Average number of contact per neighbor per unit time | contact/time | |||
| Level of education distribution (its mean) | – | |||
| Infection Parameters | Probability of infection transmission per contact | 1/contact | ||
| Average time to recover without treatment | days | |||
| Awareness Parameters | Average probability of awareness transmission per contact | 1/contact | ||
| Prevalence threshold | 1 | |||
| Average time of behavior change for susceptible individuals | days | |||
| Saturation factor in function | 1 | |||
| Parameter in which, half maximum function is obtained | 1 | |||
| Level of education threshold | 1 |
3.1 Time series of infection
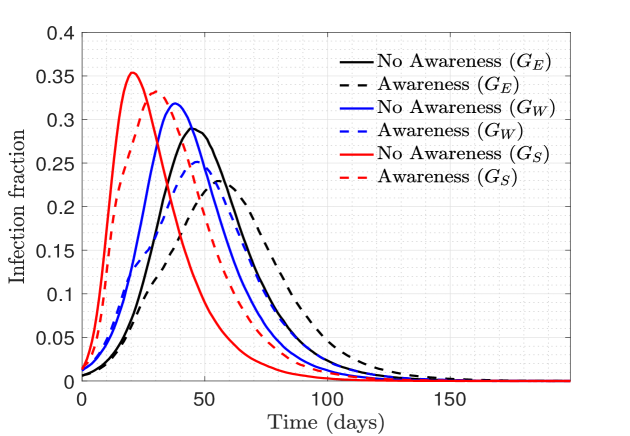
To determine the effectiveness of awareness spread, we compare the prevalence over time in the absence and presence of awareness. Figure (4) shows the results for network structures , , and . We observe that all networks, with or without awareness, support an outbreak for the chosen parameters (that is, the probability of extinction is low or the results are conditioned on non-extinction). Due to a lack of epidemic threshold for Scale-free network [25, 4, 21], we always observe an outbreak with severity that depends on the initial infected index. For the other network structures, we observe an epidemic threshold depends on the network topology; specifically, on the average number of neighbors and the levels of heterogeneity in the number of neighbors (mean and variance of degree distribution) [19]. For example, for the case of Small-world networks Moore et al. [24] derived an analytic expression for the percolation threshold , above which there will be an outbreak. For the case when the network is homogeneous (Erdős-Rényi network), the epidemic threshold is proportional to the average number of neighbors (average degree) [27]. Hence, for our simulation for both networks and we approximated the basic reproduction number using epidemic take-offs, when we had an outbreak, that is, whenever ( probability of extinction for the parameters used seemed to be negligible).
The spread of infection on Scale-free network is faster than for the other two network topologies. Moreno et al. [25] , modeled infection with immunity on Scale-free and Small-world networks, they observed that the spread of infection on Scale-free complex networks is faster than that of Small-world networks due to a lack of epidemic threshold for network ; large connectivity fluctuations (heterogeneity in degree) on this network causes stronger outbreak incidence [25]. Our result is also related to [4], in which Chowell et al. tested the severity of an outbreak using an SIR model over a family of Small-world networks and an Scale-free network found out that the worst case scenarios (highest infection rate) are observed in the most heterogeneous network, namely, Scale-free networks.
The speed for infection has an impact on efficiency of awareness spread: for Scale-free network awareness reduces the peak of infection by roughly , but for and this reduction is around . Since in network infection spreads faster, hubs (individuals with many neighbors) get infected faster and loosing the chance of transmitting or receiving awareness. Wu et al. [41] showed a similar result: global awareness (behavior change because of higher prevalence in the population) on Scale-free networks cannot be as effective as local awareness in reducing infection.
3.2 Initiation of awareness
The presence and spread of awareness are coupled to the presence of infection, with awareness spreading, by design, after the infection reaches the level . Therefore, there is a time-lag between starting time of infection and awareness spread. What should the value of be, if the goal is to reduce the final epidemic size? When the infection disperses fast- high basic reproduction number- people must be informed immediately, or the policy will have no effect. As noted, there is no threshold condition for network. We did not derive expressions for epidemic thresholds. Instead, we used epidemic take-offs to estimate the basic reproduction number as and , numbers corresponding to and , respectively. Numbers that are not too high- such as that of the for measles [17]- we are giving awareness a chance to be effective, since an epidemic with low will reach the value much slower.
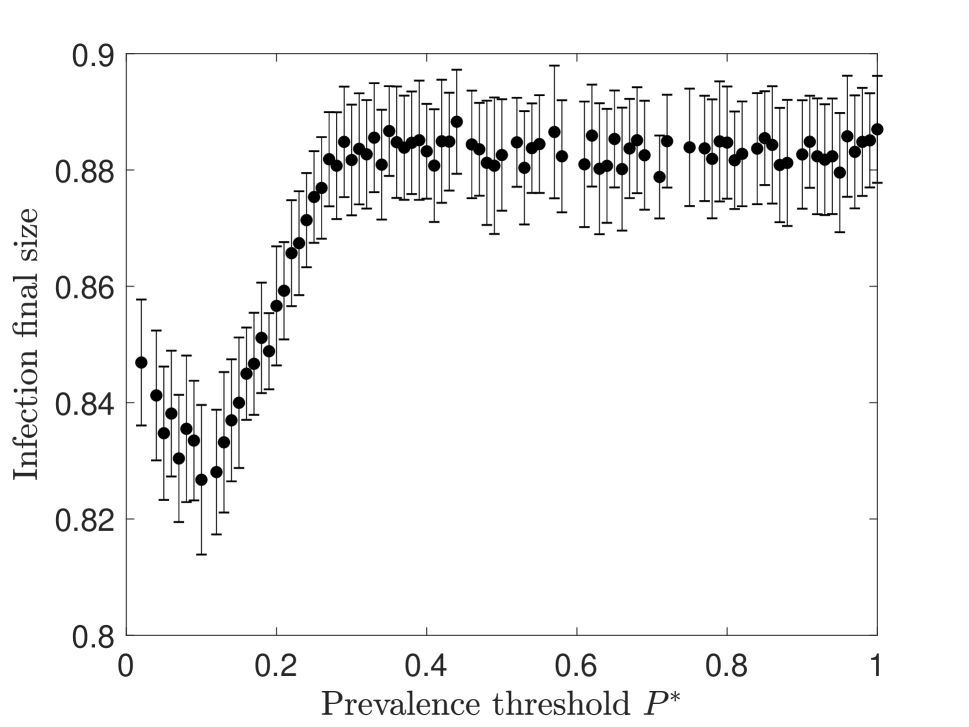
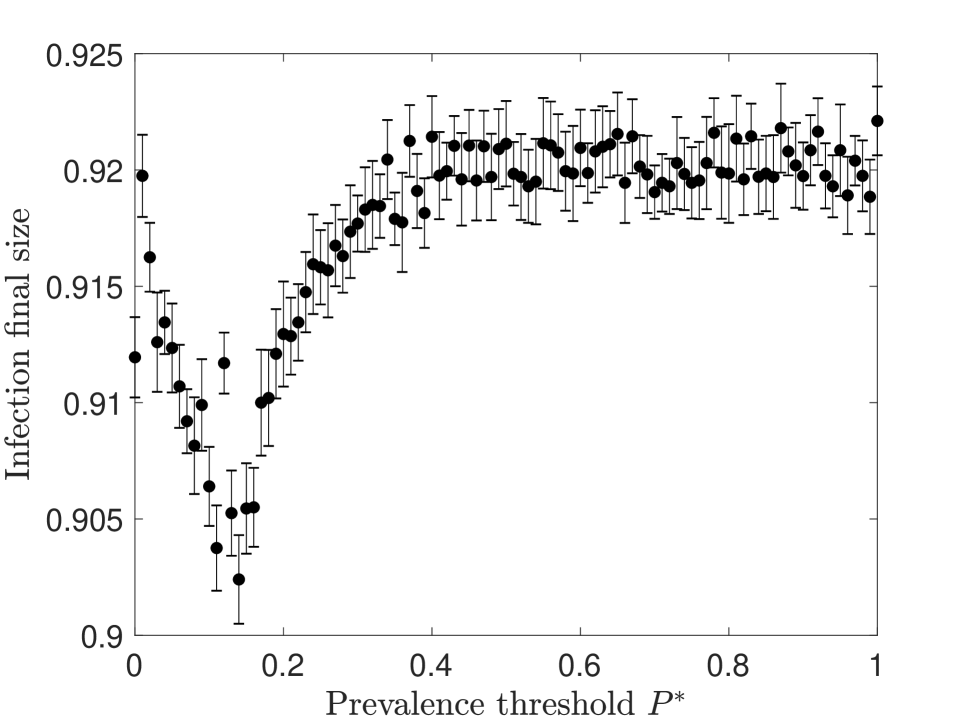
Proceed to quantify the sensitivity of the final size of the outbreak as a function of the prevalence threshold over the network structures GE, GW, and GS, Figure (5), for the simulated GE network that representing homogeneous random mixing and for the simulated GW network, we identify an optimal point for (the point that final size is minimized), that means awareness spread is most effective in reducing final size for these values of . For larger values of , the awareness policy is useless while for smaller values of is less effective, see subfigures (5(a)), and (5(b)).
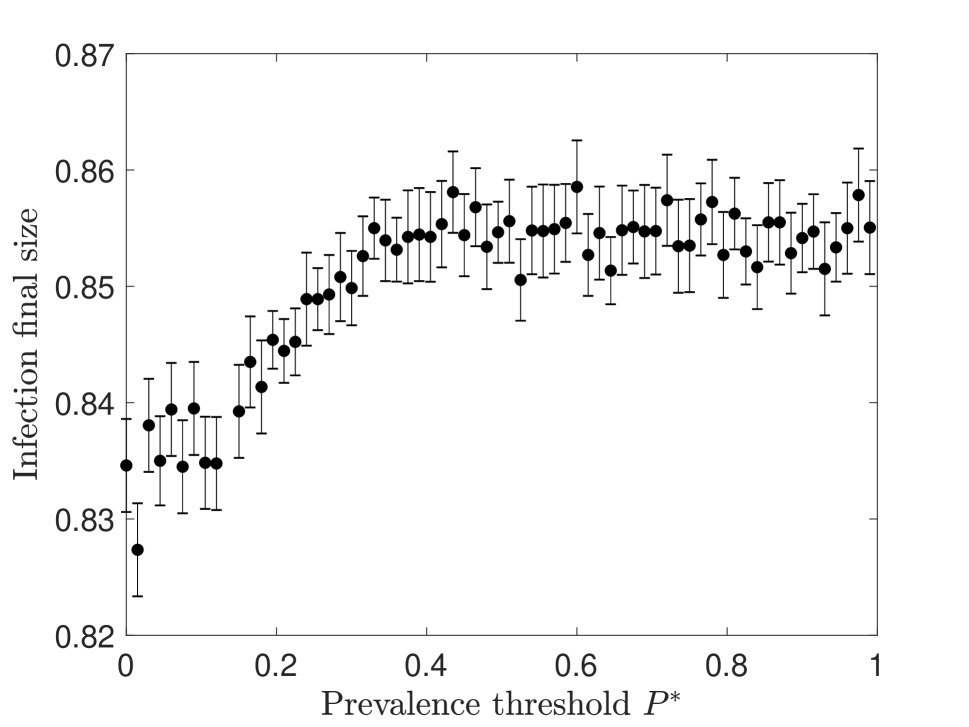
For the simulated networks - in which network structure follows a power-law distribution - we observed that the sooner awareness gets started, the smaller the total number of infected individuals will be, see subfigures (5(c)) (see also [25, 4]).
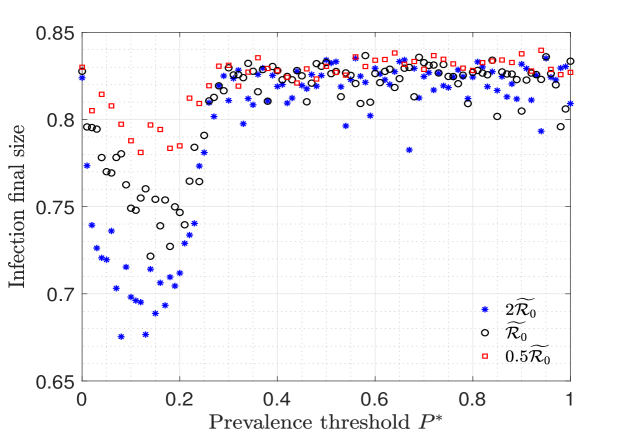
To investigate the impact of awareness on the previous result and on network , we vary the value of the awareness basic reproduction number via changes in the average time of behavior change . Figure (6) shows that the value of the optimal prevalence threshold increases as the increases. Accelerating awareness spread- increasing - does not seem to change final awareness size trend (Figure (5)). Nevertheless, it makes the prevalence threshold more effective at reducing infection final size.
4 Discussion
We used an agent-based network model to model the spread of infection and risk information within a population of individuals in different epidemiological states, education levels and information states. In our model infection spreads within an SIR framework while awareness disseminates only among susceptible individuals. Specifically, when a fraction of the infected people reaches a pre-determined threshold, public health officials start a massive information campaign on the risk and severity of infection. Information is transmitted by those not infected only. Awareness dynamics are triggered by public health authorities with the objective of conveying information about risk and severity of infection via aware susceptible individuals to unaware susceptible neighbors in the network. The level of awareness achieved is tied in to the the educational level of each individual and the disease prevalence. Aware susceptible individuals can become indifferent, stop propagating information on the the risk of infection, after sometime.
Simulations of the spread of infection or awareness are carried out on different network topologies. The patterns vary even when preserving some network properties such as the mean degree [4, 35, 25]. We simulated the spread of awareness and disease over three different network structures, namely Erdős-Rényi , Small world and Scale-free networks.
The results of the infection-awareness model show that Scale-free networks support a fastest rate of infection with the impact of awareness having the lowest effect on transmission. Small-world and Erdős-Rényi networks became less effective at disease transmission, and the role of information via aware individuals had a stronger impact in reducing transmission, Figure (4). These result are somewhat similar to those obtained by Chowell et al. [4] and Moreno et al. [25] as they studied the rate of infection rate of growth on an SIR model over Small-world and Scale-free networks, in the absence of awareness. These researchers observed that the spread of infection on Scale-free complex networks is faster than in a Small-world one. Pastor et al. [28] and Dezső et al. [6] focused on identifying the best strategy that can be used to control (reduce) an epidemic peak on a scale-free network. They concluded that to in order to control infection public health workers needed to immunize the hubs at an early stage. Our results are somewhat related, that is, we find that in order to control an infection, public health workers need to start awareness spread soon, that is, before hubs play the role of super-spreaders.
Infection final size is a function of network topology and prevalence threshold, , and the basic reproduction number . We observed that for Erdős-Rényi and Small-world networks under small value of , an optimal can be found for which the infection final size is minimized. This optimal point is the value that provides the best outcome under the prevalence at the time, , the time when temporary protection was promoted by aware susceptible individuals, Figures (5(a)) and (5(b)). For Scale-free network, for which there is no epidemic threshold, a monotonic increasing function final size is observed, a function of the prevalence threshold , there is no optimal point that minimizes infection final size, Figure (5(c)).
Infection network and awareness network: One of the big assumptions in our model is that the infection and awareness spread over the same network, ignoring the fact that individuals may have multiple sources of information outside their physical contact network. In fact, we know that information does flow through virtual neighbors such as facebook friends. How should we incorporate the role of physical network and virtual information? We are exploring possibilities.
Static network: Again, since we are focusing on single epidemic outbreak, we have assumed a short time frame in our simulation. We also assumed that the context network is static. The need to extend the model to a dynamic network where individuals are allowed to change neighbors is important in the study of disease spread over the longer time scale. The impact of awareness in such extended model would be prone to change as well.
For sexually transmitted infections on Scale-free network [20], waiting for enough people to become infected people before starting a campaign about risk of infection is not reasonable. For measles in children with basic reproduction numbers very high [17], waiting to reach pre-selected prevalence thresholds may also not be great idea. Our model results, highlight the importance of campaigns that warns a population about the risk and severity of infection for diseases that do not spread too fast, possibly including some flu infections or the severe acute respiratory syndrome (SARS). For disease with a basic reproduction number that it is is not high [17], and assuming that these infections spread over a random homogeneous networks such as Erdős-Rényi , it may not be unreasonable the existence of an optimal prevalence threshold to start and starting an awareness dynamic campaign.
References
- Azizi et al. [2018] Azizi, A., Dewar, J., and Mac Hyman, J. (2018). Using an agent-based sexual-network model to guide mitigation efforts for controlling chlamydia. bioRxiv, page 233239.
- Barabási and Albert [1999] Barabási, A.-L. and Albert, R. (1999). Emergence of scaling in random networks. science, 286(5439):509–512.
- Bollobás et al. [2003] Bollobás, B., Borgs, C., Chayes, J., and Riordan, O. (2003). Directed scale-free graphs. In Proceedings of the fourteenth annual ACM-SIAM symposium on Discrete algorithms, pages 132–139. Society for Industrial and Applied Mathematics.
- Chowell and Castillo-Chavez [2003] Chowell, G. and Castillo-Chavez, C. (2003). Worst-case scenarios and epidemics. In Bioterrorism: mathematical modeling applications in homeland security, pages 35–53. SIAM.
- Del Valle et al. [2005] Del Valle, S., Hethcote, H., Hyman, J. M., and Castillo-Chavez, C. (2005). Effects of behavioral changes in a smallpox attack model. Mathematical biosciences, 195(2):228–251.
- Dezső and Barabási [2002] Dezső, Z. and Barabási, A.-L. (2002). Halting viruses in scale-free networks. Physical Review E, 65(5):055103.
- Epstein et al. [2008] Epstein, J. M., Parker, J., Cummings, D., and Hammond, R. A. (2008). Coupled contagion dynamics of fear and disease: mathematical and computational explorations. PLoS One, 3(12):e3955.
- ERDdS and R&WI [1959] ERDdS, P. and R&WI, A. (1959). On random graphs i. Publ. Math. Debrecen, 6:290–297.
- Fenichel et al. [2011] Fenichel, E. P., Castillo-Chavez, C., Ceddia, M. G., Chowell, G., Parra, P. A. G., Hickling, G. J., Holloway, G., Horan, R., Morin, B., Perrings, C., et al. (2011). Adaptive human behavior in epidemiological models. Proceedings of the National Academy of Sciences, 108(15):6306–6311.
- Fraser et al. [2004] Fraser, C., Riley, S., Anderson, R. M., and Ferguson, N. M. (2004). Factors that make an infectious disease outbreak controllable. Proceedings of the National Academy of Sciences, 101(16):6146–6151.
- Funk et al. [2009] Funk, S., Gilad, E., Watkins, C., and Jansen, V. A. (2009). The spread of awareness and its impact on epidemic outbreaks. Proceedings of the National Academy of Sciences, 106(16):6872–6877.
- Funk and Jansen [2013] Funk, S. and Jansen, V. A. (2013). The talk of the town: modelling the spread of information and changes in behaviour. In Modeling the interplay between human behavior and the spread of infectious diseases, pages 93–102. Springer.
- Granell et al. [2013] Granell, C., Gómez, S., and Arenas, A. (2013). Dynamical interplay between awareness and epidemic spreading in multiplex networks. Physical review letters, 111(12):128701.
- Herrera-Valdez et al. [2009] Herrera-Valdez, M., Cruz-Aponte, M., and Castillo-Chavez, C. (2009). Multiple waves for the same pandemic: Local transportation and social distancing explain the dynamics of the a. H1N1 epidemic during.
- Herrera-Valdez et al. [2011] Herrera-Valdez, M. A., Cruz-Aponte, M., and Castillo-Chavez, C. (2011). Multiple outbreaks for the same pandemic: Local transportation and social distancing explain the different” waves” of a-h1n1pdm cases observed in méxico during 2009. Mathematical Biosciences & Engineering, 8(1):21–48.
- Hyman and Li [2007] Hyman, J. M. and Li, J. (2007). Infection-age structured epidemic models with behavior change or treatment. Journal of biological dynamics, 1(1):109–131.
- Keeling and Rohani [2011] Keeling, M. J. and Rohani, P. (2011). Modeling infectious diseases in humans and animals. Princeton University Press.
- Kiss et al. [2010] Kiss, I. Z., Cassell, J., Recker, M., and Simon, P. L. (2010). The impact of information transmission on epidemic outbreaks. Mathematical biosciences, 225(1):1–10.
- Kiss et al. [2017] Kiss, I. Z., Miller, J. C., Simon, P. L., et al. (2017). Mathematics of epidemics on networks. Cham: Springer.
- Liljeros et al. [2001] Liljeros, F., Edling, C. R., Amaral, L. A. N., Stanley, H. E., and Åberg, Y. (2001). The web of human sexual contacts. Nature, 411(6840):907.
- May and Lloyd [2001] May, R. M. and Lloyd, A. L. (2001). Infection dynamics on scale-free networks. Physical Review E, 64(6):066112.
- Meloni et al. [2011] Meloni, S., Perra, N., Arenas, A., Gómez, S., Moreno, Y., and Vespignani, A. (2011). Modeling human mobility responses to the large-scale spreading of infectious diseases. Scientific reports, 1:62.
- Misra et al. [2011] Misra, A., Sharma, A., and Shukla, J. (2011). Modeling and analysis of effects of awareness programs by media on the spread of infectious diseases. Mathematical and Computer Modelling, 53(5-6):1221–1228.
- Moore and Newman [2000] Moore, C. and Newman, M. E. (2000). Epidemics and percolation in small-world networks. Physical Review E, 61(5):5678.
- Moreno et al. [2002] Moreno, Y., Pastor-Satorras, R., and Vespignani, A. (2002). Epidemic outbreaks in complex heterogeneous networks. The European Physical Journal B-Condensed Matter and Complex Systems, 26(4):521–529.
- Newman and Watts [1999] Newman, M. E. and Watts, D. J. (1999). Renormalization group analysis of the small-world network model. Physics Letters A, 263(4-6):341–346.
- Pastor-Satorras et al. [2015] Pastor-Satorras, R., Castellano, C., Van Mieghem, P., and Vespignani, A. (2015). Epidemic processes in complex networks. Reviews of modern physics, 87(3):925.
- Pastor-Satorras and Vespignani [2002] Pastor-Satorras, R. and Vespignani, A. (2002). Immunization of complex networks. Physical Review E, 65(3):036104.
- Perra et al. [2011] Perra, N., Balcan, D., Gonçalves, B., and Vespignani, A. (2011). Towards a characterization of behavior-disease models. PloS one, 6(8):e23084.
- Perrings et al. [2014] Perrings, C., Castillo-Chavez, C., Chowell, G., Daszak, P., Fenichel, E. P., Finnoff, D., Horan, R. D., Kilpatrick, A. M., Kinzig, A. P., Kuminoff, N. V., et al. (2014). Merging economics and epidemiology to improve the prediction and management of infectious disease. EcoHealth, 11(4):464–475.
- Poletti et al. [2011] Poletti, P., Ajelli, M., and Merler, S. (2011). The effect of risk perception on the 2009 h1n1 pandemic influenza dynamics. PloS one, 6(2):e16460.
- Poletti et al. [2012] Poletti, P., Ajelli, M., and Merler, S. (2012). Risk perception and effectiveness of uncoordinated behavioral responses in an emerging epidemic. Mathematical biosciences, 238(2):80–89.
- Poletti et al. [2009] Poletti, P., Caprile, B., Ajelli, M., Pugliese, A., and Merler, S. (2009). Spontaneous behavioural changes in response to epidemics. Journal of theoretical biology, 260(1):31–40.
- Sahneh et al. [2012] Sahneh, F. D., Chowdhury, F. N., and Scoglio, C. M. (2012). On the existence of a threshold for preventive behavioral responses to suppress epidemic spreading. Scientific reports, 2:632.
- Shirley and Rushton [2005] Shirley, M. D. and Rushton, S. P. (2005). The impacts of network topology on disease spread. Ecological Complexity, 2(3):287–299.
- Towers et al. [2015] Towers, S., Afzal, S., Bernal, G., Bliss, N., Brown, S., Espinoza, B., Jackson, J., Judson-Garcia, J., Khan, M., Lin, M., et al. (2015). Mass media and the contagion of fear: the case of ebola in america. PloS one, 10(6):e0129179.
- Tracht et al. [2010] Tracht, S. M., Del Valle, S. Y., and Hyman, J. M. (2010). Mathematical modeling of the effectiveness of facemasks in reducing the spread of novel influenza a (h1n1). PloS one, 5(2):e9018.
- Velasco-Hernández et al. [1996] Velasco-Hernández, J. X., Brauer, F., and Castillo-Chavez, C. (1996). Effects of treatment and prevalence-dependent recruitment on the dynamics of a fatal disease. Mathematical Medicine and Biology: A Journal of the IMA, 13(3):175–192.
- Wang et al. [2015] Wang, Z., Andrews, M. A., Wu, Z.-X., Wang, L., and Bauch, C. T. (2015). Coupled disease–behavior dynamics on complex networks: A review. Physics of life reviews, 15:1–29.
- Watts and Strogatz [1998] Watts, D. J. and Strogatz, S. H. (1998). Collective dynamics of ‘small-world’networks. nature, 393(6684):440.
- Wu et al. [2012] Wu, Q., Fu, X., Small, M., and Xu, X.-J. (2012). The impact of awareness on epidemic spreading in networks. Chaos: an interdisciplinary journal of nonlinear science, 22(1):013101.
Appendix
In this appendix, first we define some models for the network structures we used for our simulation, then we present the pseudocode of our model.
Definition 4.1
Erdős-Rényi random network Suppose we have disconnected nodes, and then we make edge between two arbitrary nodes with probability independent from every other edge. The graph constructed via this model is called Erdős-Rényi random network . The parameter in the model is a weighting function , where for closer to one the generated graph is more likely to construct graphs with more edges [8].
Definition 4.2
Small-world network Suppose we have nodes over a ring, where each node in the ring is connected to its nearest neighbors in the ring. Then with probability and independent from any other pair of edges we select two edges and such that is from the k nearest neighbor of for , and rewire them. Then the constructed network is called Watts-Strogatz Smal-world network [40] .
Definition 4.3
Preferential attachment Scale-free network
Suppose we want to generate a network of nodes. We start with one node and follow the following procedure times: the probability of attaching a new node to the existing ones is proportional to their current degree:
, where the is the number of neighbors for node , then with this probability we make new edge . The constructed network via this model is called Barabasi–Albert Scale-free network [2]. The degree distribution of this network follows a power-law distribution.
Now, we define assumptions and algorithm of our model. Person at any given day has one of the states: , or . The fraction of infected people at dat is , and is a positive fraction . We define which is the first time that reaches . We assume Education level for each person , does not change by time. Also prior to time every susceptible person is at state , and finally the time scale for each update is day, in which each person can have at most one update. The following algorithms show the details.
| Notation | Description |
|---|---|
| Set of susceptible nodes at time t | |
| Set of unaware nodes at time t | |
| Set of aware nodes at time t | |
| Set of careless nodes at time t | |
| Set of infected nodes at time t | |
| Set of quarantine nodes at time t | |
| Set of free nodes at time t | |
| Set of recovered nodes at time t | |
| Set of neighbors of node k in Network G | |
| (k) | Infection period for infected node k |
| (k) | Awareness period for aware node k |
| Exponential random number with average for | |
| Uniform random number in | |
| Probability of having contact between two neighbors k and j | |
| Element k moves from set A to set B |