REMAP: Determination of the inner edge of the dust torus in AGN by measuring time delays111Echo Mapping of Active Galactic Nuclei
Abstract:
Active galactic nuclei (AGN) are high luminosity sources powered by accretion
of matter onto super-massive black holes (SMBHs) located at the centres of
galaxies. According to the Unification model of AGN, the SMBH is surrounded by a broad emission line region (BLR) and a dusty torus. It is difficult to
study the extent of the dusty torus as the central region of AGN is not
resolvable using any conventional imaging techniques available today. Though, current
IR interferometric techniques could in principle resolve the torus in
nearby AGN, it is very expensive and limited to few bright and nearby AGN. A more feasible alternative to the interferometric technique to find
the extent of the dusty torus in AGN is the technique of reverberation
mapping (RM). REMAP (REverberation Mapping of AGN Program) is a long term
photometric monitoring program being carried out using the 2 m Himalayan
Chandra Telescope (HCT) operated by the Indian Institute
of Astrophysics, Bangalore, aimed at measuring the torus size in many AGN using
the technique of RM. It involves accumulation of suitably long and
well sampled light curves in the optical and near-infrared bands to measure
the time delays between the light curves in different wavebands. These
delays are used to determine the radius of the inner
edge of the dust torus. REMAP was initiated in the year 2016 and since then about
one hour of observing time once every five days (weather permitting) has been
allocated at the HCT. Our initial sample carefully selected for this program
consists of a total of 8 sources observable
using the HCT. REMAP has resulted in the determination of the
extent of the inner edge of the dusty torus in one AGN
namely H0507+164. Data accumulation for the second source is completed and
observations on the third source are going on. We will outline the motivation
of this observational program, the observational strategy that is followed,
the analysis procedures adopted for this work and the results obtained
from this program till now.
Keywords: galaxies – active – quasars – Seyfert – reverberation
1 Introduction
The unified model of active galactic nuclei (AGN; Urry Padovani 1995; Antonucci 1993) posits a dusty torus surrounding the broad line region (BLR) and the central super massive black hole (SMBH). The broad band spectral energy distribution (SED) of AGN contains a prominent big blue bump indicative of emission from the accretion disk and an excess emission in the infrared (IR) region attributed to thermal emission from the dusty torus. The dusty torus absorbs the UV/optical radiation from the accretion disk and re-emits it in the IR band. The torus is therefore thought to be the dominant source of IR radiation in most AGN and can also explain the IR bump seen in the SED of AGN. Understanding this obscuration of the central engine is therefore important to constrain the physical processes happening in the central regions of an AGN. However, the torus is so small that it is not possible to image it using any existing imaging system on a single telescope. In spite of our inability to directly image the torus using a single telescope, it is possible to infer the size and structure of the torus via two important methods namely (a) reverberation mapping (RM; Blandford McKee 1982) and (b) IR interferometry. In the method of RM, if we monitor AGN continuum fluxes in the UV/optical and near-infrared, a time-lag would be expected that corresponds to the distance between the central engine and the hot dust region from which the bulk of near-infrared emission is radiated (e.g., Clavel, Wamsteker & Glass 1989; Nelson 1996; Glass 2004). By measuring this time delay one can (i) put constraints on the inner radius of the dusty torus that surrounds the AGN and (ii) probe the physical processes happening in the central regions of an AGN. Such reverberation lags between near-IR (K-band) and optical V-band light curves are available for about 20 Seyfert galaxies and these lags are believed to represent the inner radius (Rin) of the torus (Minezaki et al. 2004; Suganuma et al. 2006; Koshida et al. 2009, 2014). The RM observations have found a relation between Rin and UV luminosity as (Minezaki et al. 2004; Suganuma et al. 2006), where is the lag between optical and IR flux variations and is the speed of light. For Seyfert galaxies with typical UV luminosities of 1042 1044 ergs s-1, the inner radius at which the hot dust sublimates can be of the order of 0.01 0.1 pc or 10 100 light days (Suganuma et al. 2006). Also, near-infrared (NIR) interferometric observations have been able to measure the size of the dusty torus in a few nearby AGN (Swain et al. 2003, Kishimoto et al. 2009, 2011a, Pott et al. 2010, Weigelt et al. 2012)
In addition to NIR, mid-IR interferometric observations are also available for about two dozen AGN (Tristram et al. 2007; Burtscher et al. 2009; Tristram et al. 2009; Honig et al. 2013). It has been pointed out by Kishimoto et al. (2007) that the of the dusty torus found by RM is systematically smaller by a factor of 3 compared to sublimation radius (Rsub) predicted from the dust sublimation temperature (Tsub) of about 1600 K (Barvainis 1992). It has been thought that this discrepancy may be due to a combination of many factors such as the dust grain size, clumpy dusty torus, anisotropic illumination of the accretion disk (Kawaguchi Mori 2010), winds/outflows from the accretion disk (Konigl Kartje 1994; Elitzur Shlosman 2006; Czerny Hryniewicz 2011), etc. The observations to confront predictions from Tsub are available for 17 AGN monitored for dust reverberation. However the RM data for these 17 AGN have poor time resolution. As the sample size is small to obtain constrains on the nature of the torus as well as to understand the causes for the discrepancy between observations and predictions, it is very important to have RM estimates of torus size for many AGN. Towards this objective, we have started a monitoring project called the REverberation Mapping of Active Galactic Nuclei Program (REMAP). REMAP was started in the year 2016, and it involves carrying out optical V and B-band, and infrared J, H and band observations of a sample of AGN. As of now REMAP uses the 2m Himalayan Chandra Telescope at Hanle.
2 The technique of Reverberation mapping
Echo mapping or Reverberation mapping is a standard tool for probing the structure and kinematics of the BLR and dust region in AGN. The emission line from BLR or the NIR flux from torus echoes with the variation in UV/optical fluxes from accretion disk. In its simplest form, the mean time delay between continuum and emission line/NIR variations is measured typically by cross-correlation of the respective light curves. Suppose a(t) denotes the UV/optical light curve of the accretion disk and b(t) represents the line emission light curve from BLR or NIR light curve from torus, then a(t) and b(t) are causally connected with a time lag through the transfer equation (Peterson 2001):
| (1) |
where is the transfer function which encodes the geometry and kinematics of the emitting region. The RM technique relies on the following three important assumptions (Peterson 2001)
-
1.
The continuum originates in a single central source of isotropic radiation.
-
2.
Light-travel time is the most important time scale here.
-
3.
There is a simple, though not necessarily linear relationship between the observed continuum and the ionizing continuum.
Thus, by measuring a(t) and b(t), one can infer the geometry and kinematics of the emitting region.
3 The REMAP project
Determination of the extent of the inner edge of the dusty torus in an AGN through RM is not very expensive compared to interferometric observations. Also, through reverberation mapping observations we can determine the torus size in distant AGN, while interferometric observations are limited to just a few bright and nearby AGN. However, RM observations are challenging and the difficulty lies in accumulating sensitive and high cadence light curves. The method of RM as of now has been applied to about twenty AGN to measure the inner rim of the torus (Koshida et al. 2014). The possible reasons for the paucity of such data could be due to a) difficulties in scheduling observations in the optical and NIR, b) due to limited attempts made in this direction. Our objective through the REMAP project is to increase the number of AGN in the low-luminosity end of AGN dust torus size luminosity relation with the RM based estimates of the dust torus size inferred from high cadence optical IR monitoring observations. The initial sample of sources for monitoring under REMAP were selected as follows
-
1.
Firstly, we took the sample of 60 sources for which RM of BLR were available (Bentz et al. 2015). This is because, there are only a few sources for which the time lag measurements for both BLR and the torus are available. Comparisons of these measurements indicate that the torus lag is 45 times larger than the BLR lag.
-
2.
Secondly, we imposed the condition that the BLR lag should be greater than 3 days and lesser than 10 days. This condition was guided by our ability to observe each source once every five days, which sets the time resolution of our data. With this time resolution it would be possible to obtain meaningful lag only for those sources that are expected to have dust lag more than 30 days or so and monitored for a duration of about 6 months.
-
3.
Thirdly the sources must be brighter than 16.5 magnitude in the V-band and must have declination greater than 10 degree. The magnitude constraint was imposed so as to get good S/N data within our allocated time at the HCT and the declination limit is for the observability of sources from HCT.
The above selection criteria lead us to a final sample of 8 sources for REMAP. The details of these sources are given in Table 1.
4 Observations, reduction and analysis
| No. | Object Name | RA (2000) | DEC (2000) | V (mag) | Type | MBH () | RBLR (days) | |
|---|---|---|---|---|---|---|---|---|
| 1 | H0507+164 | 05:10:45.5 | +16:29:56 | 15.64 | 0.018 | Seyfert 1.5 | ||
| 2 | Z 229-15 | 19:05:25.9 | +42:27:40 | 15.40 | 0.028 | Seyfert 1 | ||
| 3 | Mrk 142 | 10:25:31.3 | +51:40:35 | 16.15 | 0.045 | Seyfert 1 | ||
| 4 | MCG+10-16-111 | 11:18:57.7 | +58:03:24 | 16.71 | 0.028 | Seyfert 1 | ||
| 5 | Arp 151 | 11:25:36.2 | +54:22:57 | 16.49 | 0.021 | Seyfert 1 | ||
| 6 | Mrk 1310 | 12:01:14.3 | 03:40:41 | 15.91 | 0.019 | Seyfert 1 | ||
| 7 | Mrk 202 | 12:17:55.0 | +58:39:35 | 16.41 | 0.021 | Seyfert 1 | ||
| 8 | NGC 5273 | 13:42:08.3 | +35:39:15 | 13.12 | 0.003 | Seyfert 1 |
4.1 Observations
REMAP monitoring started in the year 2016 and since then data are being accumulated once every 5 days. Given the observational constraints, the strategy that is currently adopted is that one source will be monitored for a minimum duration of about six months. Observations are being carried out using 2-m Himalayan Chandra Telescope (HCT) operated by Indian Institute of Astrophysics, India. The optical observations are being carried out using the Himalayan Faint Object Spectrograph and Camera (HFOSC) mounted at the Cassegrain focus equipped with a 2K4K SiTe CCD system. Each pixel of the CCD corresponds to 0.3 0.3 arcsec2, covering a total field of view of 10 10 arcmin2. The typical exposure times in B and V-band are about 150200 seconds and 50100 seconds, respectively depending on the sky conditions on any particular night of observation. The IR observations in J, H and bands are being made using the TIFR Near Infrared Spectrometer (TIRSPEC) mounted on one of the side ports of HCT (Ninan et al. 2014), covering a field of view of 55 arcmin2. The IR observations are performed in dithered mode at three dither positions each having 20 seconds exposure time for each of three IR filters namely J, H and . Thus at any given epoch, observations in two optical bands (B and V) and three IR bands (J, H and Ks) are completed within 45 minutes.
4.2 Data reduction
Reduction of the data acquired in optical B and V bands were carried out using IRAF (Image Reduction and Analysis Facility)222IRAF is operated by the Association of Universities for Research in Astronomy, Inc., under cooperative agreement with the National Science Foundation. and MIDAS (Munich Data Analysis System)333MIDAS is the trade-mark of the European Southern Observatory.. As some of the source in our sample are at low redshift, host galaxy is conspicuously present in the acquired image frames (as seen in Mrk 202), that can contaminate the photometry of the AGN. In such cases GALFIT (Peng et al. 2002) is used to remove the host galaxy contribution. The NIR data are reduced using TIRSPEC NIR Data Reduction Pipeline developed by Ninan et al. (2014). We used differential photometry to convert the instrumental magnitudes to apparent magnitudes using few stars present in the same image frame, whose apparent magnitudes are taken from SIMBAD444http://simbad.u-strasbg.fr/simbad/. After correcting for the galactic extinction taken from the NASA/IPAC Extragalactic data base (NED)555https://ned.ipac.caltech.edu/, the apparent magnitudes were converted into fluxes.
4.3 Analysis
4.3.1 Subtraction of the accretion disk component from the NIR flux
For sources that are monitored as part of REMAP, multi-band light curves are first generated. They are then cross-correlated to find the delay between the optical V-band and three NIR bands. For this the NIR flux is expected to be only from the torus. However, this is not the case as the NIR-flux also contains emission component from the accretion disk. The presence of accretion disk component of NIR-flux to the generated IR light curves would make the time lag shorter than the actual lag of the dust-torus emission (Koshida et al. 2014). Therefore, the contribution of accretion disk to observed NIR-flux values needs to be removed before any correlation analysis between the light curves in V-band and NIR. For this the contribution of accretion disk to the NIR flux is evaluated as follows (Koshida et al. 2014)
| (2) |
where and are accretion disk component of the NIR flux and the V-band flux at time t respectively. and are effective frequencies of V, NIR (J, H, ) bands respectively and is the power-law index which can be estimated using
| (3) |
The power law index is evaluated for each epoch for our observations using the V and B-band measurements which is then used to correct for the contribution of the accretion disk to the NIR flux.
4.3.2 Lag between optical and NIR flux variations
To have a quantitative estimate of the lag between optical and NIR flux variations, we use both the discrete cross-correlation function (Edelson Krolik 1988) and the interpolated cross correlation function (Gaskell Sparke 1986; Gaskell Peterson 1987). Uncertainties in the derived lags are estimated using Monte Carlo simulation methods that used both flux randomization and random subset selection using the procedures outlined in Peterson et al. (1998).
5 Results
Since the start of REMAP, observations are regularly taken from the 2m HCT. We briefly discuss the results obtained from this programme.
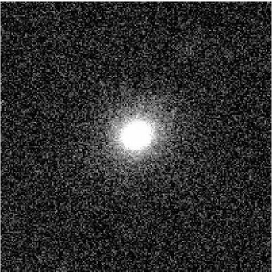
5.1 Mrk 202
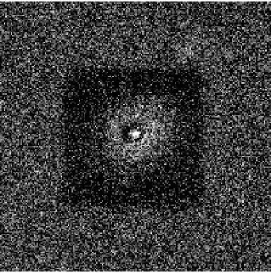
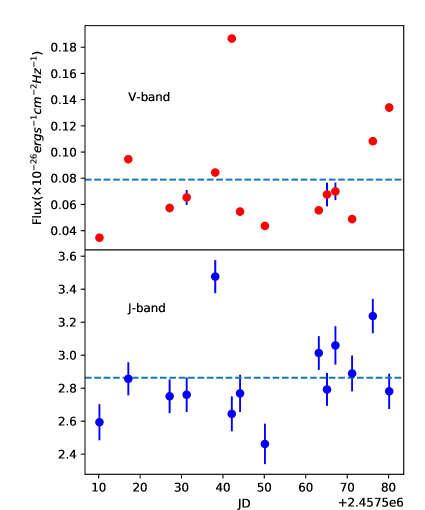
Mrk 202 is a Seyfert 1 galaxy at a redshift of = 0.021. Monitoring of this object started in the year 2016, however, as the observing run was affected by bad weather, we could accumulate 14 data points for Mrk 202 in optical V-band and NIR J-band. This sources has a prominent host galaxy in the observed V-band images (Figure 1). To get the flux of the AGN, GALFIT (Peng et al. 2002) was used to remove the contribution of the host galaxy for each epoch so that changes in seeing will not affect in the final flux-measurement. Aperture photometry was done on the images after removal of the underlying host galaxy component (Figure 2). The generated V and J-band light curves are shown in Figure 3. To correct for the contribution of the accretion disk to the observed J-band flux Eq. 2 was used wherein was taken as 1/3 (Koshida et al. 2014, Mandal et al. 2018). Due to the availability of limited amount of observations, time lag could not be obtained for Mrk 202. This object is planned for re-observation from the middle of 2019.
5.2 Z229-15
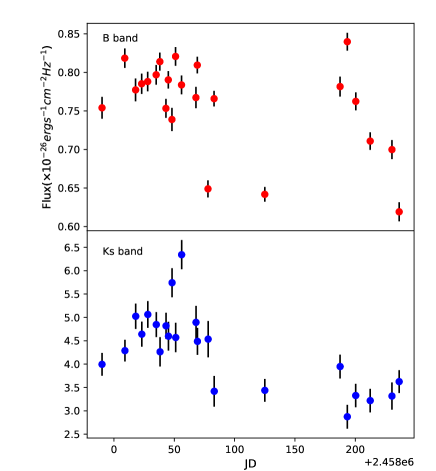
Z229-15 is a Seyfert 1 galaxy at a redshift of = 0.028. About 25 epochs of observations were accumulated in the optical V and B-bands and in the NIR J, H and Ks bands. The contribution of accretion disk to the NIR flux was corrected as per the details outlined in Section 4.3.1. Preliminary light curves in the optical B-band and NIR Ks band are shown in Figure 4. Further analysis of the data acquired on this object is in progress.
5.3 H0507+164
About 35 epochs of data were accumulated for this object in the optical V-band and NIR J,H and Ks bands. The accumulated data were analysed following the procedures given in Section 4.2 and 4.3. Using cross-correlation analysis we found a lag of 34.6 days between V and Ks bands. Thus from light travel arguments, we found the inner radius of the dust torus in H0507+164 as 0.03 pc (Mandal et al. 2018).
6 Summary
REMAP was started as an observational program on the 2m HCT, with the prime motivation to find the inner edge of the dusty torus in more number of AGN using the technique of RM. Towards this, our carefully selected sample consists of a total of eight sources. We summarize the results obtained from REMAP till today
-
1.
We have successfully obtained the size of the torus in one source, namely, H0507+164 a Seyfert 1.5 galaxy at = 0.018. Using about 35 epochs of data obtained between the period October 2016 to April 2017, we found that the inner edge of the torus is located at a distance of 0.029 pc from the central optical continuum source.
-
2.
For Mrk 202, we could accumulate only 14 epochs of data. Though the observations has indicated the source is variable, the acquired data are not sufficient enough to determine the time lag via cross-correlation analysis. This object is planned for observation in the upcoming cycle in 2019.
-
3.
For Z229-15, observations are over. Analysis of the data indicates that the sources is variable. Further analysis is in progress. By the end of the year 2021, we expect to have the radius of the inner edge of the torus in all the eight AGN selected for REMAP. Efforts are also being taken to increase the sample size and involve other medium size telescopes.
Acknowledgements
We thank to the supporting staff at the Indian Astronomical Observatory (IAO), Hanle, and CREST, Hoskote. AKM and RS thank the National Academy of Sciences, India for providing the required fund for this project. This work also used the SIMBAD data base, operated at CDS, Strasbourg, France, the NED, which is operated by the Jet Propulsion Laboratory, California Institute of Technology, under contract with NASA and data products from the Two Micron All Sky Survey, a joint project of the University of Massachusetts and the Infrared Processing and Analysis Center/California Institute of Technology, funded by the NASA and the National Science Foundation. AKM acknowledges the local support from the organising committee of the 2nd Belgo-Indian Network for Astronomy astrophysics (BINA) workshop, held in Brussels, Belgium in October, 2018.
References
Antonucci R. 1993, ARAA, 31, 473
Barvainis R. 1992, ApJ, 400, 502
Bentz M. C., Katz S. 2015, PASP, 127, 67
Blandford R. D., McKee C. F. 1982, ApJ, 255, 419
Burtscher L., Meisenheimer K., Tristram K. R. W. et al. 2013, AA, 558, 149
Clavel J., Wamsteker W., Glass I. 1989, ApJ, 337, 236
Czerny B., Hryniewicz K. 2011, AA, 525, L8
Edelson R. A., Krolik J. H. 1988, ApJ, 333, 646
Elitzur M., Shlosman I. 2006, ApJ, 648, L101
Gaskell C. M., Peterson B. M. 1987, ApJS, 65, 1
Gaskell C. M., Sparke L. S. 1986, ApJ, 305, 175
Glass I. S. 2004, MNRAS, 350, 1049
Honig S. F., Kishimoto M., Tristram K. R. et al. 2013, ApJ, 771, 87
Kawaguchi T., Mori M. 2010, ApJ, 724, L183
Kishimoto M., Honig S. F., Antonucci R. et al. 2009, A 507, L57
Kishimoto M., Honig S. F., Antonucci R. et al. 2011a, AA, 527, A121
Kishimoto M., Honig S. F., Antonucci R. et al. 2011b, AA, 536, A78
Konigl A., Kartje J. F. 1994, ApJ, 434, 446
Koshida S., Minezaki T., Yoshii Y. et al. 2014, ApJ, 788, 159
Koshida S., Yoshii Y., Kobayashi Y. et al. 2009, ApJL, 700, L109
Mandal A. K., Rakshit S., Kurian K. S. et al. 2018, MNRAS, 475, 5330
Minezaki T., Yoshii T., Kobayashi Y. et al. 2004, ApJL, 600, L35
Nelson B. O. 1996, ApJL, 465, L87
Ninan J. P., Ojha D. K., Ghosh S. K. et al. 2014, JAI, 3, 1450006
Peng C. Y., Ho L. C., Impey C. D. et al. 2002, AJ, 124, 266
Peterson B. M., Wanders I., Horne K. et al. 1998, PASP, 110, 660
Peterson B. M. 2001, Advanced Lectures on the Starburst-AGN Connection, 3
Pott J. U., Malkan M. A., Elitzur M. et al. 2010, ApJ, 715, 736
Suganuma M., Yoshii Y., Kobayashi Y. et al. 2006, ApJ, 639, 46
Swain M., Vasisht G., Akeson R. et al. 2003, ApJL, 596, 163
Tristram K. R. W., Meisenheimer K., Jaffe W. et al. 2007, AA, 474, 837
Tristram K. R. W., Raban D., Meisenheimer K. et al. 2009, AA, 502, 67
Urry C. M., Padovani P. 1995, PASP, 107, 803
Weigelt G., Hofmann K. H., Kishimoto M. et al. 2012, AA, 541, A9