Cage occupancies in nitrogen clathrate hydrates
from Monte Carlo simulations
Abstract
Comparisons of Gibbs ensemble Monte Carlo simulations with experimental data for the cage occupancies in \chN2 clathrate hydrates are performed to assess the accuracy of such simulations, to refine the effective potentials employed, and to help interpret recently measured large cage over small cage occupancy ratios [Petuya et al., J. Phys. Chem. C 122, 566 (2018)]. Different sets of interaction potentials for \chN2-N2, \chN2-H2O and \chH2O-H2O interactions are considered. Some of them fail to reproduce the known experimental fact that some large cages are doubly occupied at 273 K and high pressures. The best agreement between simulations and experiments is obtained when using a new \chN-O interaction potential derived in this work by averaging an ab-initio potential energy surface for the \chN2-H2O dimer.
keywords:
American Chemical Society, LaTeXaffiliation1]
Institut UTINAM, Univ. Bourgogne-Franche-Comté, UMR CNRS 6213,
16, route de Gray, 25030 Besançon Cedex, France
\abbreviationsIR,NMR,UV
Some journals require a graphical entry for the Table of Contents. This should be laid out “print ready” so that the sizing of the text is correct.
Inside the tocentry environment, the font used is Helvetica 8 pt, as required by Journal of the American Chemical Society.
The surrounding frame is 9 cm by 3.5 cm, which is the maximum permitted for Journal of the American Chemical Society graphical table of content entries. The box will not resize if the content is too big: instead it will overflow the edge of the box.
This box and the associated title will always be printed on a separate page at the end of the document.
1 Introduction
A gas clathrate hydrate is a form of crystalline ice where the water molecules form a solid network with small and large cavities that encapsulate guests 1. This molecular structure is stable at high pressure and/or low temperature. Methane (clathrate) hydrates have been found in natural gas pipelines, deep sea sediment and permafrost regions. They are considered to be an enormous possible future energy resource 1. Their exploitation could be combined with the sequestration of carbon dioxide, in the form of \chCO2 hydrate on the seafloor, to help keeping the concentration of this global warming gas under control2. Nitrogen molecules were found to act as a promoter in the \chN2–assisted \chCH4-CO2 exchange reaction3. Since flue gas mixtures contain a mixture of \chN2 and \chCO2, a deep understanding of mixed \chN2-CO2 clathrates, and also pure \chN2 and \chCO2 clathrates as reference systems, is important for this technology. Air clathrates, containing \chN2, \chO2 and other trace gases, are found on Earth below ice caps at a depth of or more. They are of particular interest as they contains relics of our ancient atmosphere up to 420 kyr back. \chN2 clathrates may also be present in comets and in some planets or their satellites of our solar system4, 5.
There exist 3 clathrate structures at low pressures: two cubic ones (sI, sII) and a hexagonal one (sH)1. \chN2 clathrates crystallize in a cubic structure: the structure I is kinetically favoured, while the sII is the thermodynamically stable structure if the pressure is not too high (a transition to sH is observed at the high pressure 0.85 GPa)6, 7, 8. The unit cell of the sI crystal contains 46 water molecules forming 8 cages: 2 small and 6 large ones. The unit cell of sII contains 136 water molecules forming 24 cages: 16 small cages and 8 large cages (these large cages are slightly bigger than in sI). Structure II is promoted by the ability of the small molecule \chN2 to fill in the numerous small cages of this structure.
The cage occupancies and of small (S), respectively large (L), cages in a clathrate is an important quantity for practical applications: they determine the gas storage capacity (see e.g. Ref. 9 for hydrogen storage) and intervene also in the calculation of phase equilibria involving clathrates1, 10. Occupancies in a nitrogen clathrate have been measured, at and pressures up to using powder neutron diffraction and Rietveld refinement by Chazallon and Kuhs 11 for both sI and sII. They discovered that some large cages in sII can be doubly occupied at pressures above . An additional measurement at and in a sI nitrogen clathrate was performed by Qin and Kuhs12; it also shows some double occupancy of the large cages: % while . Yet another measurement in a sII clathrate at and at a lower temperature gave: % and 13. Occupancy ratios have moreover been measured at pressures up to 200 bar and for temperatures down to by Petuya et al6. The latter authors used another technique, Raman spectroscopy, which does not provide separately the occupancies of large and small cages, but only their ratio.
The purpose of the present paper is to perform Monte Carlo simulations to determine the occupancy of cages in \chN2 clathrates at thermodynamical equilibrium for the same conditions as in the previous experiments. This will enable us to assess the agreement between simulations and experiments for a wide range of conditions covering both single and multiple occupancy regimes for the cages, and to help interpret the recently measured occupancy ratios6 in terms of separate occupancies and . Notice that similar comparisons but for the simpler methane clathrate, which forms in structure I and which does not show any multiple occupancy of cages, have been done by several authors14, 15, 16.
Only few simulations results for a \chN2 clathrate can be found in the literature17, 18, 19, 20, 21, 22. Horikawa et al., and later van Klaveren et al., have studied the dynamical behavior of encaged \chN2 molecules using molecular dynamics (MD)17, 21. van Klaveren et al. have shown also that a \chN2 hydrate with sII at high pressure remains mechanically stable even for the case of a full double occupancy of the large cages.19. In those MD simulations, the number of guest \chN2 molecules is fixed beforehand and no attempt was made to quantify the thermodynamical stability of a phase with full or partial double occupation. The Monte Carlo (MC) method overcomes this difficulty because MC moves with insertion/deletion of guest molecules allow the average cage occupancy of the simulated clathrate to converge automatically towards its value at thermodynamical equilibrium. A grand-canonical Monte Carlo (GCMC) calculation of cage filling in a \chN2 clathrate has been performed by Klapproth et al.18, who found an unsatisfactory agreement: simulations strongly overestimated the occupancy when using the simple point charge (SPC) water model.111This overestimation was probably due in part to their assumption of a rigid water framework. Patt et al. performed GCMC simulations of \chN2, \chCO and mixed \chN2-CO clathrates but only at low temperatures (, and ) and they did not compare quantitatively with experimental data22. Their calculations suggest that experiments performed on the single-guest \chN2 and \chCO clathrates might be sufficient to get information on the corresponding mixed clathrates.
In the present work, the Gibbs ensemble Monte Carlo (GEMC) technique is employed because of its convenience: the experimental pressure and temperature are direct input parameters for the simulation and the volume of the simulated clathrate adjusts itself automatically to the imposed pressure. This can be contrasted with grand-canonical MC simulations where the volume is fixed (and must hence be adjusted manually when varying the pressure) and where the pressure of the gas is not controlled directly but must be deduced from its fugacity by using an appropriate equation of state.
2 Computational details
Isobaric-isothermal Gibbs ensemble Monte Carlo simulations were performed with the open-source MCCCS Towhee simulation program23 (version 7.2.0) to compute the cage occupancies and for pressures and temperatures where experimental data points are available. In this ensemble two simulation boxes are held at the same constant pressure and temperature , while the total number of water and nitrogen molecules across both boxes, is also constant. One box represents the \chN2 clathrate crystal and the other the nitrogen gas phase. Some additional GCMC simulations were performed with the open-source DL_MONTE-2 simulation code24; their results were consistent with those of Towhee.
2.1 Molecular models
A classical description of the interaction potentials between water and guest molecules has been used. Short-range and dispersion interactions were computed as a sum of pairwise Lennard-Jones (LJ) or Buckingham (also known as Exp-6) interactions between interaction sites located on the \chH2O and \chN2 molecules. Coulomb interactions between point partial charges were computed using the Ewald summation technique. Different force fields have been considered to gauge the sensitivity of the predicted cage occupancies on the choice of the force field. The water molecules have been represented by the TIP4P-Ew25 and the TIP4P/Ice models26.
To properly describe double occupancy of cages in a \chN2 clathrate, a highly accurate model for the repulsive interaction between two \chN2 molecules is required because they are in close contact when occupying the same cage. Two models were used to represent the \chN2 molecule: the model of Potoff et al.27 which is included in the TraPPE force field, and the model of Etters et al.28. The Potoff model is a 3-site model with a partial charge a.u. on each N atom (which are separated by a distance Å) and a partial charge on the center of mass, and with a LJ interaction associated with each \chN atom. Its parameters (see Table 1) are very close to the model X1 of Murthy et al.29 that was used in the simulation study by Klapproth18: the geometric and LJ parameters are almost identical, but the latter model differs by the fact that it features no point charge but a point quadrupole of strength located on the center of mass (that strength is considered to be an adjustable parameter in the X1 model and results from a best fit to a wide range of properties). The Etters model involves 6 interaction sites: a repulsion-dispersion interaction site on each N atom and 4 Coulomb interaction sites along the axis of the molecule at the positions and Å, i.e. further away than the N atoms which are at positions Å.
| Model | Type | (Å) | (K) | |
| TraPPE27 | LJ | 3.31 | 36.0 | - |
| Etters et al.28 | Exp-6 | 3.3779 | 32.8519 | 13.1946 (a) |
| Exp-6 | 3.3269 | 39.7347 | 15.0755 (b) | |
| (a) if Å; (b) if Å; see Ref.28 otherwise | ||||
Similarly to van Klaveren et al., we have modified slightly the electrostatic description to reduce the number of interaction sites to 3 and to match the experimentally observed quadrupole moment []. The repulsion-dispersion interaction potential in the Etters model was obtained from a refitting of ab initio calculations to better match experimental data for the second virial coefficient and for condensed phases of \chN2. It is given by a Buckingham interaction at short distances, another Buckingham interaction at large distances, and a quartic spline fit at intermediate distances (see Table 1 and Ref. 28 for the parameters). This potential is less repulsive than the original ab-initio potential for an isolated pair of molecules: this softening was found to be necessary to accurately describe condensed phases.28
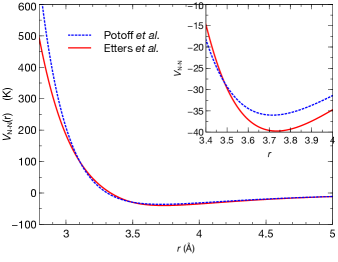
The nitrogen interaction potentials of Potoff et al. and of Etters et al. are compared in Fig. 1. The Etters potential is less repulsive at short distances and more attractive near the well’s minimum.
The \chN2-H2O interaction is particularly important in this work because it determines the available cage volume and the potential energy of the guest molecules inside the cages. van Klaveren et al. have shown that the preferred parallel orientation of two \chN2 molecules in a large cage is dictated by this interaction. In previous simulations on doubly-occupied \chN2 clathrates18, 19, 20, 21, the \chN-O interaction was described by a LJ potential, with parameters obtained via the Lorentz-Berthelot mixing rules. The LJ parameters used in Ref.19 originate for instance from Ref.30 where they were calculated by combining parameters of the SPC/E water model with those of a \chN-N interaction. The importance of deviations from LB mixing rules in the modelling of clathrates has been examined recently for various gases in the framework of the van der Waals-Platteuw model31, and also with Monte Carlo simulations in the case of argon hydrates32.
To refine the \chN-O interaction, we have considered the full potential energy surface of the dimer \chN2-H2O determined by Tulegenov et al.33. They have calculated energies for different intermolecular configurations with a post-Hartree-Fock method and have proposed a fit of the energy surface to a site-site interaction of the form
| (1) |
where are intermolecular site-site distances and where the orientation function introduces anisotropy into the atom-atom interactions. This fit holds when the intermolecular distance is smaller than 12 Bohr radius (a different fit was proposed for distances larger than ). Eq. (1) contains all contributions to the interaction energy: exchange-repulsion, dispersion and electrostatic energy, including induction energy. Since the proposed fit contains too many coefficients (564 in total) to be used in this form in our Monte Carlo simulations, we have deduced an average interaction potential by averaging over dimer configurations for a fixed distance between a \chN and \chO atom. In this calculation, the interaction (1) is first split into separate interactions with each of the two sites N1 and N2 of the nitrogen molecule. The interactions with the H1 and H2 sites are added to the \chN-O interaction, i.e. the sum over in eq. (1) is kept as is, to avoid picking up large electrostatic contributions. If the molecules were fully rigid and non-polarizable, all electrostatic contributions would cancel out in this averaging procedure when the two molecules are not touching each other (because the electrostatic potential outside a charged spherical shell is independent of its radius). The potential arises mainly from the exchange-repulsion and dispersion energies, but it does include also contributions from the induction energy. We have checked that the same average interaction is obtained, near the potential well minimum and also further away, when subtracting to the electrostatic interactions computed with the partial charges defined in the water and nitrogen molecular models.
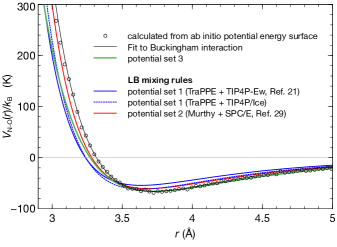
The potential that results from the previous averaging procedure is shown in Fig. 2. Fitting this potential to a Buckingham interaction
| (2) |
where , provides the parameters K, Å and . The potentials obtained by using the Lorentz-Berthelot mixing rules (blue and red curves in Fig. 2) are quite close to this potential . It is somewhat more repulsive at short distance, and more attractive at larger distances. The depth of the potential well is about 9% more attractive than the one in Refs. 30, 19 (red curve). The depth of the potential , deduced from the ab-initio potential energy surface for a dimer, should be accurate, but this potential is likely too repulsive at short distances when applied to a condensed phase, similarly to the case of the \chN-N interaction. We introduce therefore a softer potential (green curve in Fig. 2) by setting to 12.2, a value obtained by fitting the \chN-O potential of Ref. 22 (blue curve) to a Buckingham interaction. This provides the parameters listed in the first column of Table 2. The remaining columns show parameters used in previous studies: Ref. 22 for the case of potential 1 with TIP4P-Ew water and Refs.30, 19, 20, 21 for the case of potential 2.
Potential 3 2 1 This work Refs. 30, 19, 20, 21 TraPPE with TIP4P-Ew or -Ice Type Exp-6 LJ LJ (K) 66.2 60.74 54.30 / 61.80 (Å) 3.32 3.282 3.237 / 3.238 12.2 - -
The potentials sets 1, 2 and 3 involve the potentials 1, 2 and 3 for the \chN-O interactions, respectively. In the potential set 1, the \chN2-N2 interactions are given by the TraPPE force field, while they are given by the Etters model in the potential sets 2 and 3. No standard mixing rule exist for combining the parameters of the Etters model for \chN2 with those of a water model. In the potential sets 2 and 3, the \chN-O repulsion-dispersion interactions are those listed in Table 2 independently of the chosen water model. The potential set 2 differs from the potentials used in refs 19, 20, 21 only by the choice of the water model (SPC/E water was used in those references). The potential set 1, when combined with TIP4P-Ew water, coincides with the interaction potentials used in Ref 22.
2.2 Simulation details
The considered clathrate structures I and II are formed of 2×2×2 unit cells taken from Takeuchi et al.34; they are made up of 368 and 1088 water molecules, respectively. The total number of cages is thus 64 (for sI) and 192 (for sII). The GEMC simulations involved two cubic boxes. One box was initialized with an empty hydrate lattice, in a box with initial edge length 24.06 Å (for sI) or 34.62 Å (for sII); the other box was initialized with nitrogen molecules: 200 or 400 of them for simulations with the sI or sII, respectively. Periodic boundary conditions were applied separately to both boxes and the Ewald method was used to compute Coulomb interactions. The LJ and Buckingham interactions were calculated using a cutoff at 10 Å.
Within each Monte Carlo cycle, trial moves are attempted, where equals the total number of molecules (water and nitrogen) present in both boxes. The probabilities for the various MC moves were set as follows: 1% probability to attempt to change the volume of either the hydrate box or the \chN2 gas box (each having a 50% probability of being selected); 19% probability of attempting to transfer a nitrogen molecule from one box (chosen at random) to the other (no attempt was made to transfer a water molecule from one box to the other to avoid disrupting the clathrate structure); 40% probability of attempting to translate a randomly selected molecule; and, finally, 40% probability of attempting to rotate a randomly selected molecule. For the last 2 types of moves, water molecules were chosen more often than nitrogen molecules: probability 73.1% to select the species \chH2O versus 26.9% for \chN2. The maximum displacements (volume, translation, rotation) were updated periodically, each 50 MC cycles, to achieve an acceptance ratio of 50% for each type of move.
The open-source MCCS Towhee simulation program was modified to allow to calculate conveniently the individual large and small cage occupancies. This was done by writing into a specific file, whenever a nitrogen molecule would enter or leave the hydrate box, the coordinates of the molecule, the type of move (in or out), the number of MC steps since the start of the simulation and the current hydrate box length. An ad-hoc analysis script was then used to deduce from this file and from the initial positions of all molecules, the number of \chN2 molecules in each type of cages as function of the MC “time”. The simulations were run for 50,000 Monte Carlo cycles, giving a total of and MC steps for the simulations with sI and sII, respectively. The number of guest molecules inside the clathrate was found to have reached equilibrium after around Monte Carlo cycles. The uncertainties on the calculated cage occupancies are below 1%. Some additional simulations were run by starting from a fully occupied clathrate, with all large cages singly occupied () or doubly occupied (). The results were found to be identical after the equilibration period.
3 Results and discussion
The cage occupancies calculated from our GEMC simulations are compared with experimental data first for conditions where no double occupancy of cages has been observed experimentally (sections 3.1 and 3.2), and then for conditions where some large cages were found to be doubly occupied (section 3.3). The results presented in the next two sections pertain to the simulations of a flexible clathrate with sII with water-water interactions represented by the TIP4P-Ew water model. The results in the case of the TIP4P/Ice model will be discussed in section 3.3.
3.1 Occupancies at 200 bar
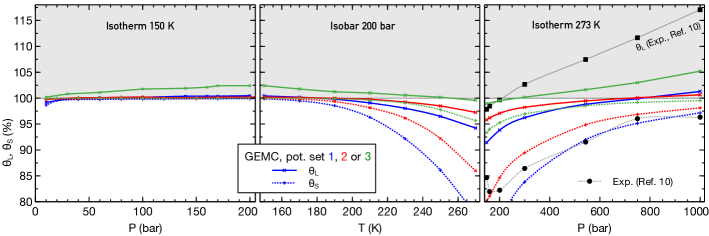
The results of our GEMC simulations along the isobar for a (flexible) clathrate with sII are shown in Fig. 3, together with experimental points for the cage occupancy ratio determined by Raman diffraction6 and with the separate occupancies % and % at determined by neutron diffraction 11.
The simulations predict a preferential filling of the large cages versus the small ones in the considered temperature range, in agreement with the experimental data.
The small cages become significantly less occupied when the temperature approaches the dissociation temperature. In that region, the predicted small cage occupancies depend quite strongly on the choice of the interaction potentials, making it difficult to obtain quantitatively accurate predictions, especially for . On another hand, this sensitivity makes the \chN2 hydrate a particularly interesting system for testing and refining the interactions potentials employed in the simulations. The \chN2-N2 interactions between molecules in different cages are almost identical when using the Etters and TraPPE force fields. As the cages are here only singly occupied, the sensitivity of the predicted cage occupancies arises from the \chN-O interactions. Cages are found to be more filled on average when switching from the potential set , despite the latter potential being more repulsive at short distances ( Å): the “affinity” for filling the cages is increased by the more attractive \chN-O interactions at larger distances. The increase in affinity is naturally more pronounced when switching from potential set , since the latter potential is even more attractive when Å.
The cage fillings depend, in a non-linear way, on the \chN-O repulsion at short distance, which determines the available cage volume, and on the binding energy at the minimum of the potential well, which determines the energetic attractiveness of a cage. The sensitivity to the binding energy can be understood by using the celebrated model of van der Waals-Platteuw35, which assumes rigid cages. In this model, the cage occupancies and are given by a Langmuir-type formula
| (3) |
with Langmuir constant for a cage of type (=small or large)
| (4) |
Here is the fugacity of the gas and is the potential energy of a guest molecule with orientation located at inside a cage of type . A small shift in the binding energy is demultiplied in the potential energy because it affects all interactions of the two \chN atoms with the nearby water molecules (small and large cages in a sII hydrate are made up of 20 and 28 water molecules, respectively). If the \chN-O interaction energies in a filled cage are all increased on average by , the Langmuir constant for a small cage will increase at by the factor .
The preferential filling of the large cages over the small ones can be understood on the basis of eq. (4) for the Langmuir constant. For a small molecules like \chN2 (diameter Å), the potential energy inside a small cage is lower, i.e. more binding, on average than in a large cage because of the smaller size of the cage (the small and large cages in sII have average diameters 7.82 and 9.46 Å, respectively). In the limit of low temperatures, the Langmuir constant for small cages will therefore be larger than the one for large cages (), leading to the small cages being more occupied than the large cages. As the temperature is increased, the factor in the ratio of Langmuir constants becomes less favorable to the small cages and the integration over the cage volume in eq. (4) favors the large cages. In other words, a small molecule like \chN2 will prefer the small cages at low temperature because it minimizes the energy of the system (the entropy plays no role at sufficiently low temperature), whereas it will prefer the large cages at higher temperatures because it increases the entropy of the system, the equilibrium macroscopic state being the one that minimizes the free energy . A preferential filling of small cages has indeed been observed in simulations at low temperatures 22.
It is interesting to note that the large cages are almost fully occupied along the isobar 200 bar according to our simulations. The Raman spectroscopy measurements of the ratio inform us therefore here directly on the occupancy of the small cages. A partial double occupancy of the large cages at low temperatures along this isobar cannot however be excluded, as discussed in Sct. 3.3.
At , there is a quite large difference between the neutron diffraction data of Ref. 11 (whose uncertainty is of the order of the symbol size) and the Raman spectroscopy data of Ref. 6. The data of Ref. 11 pertains to a deuterated clathrate, but it is known that deuteration has a negligible impact on the cage occupancies, as established in Ref. 13. Due to the sensitivity of the calculated occupancies on the choice of the interaction potentials, this experimental discrepancy cannot be fully lifted from our GEMC simulations at 200 bar. However, in view of the occupancies predicted when using the TIP4P/Ice model and of comparisons along isotherm 273 K (see Sct. 3.3), and also because we expect the potential set 3 to be more accurate, the simulations appear to agree better with the lower value of measured in Ref. 11.
3.2 Occupancies at 150 K
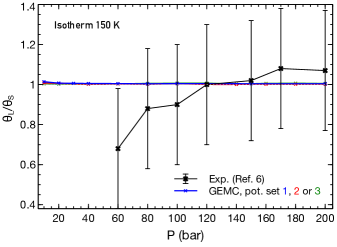
Occupancy ratios along the isotherm have been determined by Raman spectroscopy. Fig. 4 shows a comparison between our GEMC simulations and the corresponding experimental data6. The simulations indicate that all cages are fully (and singly) occupied. This can be understood as being due to the quite low temperature and to pressures that are significantly higher than the dissociation pressure bar (this value is estimated by interpolating the data of Ref. 36). A slight preferential filling of the large cages can be seen in our simulations for pressures below . This agrees with an extrapolation of the isotherm calculated, for pressures , by GCMC in Ref. 22. It agrees also with the prediction at 150 K and 60 bar obtained by using eq. (3) with the Langmuir constants for \chN2 of Ref. 36. The present prediction of a fully occupied clathrate is not sensitive to details of the interaction potentials. Taking into account the rather large error bars of the experimental points, they are compatible with our theoretical prediction .
As explained in the previous section, a tendency for the small cages to be more occupied than the large cages, like in the experimental dataset for , is expected at low temperatures. From the simulations of Ref. 22, the transition from to is expected to occur at around . Even with such an “inversion” of the Langmuir constants, the cages are still expected to be fully occupied at the considered pressures, which are much larger than the dissociation pressure (this can be confirmed by extrapolating to higher pressures the simulation data at , and of Ref. 22). An increase of the ratio with increasing pressures could be due to some large cages encaging two molecules, as further detailed in the next section.
3.3 Double occupancy
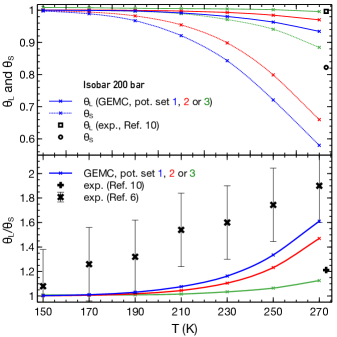
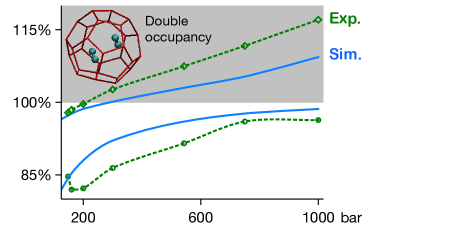
A comparison between simulation and experimental results for the cage occupancies along isotherm 273 K, from 148 bar up to the high pressure 1000 bar, is shown in Fig. 5. The potential sets 1 and 2 underestimate the large and small cage occupancies. They fail moreover to predict that some large cages in a \chN2 clathrate are doubly occupied at high pressures, whereas the experimental evidence for this phenomenon is strong11, 12, 13. The new potential set 3, introduced in Sct. 2.1 by averaging an ab-initio potential energy surface, does lead to a better qualitative agreement with the experimental data: a sizable proportion of doubly occupied large cages can now be observed in those simulations at pressures above .
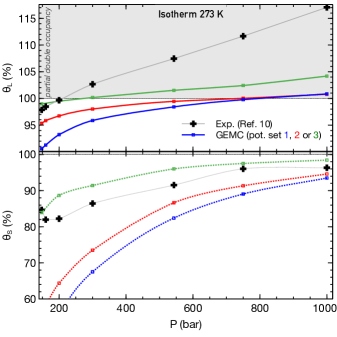
The occupancy of a cage is sensitive to four energetic contributions: (i) the interaction energy of the guest with the surrounding water molecules, which determines the potential energy of a guest inside a cage and the available cage volume (ii) the change in water-water interaction energy upon insertion of a guest molecule (this change is due to deformations of the water network), (iii) the interaction energy between guest molecules in different cages, and (iv) the interaction energy between a guest molecule and the other guest(s) within the same cage if it is multiply occupied. Predicting correctly multiple occupancy is more difficult than single occupancy because it is determined by a more delicate energetic balance. When inserting a second \chN2 molecule in a cage, the attractive energy contribution (i) remains similar than for single occupancy, but the repulsive energy (ii) becomes larger and the new repulsive energy (iv) enters into the balance.
The model of a rigid clathrate, which is employed in the van der Waals-Platteuw model35, neglects the energy cost (ii) and the fluctuations of the cage framework due to the finite temperature. Fig. 7 shows the calculated cage occupancies in simulations of a rigid \chN2 clathrate. In these simulations, only the nitrogen molecules can move, the water molecules are kept fixed in a perfect crystalline arrangement (no volume change of the clathrate box is furthermore attempted). The cages are found to be more occupied in the rigid clathrate approximation, similarly to the case of methane hydrates37, 14. Remarkably, the simulations with a rigid clathrate predict, when using our potential set 3, a sizable amount of doubly occupied large cages not only at high pressures along the isotherm , but also at moderate pressures along the isotherm and at low temperatures along the isobar . The simulations for the rigid model indicate thus that the large cages in a \chN2 hydrate could be doubly occupied under the latter conditions. Interestingly, this occurence of double occupancy could explain the increase of the ratio with pressure seen at in Ref 6 (see Fig. 4).
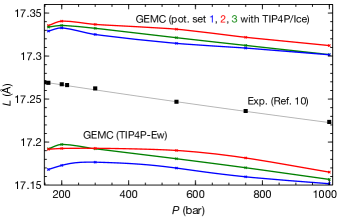
To check the sensitivity of the results on the model for water-water interactions, we have performed also simulations with the TIP4P/Ice water model26. As shown in Fig. 8, the occupancies calculated in a flexible clathrate when using with TIP4P/Ice model are higher than when using the TIP4P-Ew model. This could be due to the cage framework being more rigid when modelled with TIP4P/Ice because this model features stronger water-water interactions (12% higher partial charges on the interaction sites and 30% higher binding energy for the \chO site – \chO site interaction). Fig. 6 shows the lattice constant along isotherm 273 K in our simulations, for the two considered water models. The lattice constant is somewhat too small when using TIP4P-Ew, whereas it is somewhat too large when using TIP4P/Ice. The lattice spacing decreases with increasing pressure almost linearly, as in the experimental data, except at low pressures where the simulations show a small increase of with pressure when is small. This can be attributed to an expansion of the clathrate caused by an increased filling of the cages, which more than compensates the mechanical compression.
By opposition to our previous calculations with the TIP4P-Ew model, the cage occupancies are lowered when switching from potential sets when using the TIP4P/Ice model. This is due to the use of the Lorentz-Berthelot mixing rules in the potential set 1: the binding energy is higher when associating the TraPPE force field with the TIP4P/Ice model than with the TIP4P-Ew model (see Table 2). The fact that both and are underestimated along the isotherm 273 K, whereas the potentiel set 1 provides a better agreement, especially for , confirms our finding from Sct. 2.1 that the binding energy associated with the combination of the TraPPE force field with the TIP4P-Ew model is too low.
The potential sets 1 and 2 associated with TIP4P/Ice water predict a non-negligible proportion of doubly occupied large cages at 273 K and 1000 bar, but the magnitude of this multiple occupancy is largely underestimated. With the potential set 3, the occupancy of the large cages is in much better agreement with the experimental data, and predicts correctly that multiple occupancy starts at 300 bar. The occupancy of the small cages is somewhat overestimated (by about 10% at 300 bar). Interestingly, the simulations with the TIP4P/Ice model predict, as expected from the rigid clathrate simulations (Fig. 7), that some large cages are doubly occupied at and . As the double-occupancy Raman signature could not be disentangled in the experiments of Ref. 6, a verification of this prediction via a neutron diffraction experimental would be useful to further confirm the ability of GEMC simulations with the potential set 3 to correctly describe the doubly occupancy effect.
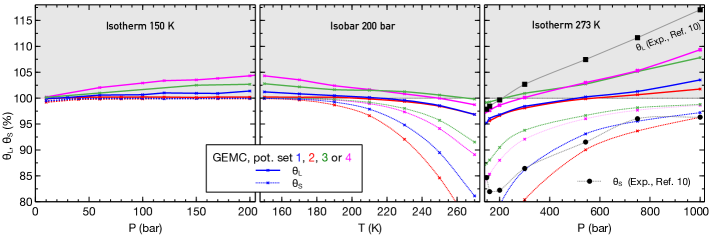
Eventually, we note that a further refinement of the parameters for the \chN-O interactions can be performed to improve the agreement with the experiments at 273 K. A Buckingham potential with parameters , and (i.e. an interaction that is more attractive at short distances and more repulsive at large distance than the potential 3) provides a slightly better agreement along isotherm 273 K (see magenta curve labelled “Pot. set 4” in Fig. 8). It predicts also a higher proportional of doubly occupied cages at 200 bar and 150 K.
4 Conclusions
We have compared the predictions of Gibbs ensemble Monte Carlo simulations with experimental data for the cage occupancies in \chN2 hydrates to assess the accuracy of such simulations, to refine the effective \chN-O interaction potential beyond the common Lorentz-Berthlot mixing rules, and to help interpret cage occupancy ratios that have been recently measured by Raman spectroscopy. Different sets of interaction potentials for \chN2-N2, \chN2-H2O and \chH2O-H2O interactions have been considered.
The predicted cage fillings are sensitive to the choice of the interaction potentials when the filling differs significantly from 100%. This renders accurate predictions difficult, but allows for instructive comparisons with experiments to refine the effective potentials employed. Among the considered sets of interaction potentials, some of them are not able to reproduce the known experimental fact that some large cages are doubly occupied at 273 K and high pressures.
We have found, both from comparisons with experimental data and from an analysis for an ab-initio \chN2-H2O potential energy surface, that the binding energy at the bottom of the potential well for the \chN-O interaction is not attractive enough when combining the TraPPE force field for \chN2 with the TIP4P-Ew model for water. The \chN-O interaction potential 2 (see Table 2) is more binding, but it is too repulsive at short distances for the large cages to become doubly occupied. By averaging an ab-initio potential energy surface of \chN2-H2O, we have introduced a new effective Buckingham potential for \chN-O interactions. That interaction leads to more accurate predictions for the cage occupancies, especially for the large cages. The simulations with the TIP4P/Ice water model appear to agree somewhat better with experiments than those with the TIP4P-Ew water as far as cage occupancies are concerned. Additional theoretical works on the interactions involved in \chN2 hydrates would naturally be useful to further improve the accuracy of GEMC simulations for this system.
Some experimental points for the same conditions but from different experiments do not agree well with each other (for instance the points of Ref. 11 and Ref. 6 at 200 bar and K, see Fig. 3). The simulations with the TIP4P/Ice water model (and those within the rigid clathrate model) show that some large cages can be doubly occupied at 150 K and 200 bar. This double occupancy effect could explain the increase of the ratio measured in Ref. 6 (see Figs. 4 and 8). An experimental confirmation with a separate measurement of and under these conditions would be useful. Experimental values for cage occupancies are most instructive in regimes where the small and/or the large cage occupancies deviate significantly from 100%, i.e. close to the dissociation pressure (low occupancy) or under conditions where some large cages are doubly occupied (high pressures or intermediate pressure and low temperatures). Such measurements provide stringent tests for the simulations and enable refinements of the employed effective potentials.
This paper falls in the frame of the MI2C project funded by the French “Agence Nationale de la Recherche” (project ANR-15CE29-0016). The calculations were run on computers of the Institute UTINAM of the University de Franche-Comté, supported by the Région Franche-Comté and the Institut des Sciences de l’Univers (INSU), and also on the supercomputer facilities of the Mésocentre de calcul de Franche-Comté.
References
- Sloan and Koh 2007 Sloan, E. D.; Koh, C. A. Clathrate Hydrates of Natural Gases; CRC Press, 3rd ed., 2007
- Ohgaki et al. 1994 Ohgaki, K.; Takano, K.; Moritoki, M. Exploitation of CH4 hydrates under the Nankai Trough in combination with CO2 storage. Kagaku Kogaku Ronbunshu 1994, 20, 121–123
- Park et al. 2006 Park, Y.; Kim, D. Y.; Lee, J. W.; Huh, D. G.; Park, K. P.; Lee, J.; Lee, H. Sequestering carbon dioxide into complex structures of naturally occurring gas hydrates. Proc. Natl. Acad. Sci. U.S.A. 2006, 103, 12690–12694
- Thomas et al. 2008 Thomas, C.; Picaud, S.; Mousis, O.; Ballenegger, V. A theoretical investigation into the trapping of noble gases by clathrates on Titan. Planetary and Space Science 2008, 56, 1607–1617
- Mousis et al. 2010 Mousis, O.; Lunine, J. I.; Picaud, S.; Cordier, D. Volatile inventories in clathrate hydrates formed in the primordial nebula. Faraday Discuss. 2010, 147, 509–525
- Petuya et al. 2018 Petuya, C.; Damay, F.; Chazallon, B.; Bruneel, J.-L.; Desmedt, A. Guest Partitioning and Metastability of the Nitrogen Gas Hydrate. J. Phys. Chem. C 2018, 122, 566–573
- Loveday et al. 2003 Loveday, J. S.; Nelmes, R. J.; Klug, D. D.; Tse, J. S.; Desgreniers, S. Structural systematics in the clathrate hydrates under pressure. Can. J. Phys. 2003, 81, 539–544
- Sasaki et al. 2003 Sasaki, S.; Hori, S.; Kume, T.; Shiumizu, H. Microscopic observation and in situ Raman scattering studies on high-pressure phase transformations of a synthetic nitrogen hydrate. J. Chem. Phys. 2003, 118, 7892
- Brumby et al. 2019 Brumby, P. E.; Yuhara, D.; Hasegawa, T.; Wu, D. T.; Sum, A.; Yasuoka, K. Cage occupancies, lattice constants, and guest chemical potentials for structure II hydrogen clathrate hydrate from Gibbs ensemble Monte Carlo simulations. J. Chem. Phys. 2019, 150, 134503
- Lasich et al. 2014 Lasich, M.; Mohammadi, A. H.; Bolton, K.; Vrabec, J.; Ramjugernath, D. Phase equilibria of methane clathrate hydrates from Grand Canonical Monte Carlo simulations. Fluid Phase Equilibria 2014, 369, 47–54
- Chazallon and Kuhs 2002 Chazallon, B.; Kuhs, W. F. In situ structural properties of \chN2-, \chO2-, and air-clathrates by neutron diffraction. J. Chem. Phys. 2002, 117, 308–320
- Qin and Kuhs 2015 Qin, J.; Kuhs, W. F. Calibration of Raman Quantification Factors of Guest Molecules in Gas Hydrates and Their Application to Gas Exchange Processes Involving \chN2. J. Chem. Eng. Data 2015, 60, 369–375
- Hansen et al. 2016 Hansen, T. C.; Falenty, A.; Kuhs, W. F. Lattice constants and expansivities of gas hydrates from 10 K up to the stability limit. J. Chem. Phys. 2016, 144, 054301
- Henley and Lucia 2015 Henley, H.; Lucia, A. Constant pressure Gibbs ensemble Monte Carlo simulations for the prediction of structure I gas hydrate occupancy. Journal of Natural Gas Science and Engineering 2015, 26, 446–452
- Papadimitriou et al. 2016 Papadimitriou, M. I.; Tsimpanogiannis, I. N.; Economou, I. G.; Stubos, A. K. Storage of Methane in Clathrate Hydrates: Monte Carlo Simulations of sI Hydrates and Comparison with Experimental Measurements. J. Chem. Eng. Data 2016, 61, 2886–2896
- Brumby et al. 2016 Brumby, P. E.; Yuhara, D.; Wu, D. T.; Sum, A. K.; Yasuoka, K. Cage occupancy of methane hydrates from Gibbs ensemble Monte Carlo simulations. Fluid Phase Equilibria 2016, 413, 242–248
- Horikawa et al. 1997 Horikawa, S.; Itoh, H.; Tabata, J.; Kawamura, K.; Hondoh, T. Dynamic Behavior of Diatomic Guest Molecules in Clathrate Hydrate Structure II. J. Phys. Chem. B 1997, 101, 6290–6292
- Klapproth et al. 1999 Klapproth, A.; Chazallon, B.; Kuhs, W. F. Monte-Carlo sorption and neutron diffraction study of the filling isotherm in clathrate hydrates. Neutrons and Numerical Methods. 1999; pp 70–73
- van Klaveren et al. 2001 van Klaveren, E. P.; Michels, J. P. J.; Schouten, J. A.; Klug, D. D.; Tse, J. S. Stability of doubly occupied N 2 clathrate hydrates investigated by molecular dynamics simulations. J. Chem. Phys. 2001, 114, 5745
- van Klaveren et al. 2001 van Klaveren, E. P.; Michels, J. P. J.; Schouten, J. A.; Klug, D. D.; Tse, J. S. Molecular dynamics simulation study of the properties of doubly occupied N 2 clathrate hydrates. J. Chem. Phys. 2001, 115, 10500
- van Klaveren et al. 2002 van Klaveren, E. P.; Michels, J. P. J.; Schouten, J. A.; Klug, D. D.; Tse, J. S. Computer simulations of the dynamics of doubly occupied N 2 clathrate hydrates. J. Chem. Phys. 2002, 117, 6637
- Patt et al. 2018 Patt, A.; Simon, J.-M.; Picaud, S.; Salazar, J. M. A Grand Canonical Monte Carlo Study of the N2, CO, and Mixed N2-CO Clathrate Hydrates. J. Phys. Chem. C 2018, 122, 18432–18444
- Martin 2013 Martin, M. G. MCCCS Towhee: a tool for Monte Carlo molecular simulation. Mol. Sim. 2013, 39, 1212–1222
- Purton et al. 2013 Purton, J. A.; Crabtree, J. C.; Parker, S. C. DL_MONTE: a general purpose program for parallel Monte Carlo simulation. Mol. Sim. 2013, 39, 1240–1252
- Horn et al. 2004 Horn, H. W.; Swope, W. C.; Pitera, J. W.; Madura, J. D.; Dick, T. J.; Hura, G. L.; Head-Gordon, T. Development of an Improved Four-Site Water Model for Biomolecular Simulations: TIP4P-Ew. J. Chem. Phys. 2004, 120, 9665–9678
- Abascal et al. 2005 Abascal, L. F.; Sanz, E.; Fernández, R. G.; Vega, C. A potential model for the study of ices and amorphous water: TIP4P/Ice. J. Chem. Phys. 2005, 122, 234511
- Potoff and Siepmann 2001 Potoff, J. J.; Siepmann, J. I. Vapor Liquid Equilibria of Mixtures Containing Alkanes, Carbon Dioxide, and Nitrogen. AIChE J. 2001, 47, 1676–1682
- Etters et al. 1986 Etters, R. D.; Chandrasekharan, V.; Uzan, E.; Kobashi, K. High-pressure static and dynamic properties of the R3c phase of solid nitrogen. Phys. Rev. B 1986, 33, 8615
- Murthy et al. 1983 Murthy, C. S.; O’Shea, S. F.; McDonald, I. R. Electrostatic interactions in molecular crystals: Lattice dynamics of solid nitrogen and carbon dioxide. Mol. Phys. 1983, 50, 531–541
- Somasundaram et al. 1999 Somasundaram, T.; Lynden-Bell, R. M.; Patterson, C. H. The passage of gases through the liquid water/vapour interface: a simulation study. Phys. Chem. Chem. Phys. 1999, 1, 143–148
- Tsimpanogiannis et al. 2014 Tsimpanogiannis, I. N.; Diamantonis, N. I.; Economou, I. G.; Papadimitriou, N. I.; Stubos, A. K. Influence of combining rules on the cavity occupancy of clathrate hydrates using van der Waals-Platteuw-theory-based modelling. Chem. Eng. Res. and Des. 2014, 92, 2992–3007
- Papadimitriou et al. 2014 Papadimitriou, N. I.; Tsimpanogiannis, I. N.; Economou, I. G.; Stubos, A. K. Influence of combining rules on the cavity occupancy of clathrate hydrates by Monte Carlo simulations. Mol. Phys. 2014, 112, 2258–2274
- Tulegenov et al. 2007 Tulegenov, A. S.; Wheatley, R. J.; Hodges, M. P.; Harvey, A. H. Intermolecular potential and second virial coefficient of the water-nitrogen complex. J. Chem. Phys. 2007, 126, 094305
- Takeuchi et al. 2013 Takeuchi, F.; Hiratsuka, M.; Ohmura, R.; Alavi, S.; Sum, A. K.; Yasuoka, K. Water Proton Configurations in Structures I, II, and H Clathrate Hydrate Unit Cells. J. Chem. Phys. 2013, 138, 124504
- van der Waals and Platteuw 1959 van der Waals, J. H.; Platteuw, J. C. Clathrate solutions. Adv. Chem. Phys. 1959, 2, 1
- Yoon et al. 2006 Yoon, J.-H.; Kawamura, T.; Ohtake, M.; Takeya, S.; Komai, T.; Yamamoto, Y.; Emi, H.; Kohara, M.; Tanaka, S.; Takano, O. et al. Highly Selective Encaging of Carbon Dioxide Molecules in the Mixed Carbon Dioxide and Nitrogen Hydrate at Low Temperatures. J. Phys. Chem. B 2006, 110, 17595–17599
- Wierzchowski and Monson 2007 Wierzchowski, S. J.; Monson, P. A. Calculation of Free Energies and Chemical Potentials for Gas Hydrates Using Monte Carlo Simulations. J. Phys. Chem. B 2007, 111, 7274–7282
Graphical TOC entry
Doubly occupied large cages in a \chN2 clathrate hydrate