Minimalistic Explanations: Capturing the Essence of Decisions
Abstract.
The use of complex machine learning models can make systems opaque to users. Machine learning research proposes the use of post-hoc explanations. However, it is unclear if they give users insights into otherwise uninterpretable models. One minimalistic way of explaining image classifications by a deep neural network is to show only the areas that were decisive for the assignment of a label. In a pilot study, 20 participants looked at 14 of such explanations generated either by a human or the LIME algorithm. For explanations of correct decisions, they identified the explained object with significantly higher accuracy ( vs. ). We argue that this shows that explanations can be very minimalistic while retaining the essence of a decision, but the decision-making contexts that can be conveyed in this manner is limited. Finally, we found that explanations are unique to the explainer and human-generated explanations were assigned higher trust ratings. As a starting point for further studies, this work shares our first insights into quality criteria of post-hoc explanations.
1. Introduction
The impact of machine learning on our society is growing as it is becoming an integral part of many computer programs. Unfortunately, systems like deep neural networks that have significantly promoted the revival of machine learning research are inherently uninterpretable due to their sub-symbolic nature. Hence researchers are faced with a fundamental technical barrier to transparency as they have limited understanding of what these systems are learning and are unable to prove that they will work on unseen problems (Lipton, 2018). Nevertheless, transparency and explainability are an integral component of ethically aligned design (The IEEE Global Initiative on Ethics of Autonomous and Intelligent Systems, 2017; Council, 2017). Consequently, interpretable machine learning research has seen a surge in interest and publications with two main streams of research: The first suggest new “simpler” models that are mathematically more interpretable yet exhibit comparable performance to uninterpretable models. The second seeks to explain black-box model predictions with post-hoc explanations without uncovering the mechanism behind them (Lipton, 2018). The running hypothesis that motivates such research is that displaying explanations can help novice and expert users to develop trust into a model (Ribeiro et al., 2016).
However, there is minimal consensus on a definition for interpretability (Doshi-Velez and Kim, 2017; Lipton, 2018) and scholars have argued that research in this field needs to build more strongly on research on explanation in philosophy, psychology and cognitive science (Miller, 2019). Furthermore, human factors and real-world usability aspects are often neglected when new approaches are proposed, which may be because current interpretable machine learning research is relatively isolated from HCI research (Abdul et al., 2018).
However, interaction with intelligent systems and agents is a traditional field of HCI. For example, Kulesza et al. (Kulesza et al., 2015) introduced Explanatory Debugging Systems that explain their decisions and incorporate user feedback, which was shown to lead to better predictions, sounder mental models and higher user satisfaction. Since their implementation has been limited to simple Naïve Bayes classifiers, these principles and findings may not translate to complex deep learning models. More recent work from our community includes work by Binns et al. (Binns et al., 2018) studying how different presentation styles of explanation influence justice perception or work by Rader et al. (Rader et al., 2018) studying how explanations of the Facebook news feed algorithm influence the beliefs and judgments.
In this work, we add to this body of research by investigating if minimalistic post-hoc explanations can capture the essence of a decision and if they align with human intuition.
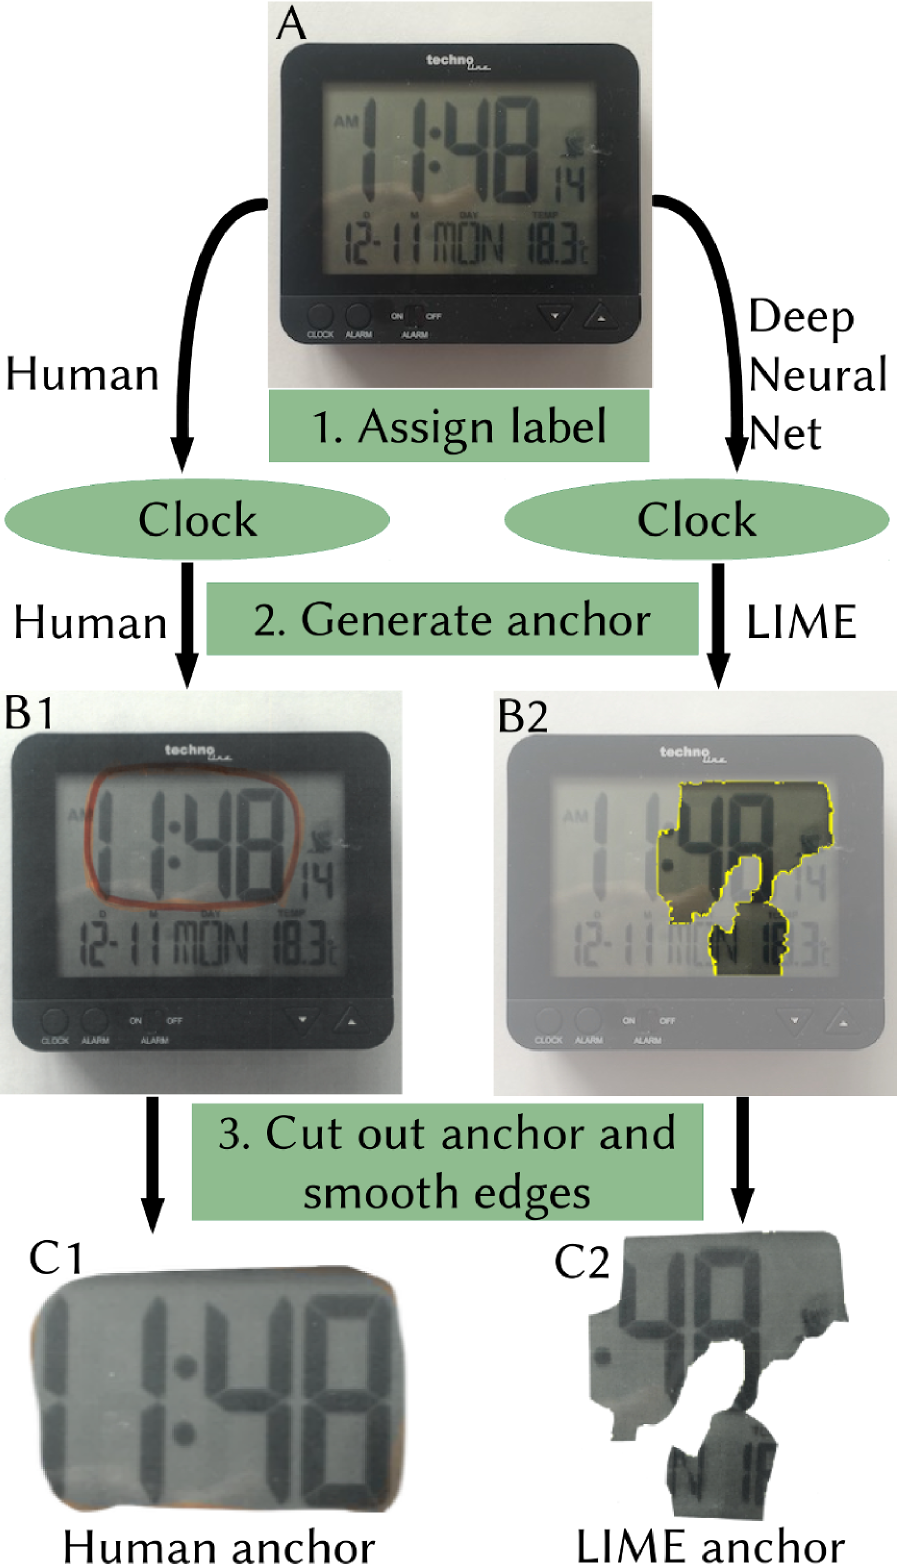
An infographic illustrating how anchors where generated. The illustration uses the photo of a digital watch as an example. This photo is shown at the top. From there the illustration splits between a left-hand side and a right-hand side. On the left-hand side, the anchors are generated with humans. On the right-hand side, anchors are generated with algorithms. Both procedures go through three steps. The first step is the assignment of a label to the image. The second step is the generation of the anchor. The third step is the cutting of the anchor and the smoothening of the anchor’s edges. On the left side, in the first step, the photo is shown to a human who assigns the label “clock” to it. On the right-hand side, the image is fed into a deep neural network assigning the same label. In the next step, the anchor generation step, a human has used a red pen to circle a region on the picture of the clock. In this case, the human had decided to circle the large digital numbers shown by the clock display. On the right-hand side, the anchor was generated using the LIME algorithm. The algorithm calculated which regions where most influential for the assignment of the label ”clock”. The region is quite different from the one the human selected. The shape is hard to describe but I will try my best. Imagine the shape of Southern Europe from Paris to Croatia. This shape is mapped to the digital clock in such that it covers the digital letters showing the seconds. From there it spans further downwards and Sicily is located above some smaller digital numbers which indicate the date. However, besides these minor differences, the overall most notable difference of these two images is that the human selection is a smooth oval shape whereas the LIME selection has many rough and pointy edges like the shores of the Mediterranean sea. In the final step, these edges are normalized which means that the human selection becomes a bit more pointy and the region LIME selected becomes smoother.
2. Method
A “full” explanation of a complex model is often not feasible or even understandable for humans, which is why explanations need to be selective in the causes they present (Miller, 2019). For the machine learning task of image classification where an image is assigned one of several possible labels, anchors are one possible way of providing such minimalistic explanations. An anchor is the reduction of the input image to the regions that supported the assignment of a label. In our pilot study, we compared algorithmically generated anchors to the gold standard of human explanations. For this purpose, we photographed several everyday objects and generated anchors for them algorithmically and manually.
2.1. Algorithmically Generated Anchors
To generate anchors algorithmically we used the Keras framework (Chollet et al., 2015) with tensorflow (Abadi et al., 2015). We predicted a label for each photo using the Inception v3 model (Szegedy et al., 2015) trained with the 1000 class ImageNet training data (Figure 1 - Step 1). For the post-hoc explanation method, we restricted our experiment to local interpretable model-agnostic explanations, generated with the LIME algorithm. This algorithm was developed by Ribeiro et al. (Ribeiro et al., 2016) in 2016. In a user study, they also demonstrated its ability to support users in identifying generalisation error and skewed datasets.

An infographic showing a person looking at 4 digits on a grey oval background. The digits read 11:48. Note that this is the anchor another human selected as illustrated in Figure 1. Speech bubbles above the person illustrate how he or she answers the question in the first stage of the experiment. The first bubble reads “That’s a clock”. The second bubble reads “It was not difficult to identify”. Below this utterance is a 5-point Likert Scale where the first box has been crossed. The third bubble reads “I think the anchor was generated by a machine”
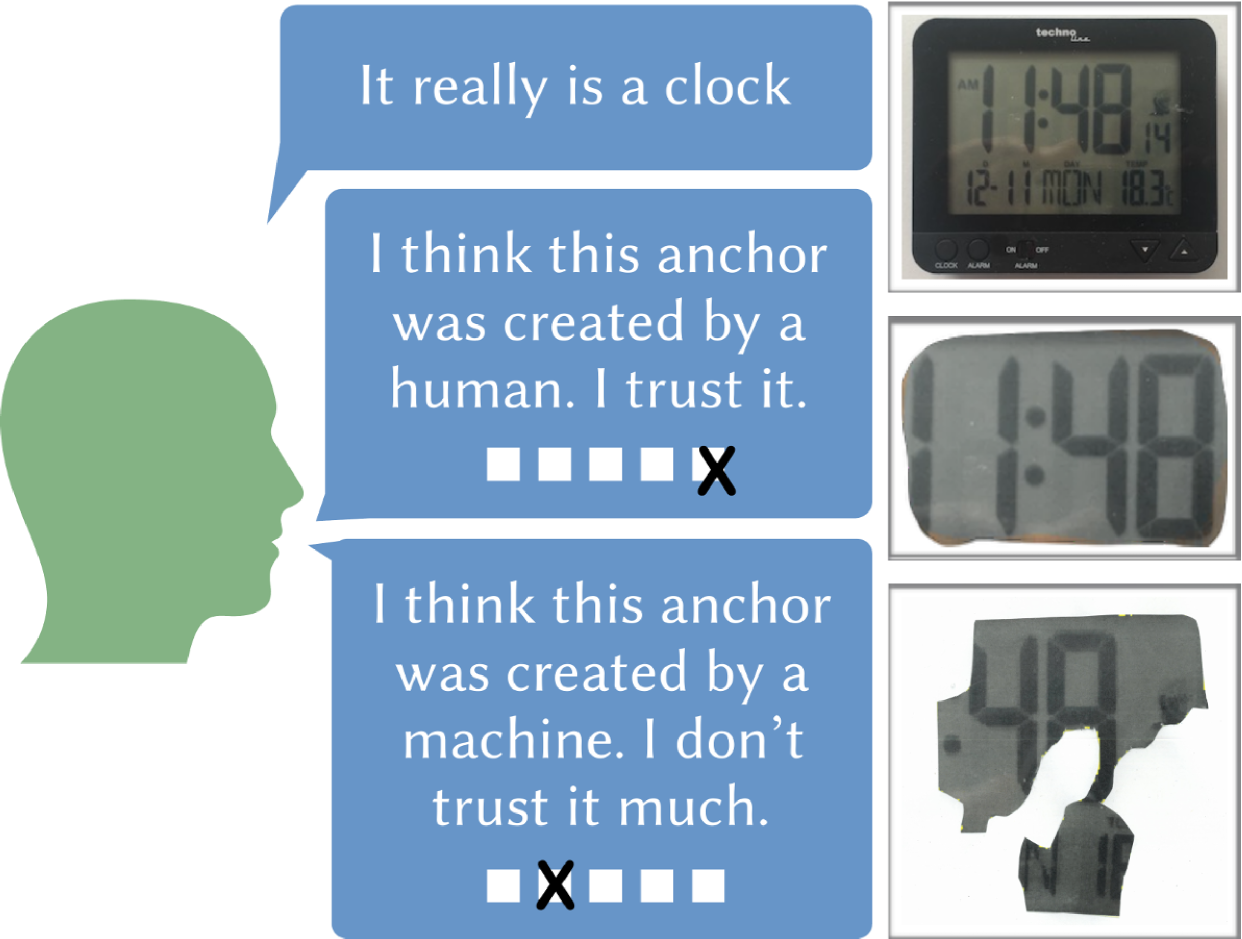
An infographic showing a person looking at three images. The first image is the original photo of the digital watch. About this image, the person is thinking “It really is a clock”. The second image is the anchor generated by a human which was described in Figure 1. About this image the person is thinking: “I think this anchor was created by a human. I trust it.” A Likert scale below has been marked with the highest rating. The third image is the anchor generated by the LIME algorithm which was also described in Figure 1. About this image the person is thinking: “I think this anchor was created by a machine. I don’t trust it much.” A Likert scale below has been marked with a trust rating of two.
For a decision, LIME creates a sparse, linear model with super-pixels as input. The resulting model is interpretable for two reasons: Firstly, the domain of is a super-pixel representation of the image, which is meaningful for a human. Secondly, the sparsity constraint enforces that just a few of all super-pixels contribute to the classification by , creating a very selective model. The anchor is obtained by reducing the input image to pixels that supported the decision (Figure 1 - Section B2). Anchors generated in this fashion can exhibit some rough edges which we smoothed manually. It is important to note here that different model architectures (e.g., vgg16) produce different anchors and how the architecture influences the anchors is an open research question.
2.2. Manually Generated Anchors
We showed photos of seven everyday objects to four volunteers recruited within our institute and asked them to assign a label to the image (Figure 1 - Step 1). Next, we instructed them to mark up regions of the image that they considered most relevant for their decision (Figure 1 - Step 2). If in doubt explainers were instructed to consider what regions they considered essential in such a way that their removal would make it much harder to identify the object. Finally, their selections were cut out from paper and glued back to paper smoothing the edges if necessary. Once we had created a couple of anchors in this fashion, they appeared to be considerably different from the algorithmically generated ones.
2.3. Study Design
If anchors are selective in a human-understandable way, they should reduce an image to the essential parts. If this is the case, humans should be able to identify the object for which an anchor was generated if the anchor was generated for the correct object label. We hosted a pilot study with twenty participants, researchers from multiple disciplines, at the Weizenbaum Institute. In the first half participants were individually presented with seven anchors of the seven objects, randomly either algorithmically or manually created. In a questionnaire, they were asked to identify the object outlined by the anchor, give a difficulty rating for this task (five-point Likert scale) and select whether they think the anchor was generated by a human or by an algorithm (Figure 2). In the second part, we showed participants the original images of the object along with the anchors they had already seen and the ones they had not seen. Hence a manually and an algorithmically generated anchor were on display for each object. We also marked the anchors that explained a wrong label. In the questionnaire, we asked participants once again to determine for each anchor if a human or an algorithm generated it. Lastly, assuming the anchor had been generated by an algorithm they were asked to rate the likelihood that they trusted the underlying classifier to classify objects of the same type correctly in the future (Figure 3).
3. Results
 \Description
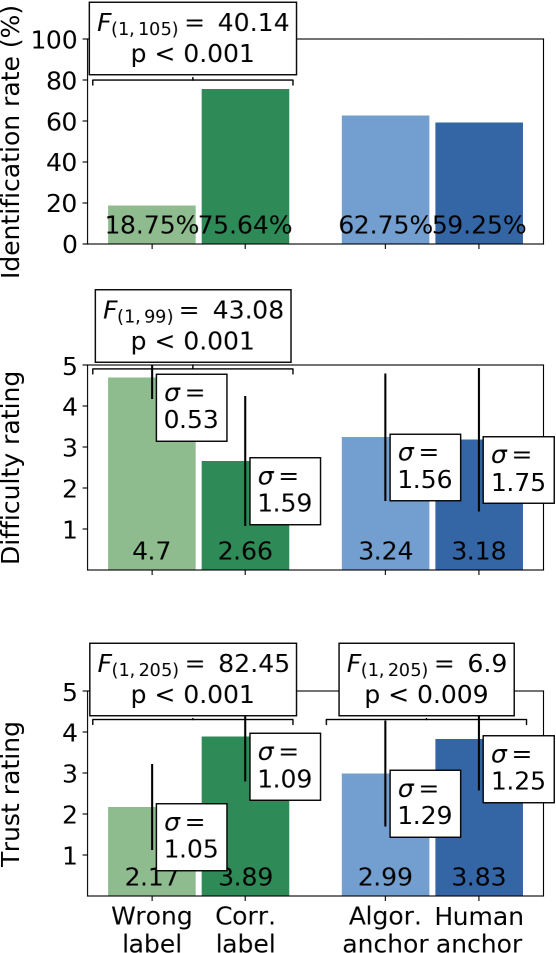
Study results in grouped bar charts. In total there are three charts. Each is showing four bars. The first two bars always compare the two conditions “wrong label” and “correct label”. The last two bars always compare the condition “algorithmically generated anchor” and “human anchor”. The first bar chart shows the Identification rate in percent. For the wrong label condition, it is 18.75 percent. For the “correct label” condition, it is 75.64 percent. A significant effect exists between the two conditions with F equals 40.14 p smaller than 0.001. For the “algorithmically generated anchor” condition the value is 62.75 percent and for the “human anchor” condition it is 59.25 percent. There is no effect. The second bar chart shows difficulty rating on a scale from zero to five. For the wrong label condition, it is 4.7 and the standard derivation is 0.53. For the “correct label” condition it is 2.66 and the standard derivation is 1.59. A significant effect exists between the two conditions with F equals 43.08 and p smaller than 0.001. For the “algorithmically generated anchor” condition the rating is 3.24 with a standard derivation of 1.56. The rating for the “human anchor” condition is 3.18 with a standard derivation of 1.75. There is no effect. The third and last bar chart shows trust ratings on a scale from zero to five. For the wrong label condition, it is 1.05 and the standard derivation is 1.05. For the “correct label” condition it is 3.89 and the standard derivation is 1.09. A significant effect exists between the two conditions with F equals 82.45 and p smaller than 0.001. For the “algorithmically generated anchor” condition the rating is 2.99 with a standard derivation of 1.29. The rating for the “human anchor” condition is 3.83 with a standard derivation of 1.25. A significant effect exists between the two conditions with F equals 6.9 and p smaller than 0.009.
Fifteen out of twenty participants submitted their questionnaire which was optional. We analysed the data using two-way repeated measurement ANOVAs and report only significant results in this short work. As shown in Figure 4 the recognition rate was significantly lower for explanations that explained the wrong label ( vs. ; ). Similarly, the difficulty rate was significantly higher ( vs. ; ). In the first part of the experiment participants were able to distinguish between algorithmically and manually generated anchors with an average accuracy of which increased to in the second part where anchors where displayed pairwise along with the original image. If an anchor explained an incorrect label, trust ratings were significantly lower as when it explained the correct label ( vs. ; ) and participants trusted manually generated explanations significantly more than algorithmically generated ones ( vs. ; ).
4. Discussion
In our pilot study participants were able to identify the original object more accurately and with more ease when an anchor explained the right label. Hence, in most cases, anchors seemed to reduce images to their essential parts for a given label while being very selective. Nevertheless, an identification rate of is still leaving room for improvement. In future studies, we plan to allow participants to reveal additional regions interactively, which could identify important regions that had been left out by the explainer. Such feedback data could be used to improve or debug the classifier.
We also found that explanations were unique to the explainer (human subject or machine learning model respectively) and therefore considerably different from one another (i.e., anchors C1 and C2 in Figure 1). Hence it was easy for participants to distinguish between them once they were displayed side by side. Some participants mentioned that they saw a pattern in how they differed, stating that humans are more focused on the objects overall shape and the co-occurrence of region whereas the algorithm focussed on object-specific patterns in sub-regions. They also trusted the manually created anchors significantly more (3.89 vs. 2.17). Whether this is due to a general tendency to trust humans more is left to be investigated. Interestingly participants mentioned that they did not expect explanations to overlap or to be similar, but they expected them to align with their intuition. This shows that there can be more than one reasonable explanation for a given decision.
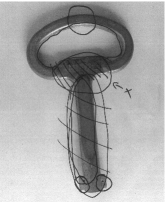
When creating anchors manually, participants often circled different regions that were overlapping or connected stating that the occurrence of both regions together or in a particular spatial arrangement is what made them assign a specific label (see Figure 5). However, mapping such an explanation to a set of sub-regions is not possible. Hence, anchors can only communicate very few reasons for a given decision. Future research could consult expertise from cognitive psychology and social science (Miller, 2019) about how humans generate and look at explanations. Such insights can be used to extend LIME or other post-hoc methods to convey more decision making context such as the relationships between regions. It is important to mention here that many interpretable models such as rule-based systems or classification trees provide explanations for the combination of features to a decision. Furthermore, explanations are not limited to the use of input features. Their expressiveness can be enhanced with the use of other media and modalities (see (Lipton, 2018) for examples). Sevastjanova et al. (Sevastjanova et al., 2018) even outlined a very promising design space for the combination of verbalisation and visualisation to produce even richer explanations.
 \Description
An image showing a bottle opener that is also a key for a door of an electric appliance room. The image has been marked with several regions as described in Figure 1. Almost the entire object is covered with small regions. Two regions have been crossed out to indicate that they are not as important as the other ones.
5. Future Work and Conclusion
We aim to repeat this study with a more thorough design (no convenience sampling, better isolation of factors, improved shape of anchors, standardised questionnaires). In this experiment, we studied a very abstract notion of trust as the faith in a models performance. Following the argumentation of Doshi-Velez et al. (Doshi-Velez and Kim, 2017) trust should instead be evaluated in respect to some real-world desiderata and more carefully operationalised. For example, one could base the reward for the experiment on the participant’s ability to rely on the system appropriately. In such an experiment post-hoc explanations could be compared to real explanations, placebo explanation or simple model performance statistics. In future studies, we also seek to asses another quality indicator of explanations: their decision-contrasting capabilities (Lipton, 2018; Miller, 2019). Since anchors only provide information about why a label was assigned, we plan to investigated if they can also provide useful information about why another label was not chosen.
In this work, we found that anchors are very minimalistic explanations that can be very selective. Even though they retain the essence of a decision, it is worth investigating how they could convey more decision-making contexts. We see this early work as a starting point for a series of human grounded evaluations (Doshi-Velez and Kim, 2017) that asses the practical interpretability provided by post-hoc explanations and interpretable models.
Acknowledgements: Funded by the German Federal Ministry of Education and Research (BMBF) - NR 16DII113. During her fellowship at the Weizenbaum Institute, Stefania Druga provided helpful comments on this work. Berit Wiegmann helped to refine the infographics. We are also grateful to the anonymous reviewers for their valuable suggestions to mature the ideas presented in this paper.
References
- (1)
- Abadi et al. (2015) Martín Abadi et al. 2015. TensorFlow: Large-Scale Machine Learning on Heterogeneous Systems. (2015). https://www.tensorflow.org/ Software available from tensorflow.org.
- Abdul et al. (2018) Ashraf Abdul, Jo Vermeulen, Danding Wang, Brian Y. Lim, and Mohan Kankanhalli. 2018. Trends and Trajectories for Explainable, Accountable and Intelligible Systems: An HCI Research Agenda. In Proceedings of the 2018 CHI Conference on Human Factors in Computing Systems (CHI ’18). ACM, Article 582, 18 pages. https://doi.org/10.1145/3173574.3174156
- Binns et al. (2018) Reuben Binns, Max Van Kleek, Michael Veale, Ulrik Lyngs, Jun Zhao, and Nigel Shadbolt. 2018. ’It’s Reducing a Human Being to a Percentage’: Perceptions of Justice in Algorithmic Decisions. In Proceedings of the 2018 CHI Conference on Human Factors in Computing Systems (CHI ’18). ACM, Article 377, 14 pages. https://doi.org/10.1145/3173574.3173951
- Chollet et al. (2015) François Chollet et al. 2015. Keras. https://keras.io. (2015).
- Council (2017) ACM U.S. Public Policy Council. 2017. Statement on Algorithmic Transparency and Accountability. (May 2017).
- Doshi-Velez and Kim (2017) Finale Doshi-Velez and Been Kim. 2017. Towards A Rigorous Science of Interpretable Machine Learning. arXiv:1702.08608 [cs, stat] (Feb. 2017). arXiv:cs, stat/1702.08608 http://arxiv.org/abs/1702.08608
- Kulesza et al. (2015) Todd Kulesza, Margaret Burnett, Weng-Keen Wong, and Simone Stumpf. 2015. Principles of Explanatory Debugging to Personalize Interactive Machine Learning. In Proceedings of the 20th International Conference on Intelligent User Interfaces (IUI ’15). ACM, New York, NY, USA, 126–137. https://doi.org/10.1145/2678025.2701399
- Lipton (2018) Zachary C. Lipton. 2018. The Mythos of Model Interpretability. Commun. ACM 61, 10 (Sept. 2018), 36–43. https://doi.org/10.1145/3233231
- Miller (2019) Tim Miller. 2019. Explanation in Artificial Intelligence: Insights from the Social Sciences. Artificial Intelligence 267 (2019), 1–38. https://doi.org/10.1016/j.artint.2018.07.007
- Rader et al. (2018) Emilee Rader, Kelley Cotter, and Janghee Cho. 2018. Explanations As Mechanisms for Supporting Algorithmic Transparency. In Proceedings of the 2018 CHI Conference on Human Factors in Computing Systems (CHI ’18). ACM, Article 103, 13 pages. https://doi.org/10.1145/3173574.3173677
- Ribeiro et al. (2016) Marco Tulio Ribeiro, Sameer Singh, and Carlos Guestrin. 2016. ”Why Should I Trust You?”: Explaining the Predictions of Any Classifier. In Proceedings of the 22Nd ACM SIGKDD International Conference on Knowledge Discovery and Data Mining (KDD ’16). ACM, New York, NY, USA, 1135–1144. https://doi.org/10.1145/2939672.2939778
- Sevastjanova et al. (2018) Rita Sevastjanova, Fabian Beck, Basil Ell, Cagatay Turkay, Rafael Henkin, Miriam Butt, Daniel Keim, and Mennatallah El-Assady. 2018. Going beyond Visualization: Verbalization as Complementary Medium to Explain Machine Learning Models. In Workshop on Visualization for AI Explainability.
- Szegedy et al. (2015) Christian Szegedy et al. 2015. Rethinking the Inception Architecture for Computer Vision. CoRR abs/1512.00567 (2015). arXiv:1512.00567 http://arxiv.org/abs/1512.00567
- The IEEE Global Initiative on Ethics of Autonomous and Intelligent Systems (2017) The IEEE Global Initiative on Ethics of Autonomous and Intelligent Systems. 2017. Ethically Aligned Design: A Vision for Prioritizing Human Well-Being with Autonomous and Intelligent Systems. (2017). Version 2.