Current-feedback-stabilized laser system for quantum simulation experiments using Yb clock transition at 578 nm
Abstract
We developed a laser system for the spectroscopy of the clock transition in ytterbium (Yb) atoms at 578 nm based on an interference-filter stabilized external-cavity diode laser (IFDL) emitting at 1156 nm. Owing to the improved frequency-to-current response of the laser-diode chip and the less sensitivity of the IFDL to mechanical perturbations, we succeeded in stabilizing the frequency to a high-finesse ultra-low-expansion glass cavity with a simple current feedback system. Using this laser system, we performed high-resolution clock spectroscopy of Yb and found that the linewidth of the stabilized laser was less than 320 Hz.
I INTRODUCTION
In recent years, significant attention has been given to the - intercombination transitions or ”clock transitions” of alkaline-earth like atoms owing to their various applications, including optical lattice clocksKatori et al. (2003),Mcgrew et al. (2018), quantum simulatorsGorshkov et al. ,Ono et al. (2019), and quantum information processingDaley (2011). In order to use such clock transitions, the development of an ultranarrow laser is crucially important due to the narrow linewidth of the - transition.
For the clock transition of ytterbium (Yb) atoms at 578 nm, dye-lasersHoyt et al. and diode lasers with sum-frequency generationsInaba et al. are used to excite this transition. More recently, diode lasers with second-harmonic generations (SHG) have become widely usedNevsky et al. (2008),Lee et al. (2011),Cappellini et al. (2015),Kobayashi et al. (2016) owing to their simplicity over other schemes. A quantum-dot laser diode at 1156 nm used in previous reports, however, has unfavorable characteristics, namely, the response of the laser frequency against the laser-diode current modulation at high frequency is slowCappellini et al. (2015) and an electro-optic modulator (EOM) or special electrical filter must be employed for the feedback of the fast error signal.
In this study, we report a versatile laser system that enables us to excite the Yb - clock transition at 578 nm with a simple current feedback stabilization system. As a key component of the system, we constructed an interference-filter stabilized external-cavity diode laserBaillard et al. (2006) (IFDL) emitting at 1156 nm, the laser frequency of which is less sensitive to mechanical perturbations. A 578 nm light is generated through SHG using a waveguide of periodically poled lithium niobate (PPLN). In this study, we adopted an improved quantum-dot LD whose internal waveguide stripe differs from those used in previous reports. We measured the frequency-to-current response of the gain chip and found that the chip has a fast response comparable to a normal laser diode. This enabled us to stabilize the laser frequency to an ultra-low expansion (ULE) glass cavity with a finesse of approximately 60,000 using typical PID current feedback without the application of a special optical or electrical component. Using this stabilized laser, we demonstrated the spectroscopy of the - transition in Yb and found that the laser linewidth was less than 320 Hz at 578 nm.
II FILTER-STABILIZED DIODE LASER
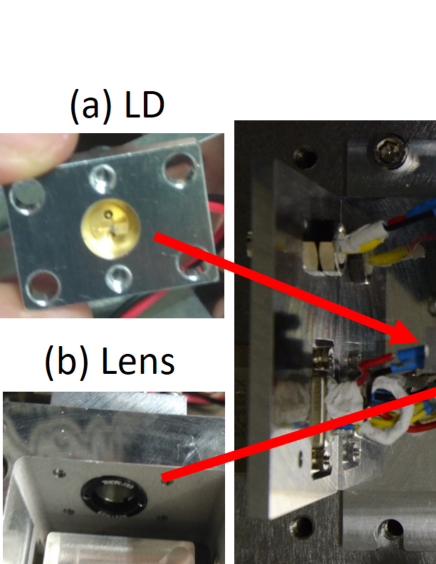
The design of our IFDL is shown in Fig.1. The output of a laser diode (LD) is retroreflected by a partial reflective mirror in a cateye configuration, which forms a laser cavity, and the wavelength of the IFDL is selected by tuning the angle of the interference filter inside the cavity. The retroreflector placed in a cateye configuration makes the laser frequency less sensitive to mechanical perturbations. This characteristic is beneficial, particularly for the excitation of narrow transitions such as clock transitions. We adopted a quantum-dot LD (Innolume GC-1180-100-TO-200-B) with a single AR-coating facet. Different from a previous product (Innolume GC-1156-TO-200), this LD has a curved waveguide that suppresses lasing by itself. The injection current of the LD is controlled using a commercial current controller (Vescent Photonics D2-105-500) and a servo system (Vescent Photonics D2-125), the power of which is supplied by a low-noise power supply (Vescent Photonics D2-005). The output beam of the LD is collimated by an aspherical lens. The collimated beam passes through an interference filter and is focused on a partially reflective mirror (output coupler) by another aspherical lens in a cateye configuration. The output coupler has a reflectance of 25 % and is mounted on a ring piezo actuator (Piezomechanik HPSt 500/15-8/5). The cavity length is about 5 cm, which can be fine-tuned using the piezo actuator. The laser frequency is selected by an interference filter mounted on an stage with a variable angle in the cavity. The maximum transmittance of the filter is 72 % at 1157.6 nm and the full width at half maximum (FWHM) of the transmittance spectrum is 0.44 nm. The angle of the filter is fixed around for lasing at 1156 nm. The transmitted light of the output coupler is collimated again by an aspherical lens. The temperature of all components is stabilized using a single Pertier device.
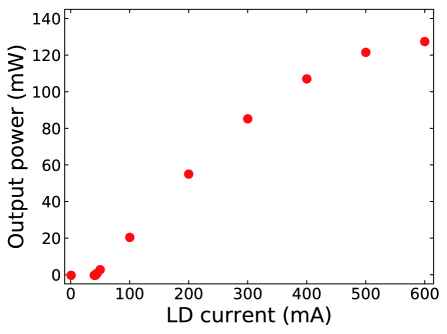
We can obtain an output power of 127 mW with an injection current of 600 mA (Fig.2). The output power of the IFDL is slightly weaker than the value on the data sheet taken with Littrow ECDL with 10 % optical feedback. The frequency stabilization becomes unstable at above a current of 400 mA. Considering the saturating behavior at over 400 mA, such instability can be attributed to the over injection to the laser diode.
III FREQUENCY-TO-CURRENT RESPONSE
In previous reports using a commercial laser diode at 1156 nmLee et al. (2011),Cappellini et al. (2015),Kobayashi et al. (2016), GC-1156-TO-200 (Innolume) was adopted as a gain chip. Strangely, the chip has a slow frequency-to-current response compared to typical laser diodes. According to Ref.Cappellini et al., 2015, the phase of the frequency response flips from 0∘ to 180∘ at a current modulation frequency of between 10 and 100 kHz current modulation frequency. This characteristic severely limits the feedback bandwidth. To overcome this problem, another actuator such as an EOM or special electrical filter for the feedback of a fast error signal was employed.
Thanks to the recent development of a new manufacturing process for laser waveguides, other types of laser diodes have become commercially available for the 1156-nm wavelength. In this study, we explore the possibility of using a GC-1180-100-TO-200-B (Innolume), which has a curved waveguide to suppress lasing by itself.
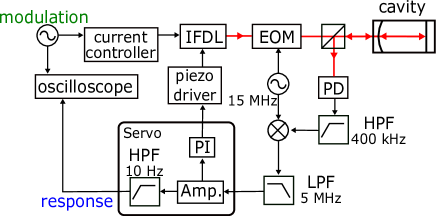
To evaluate the feedback properties of this new product, we measured the frequency-to-current response. The measurement setup is shown in Fig.3. For this measurement, we constructed a low-finesse cavity whose finesse and FWHM at 1156 nm are 600 and 2 MHz, respectively. The frequency response was evaluated using an error signal produced by the Pound-Drever-Hall (PDH) schemeDrever et al. (1983). To generate frequency sidebands for the PDH scheme, an EOM driven at a 15-MHz radio-frequency (RF) from a local oscillator was used. The RF signal from the photodiode passing through a high-pass filter with a cutoff frequency of 400 kHz was mixed into the local oscillator signal and filtered by a low-pass filter with a cutoff frequency of 5 MHz to generate an error signal. Note that the laser frequency was kept near the resonance of the cavity through the weak and slow feedback of the error signal to the piezo actuator. This piezo feedback is done below the 100 Hz frequency range where we expect the normal response of the laser frequency versus LD current to be located. To determine the response of the LD, we added a small LD current modulation of less than 40 A to the 300 mA direct current. By comparing the modulation signal and modulated error signal, shown in Fig.4(a), we can evaluate the response of the error signal against the LD current modulation.
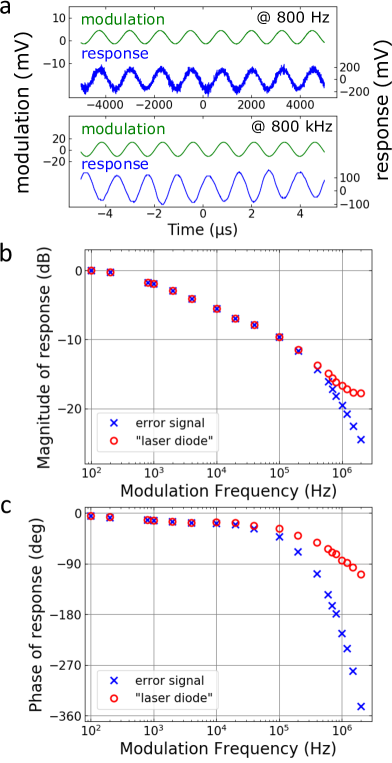
The amplitude and phase of the obtained responses are shown in Figs.4(b) and 4(c), respectively. The observed response comes from not only the LD response itself but also that of other optical or electrical components. Thus, to solely obtain the LD response, we subtract the contributions from other parts. One contribution comes from the response of the PDH system. The response of the error signal in the PDH scheme is similar to that of a low-pass filter with a cutoff frequency of 1.05 MHz, corresponding to the half-width at half-maximumRakhmanov et al. (2002) (HWHM) of the used cavity measured from the transmission signal. Another contribution is the electric and optical propagation delay. By summing the delays of the electronic low-pass filter, laser servo, coaxial cables, optical fiber, and optical path in the space, we estimate the propagation delay to be 240 ns. Subtracting these contributions, we can conclude that the phase flip of the LD occurs around 1.2-MHz modulation, which is one order of magnitude larger than that of previous reports. Note that we do not consider the laser linewidth or propagation delays from other components in this analysis. Furthermore, the weak and slow feedback to the piezo actuator is not included in the analysis. We measured the response at a modulation frequency of 100 Hz and found that the amplitude of the response is suppressed by only 3 %. Because the resonance of the piezo actuator cannot be seen in the response, we can conclude that the effect of the feedback to the measurement is negligibly small.
In order to check the consistency of the response measurement, we locked the laser frequency to the cavity resonance by the feedback to the laser-diode current in the setup. At a large feedback gain, a peak was observed at approximately 800 kHz in the error signal spectrum. This is consistent with the response measurement where the phase of the measured response crosses the 180∘ line at 800 kHz.
IV SECOND HARMONIC GENERATION
To generate 578 nm light from the 1156 nm light, we use a waveguide PPLN crystal manufactured by NTT Electronics. This is the same product as that used in Ref.Kobayashi et al., 2016. The 1156 nm beam passes through two optical isolators with an isolation of 77 dB and is then coupled to the PPLN through a polarization-maintaining fiber. Under typical conditions, the input power of the 1156 nm laser beam before the fiber coupler of the PPLN module is 80 mW and a total of 26 mW of the 1156 nm laser power couples to the PPLN. We can obtain an 18-mW output power at 578 nm under the optimum temperature.
V LOCKING TO THE ULE CAVITY
To obtain the short- and long-term stability of the laser frequency, we stabilized our laser to a high-finesse cavity made of ULE glass as a stable frequency reference. The ULE cavity was placed in a vacuum chamber whose temperature was stabilized using a Pertier device attached to the outside of the chamber. To isolate it from mechanical vibrations, the chamber was placed on a passive vibration-isolation table surrounded by an acoustic isolation box. The finesse of the cavity was about 60,000 for the wavelength of 578 nm, meaning that the HWHM of the cavity resonance spectrum was about 25 kHz.
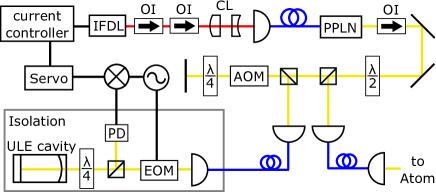
A schematic drawing of the locking system for the clock laser is shown in Fig.5. A portion of the 578-nm laser generated at the waveguide PPLN is used for the frequency stabilization. In order to compensate the frequency difference between the atomic transition and the cavity resonance, the laser frequency is shifted using a double-pass acousto-optic modulator (AOM). The error signal is generated by a PDH scheme and is fed back to the LD current through the same current controller and servo as used in the frequency-to-current response measurement. We succeeded in stabilizing the laser to the ULE cavity through feedback to the LD current without additional stabilization schemes such as a pre-stabilizerRohde et al. (2002), AOM or EOM. The remainder of the 578-nm laser power is brought to the atomic experiment through a 25-m fiber with fiber noise cancellationMa et al. (1994).
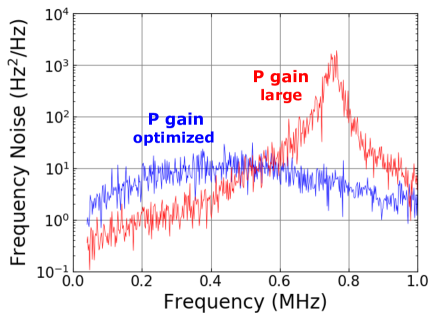
Figure 6 shows the power spectrum of the error signal. When the PID parameters of the servo are optimized, the spectrum has no large peaks. As we increase the proportional gain from the optimized parameters, the system starts to oscillate and a large peak around 750 kHz appears in the spectrum. Based on the above, we estimated the feedback bandwidth to be approximately 750 kHz. The reduction of the feedback bandwidth from the test system with the lower finesse was caused by the narrower width of the cavity resonance. We achieved stable frequency stabilization without any relocking the system for the time duration typically longer than one day.
VI Yb SPECTROSCOPY
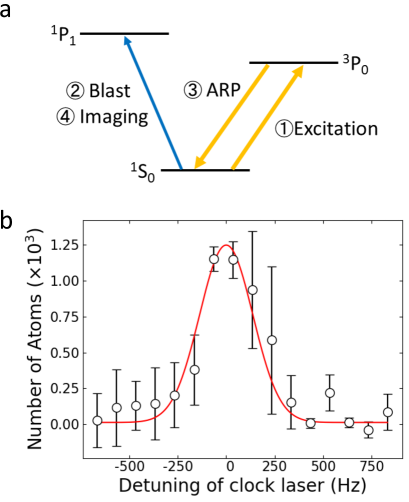
In order to evaluate the linewidth of the 578 nm laser, we performed a spectroscopy of the clock transition with 171Yb in an optical lattice. The detailed experimental setup is written in Ref.Ono et al., 2019 and we describe it in short here. We prepare the degenerate 171Yb atoms in a crossed-optical trap by a sympathetic evaporative cooling with 173Yb atoms. After the removal of 173Yb, 171Yb atoms are loaded into the 3D optical lattice with the magic wavelength of about 759 nm, which gives the same trapping potential for the and states. In this configuration, we can strongly suppress the many types of spectral broadening effects such as the Doppler effect, the differential light shift, and the collisional shift, as is well known in discussions on optical lattice clocksKatori et al. (2003). The depth of the lattice is 30 , where is the recoil energy of the lattice laser, which is sufficiently deep to be within the Lamb-Dicke regime. A magnetic field of 15 G is applied to spectroscopically separate the nuclear spin components. The 578-nm laser with -polarization is irradiated to the atoms for 100 ms and a part of atoms in the state are excited into the state. The atoms remaining in the state are removed by the light resonant to the - transition. After the removal, the atoms in the state are returned to the state by the 578-nm laser with an adiabatic frequency sweep. The number of atoms in the state is then measured via absorption imaging with the - transition.
The spectrum obtained is shown in Fig.7. The Gaussian fitting to the data gives the FWHM of the spectrum of 324 Hz. The intensity of the 578-nm laser is 0.3 mW/cm2 and its power broadening is estimated to be about 100 Hz. Taking this into consideration, the linewidth of the laser is deduced to be less than 320 Hz, which is narrow enough for most quantum simulation experimentsOno et al. (2019),Kato et al. (2016),Nakamura et al. (2019).
VII CONCLUSION
We constructed an external-cavity diode laser system with an interference filter for the clock transition of ytterbium atoms and obtained an output of 18 mW output at 578 nm. We adopted a new type of LD chip for 1156 nm and showed that it has a fast frequency-to-current response unlike the LDs in the previous reports. We succeeded in stabilizing the frequency of the laser to the high-finesse ULE cavity by feedback to the LD current without special electrical or optical elements. The feedback bandwidth of the stabilization is about 750 kHz. Using the stabilized laser, we succeeded in high-resolution spectroscopy of 171Yb atoms in the optical lattice. From the spectroscopy, the laser linewidth was deduced to be less than 320 Hz, revealing the usefulness of the laser system.
Acknowledgements.
We are grateful to A. Yamaguchi, N. Nemits, D. Akamatsu, and M. Yasuda for the detailed information regarding their clock lasers. We would like to acknowledge K. Nakagawa for the mechanical design of the IFDL. This work was supported by the Grant-in-Aid for Scientic Research of MEXT/JSPSKAKENHI (No. 25220711, No. 17H06138, No. 18H05405, and No. 18H05228), the Impulsing Paradigm Change through Disruptive Technologies (ImPACT) program, JST CREST (No. JPMJCR1673), and MEXT Q-LEAP.References
- Katori et al. (2003) H. Katori, M. Takamoto, V. G. Pal’chikov, and V. D. Ovsiannikov, Phys. Rev. Lett. 91, 173005 (2003).
- Mcgrew et al. (2018) W. F. Mcgrew, X. Zhang, R. J. Fasano, S. A. Schäffer, K. Beloy, D. Nicolodi, R. C. Brown, N. Hinkley, G. Milani, M. Schioppo, T. H. Yoon, and A. D. Ludlow, Nature 564, 87 (2018).
- (3) A. V. Gorshkov, M. Hermele, V. Gurarie, C. Xu, P. S. Julienne, J. Ye, P. Zoller, E. Demler, M. D. Lukin, and A. M. Rey, Nat. Phys. , 289.
- Ono et al. (2019) K. Ono, J. Kobayashi, Y. Amano, K. Sato, and Y. Takahashi, Phys. Rev. A 99, 032707 (2019).
- Daley (2011) A. J. Daley, Quantum Inf. Proc. 10, 865 (2011).
- (6) C. W. Hoyt, Z. W. Barber, C. W. Oates, T. M. Fortier, S. A. Diddams, and L. Hollberg, Physical Review Letters , 083003.
- (7) H. Inaba, K. Hosaka, M. Yasuda, Y. Nakajima, K. Iwakuni, D. Akamatsu, S. Okubo, T. Kohno, and A. Onae, , 7891.
- Nevsky et al. (2008) A. Y. Nevsky, U. Bressel, I. Ernsting, C. Eisele, M. Okhapkin, S. Schiller, A. Gubenko, D. Livshits, S. Mikhrin, I. Krestnikov, and A. Kovsh, Appl. Phys. B 92, 501 (2008).
- Lee et al. (2011) W.-K. Lee, C. Y. Park, D.-H. Yu, S. E. Park, S.-B. Lee, and T. Y. Kwon, Opt. Express 19, 17453 (2011).
- Cappellini et al. (2015) G. Cappellini, P. Lombardi, M. Mancini, G. Pagano, M. Pizzocaro, L. Fallani, and J. Catani, Rev. Sci. Instrum. 86, 073111 (2015).
- Kobayashi et al. (2016) T. Kobayashi, D. Akamatsu, K. H. H. Inaba, S. Okubo, T. Tanabe, M. Yasuda, A. Onae, and F.-L. Hong, J. Opt. Soc. Am. B 33, 725 (2016).
- Baillard et al. (2006) X. Baillard, A. Gauguet, S. Bize, P. Lemonde, P. Laurent, A. Clairon, and P. Rosenbusch, Opt. Commun. 266, 609 (2006).
- Drever et al. (1983) R. W. P. Drever, J. L. Hall, F. V. Kowalski, J. Hough, G. M. Ford, A. J. Munley, and H. Ward, Appl. Phys. B 31, 97 (1983).
- Rakhmanov et al. (2002) M. Rakhmanov, R. SavageJr., D. Reitze, and D.B.Tanner, Phys. Lett. A 305, 239 (2002).
- Rohde et al. (2002) H. Rohde, J. Eschner, F. Schmidt-Kaler, and R. Blatt, J. Opt. Soc. Am. B 19, 1425 (2002).
- Ma et al. (1994) L.-S. Ma, P. Jungner, J. Ye, and J. L. Hall, Opt. Lett. 19, 1777 (1994).
- Kato et al. (2016) S. Kato, K. Inaba, S. Sugawa, K. Shibata, R. Yamamoto, M. Yamashita, and Y. Takahashi, Nat. Commun. 7, 11341 (2016).
- Nakamura et al. (2019) Y. Nakamura, Y. Takasu, J. Kobayashi, H. Asaka, Y. Fukushima, K. Inaba, M. Yamashita, and Y. Takahashi, Phys. Rev. A 99, 033609 (2019).