Revisiting the statistical isotropy of GRB sky distribution
Abstract
The assumption of homogeneity and isotropy on large scales is one of the main hypotheses of the standard cosmology. In this paper, we test the hypothesis of isotropy from the two-point angular correlation function of 2626 gamma-ray bursts (GRB) of the FERMI GRB catalogue. We show that the uncertainties in the GRB positions induce spurious anisotropic signals in their sky distribution. However, when such uncertainties are taken into account no significant evidence against the large-scale statistical isotropy is found. This result remains valid even for the sky distribution of short-lived GRB, contrarily to previous reports.
keywords:
Large-scale structure of Universe – methods: data analysis – gamma-ray burst: general1 Introduction
One of the foundations of modern cosmology is the so-called Cosmological Principle (CP), which consists in the assumption that the Universe looks homogeneous and isotropic on large scales. Statistical analyses using recent cosmological observations bring evidence that the CP holds true at such scales, as obtained from the Cosmic Microwave Background (CMB) temperature anisotropies (Ade et al., 2016), cosmic distances from type Ia Supernovae (Andrade et al., 2018b; Deng & Wei, 2018; Sun & Wang, 2018; Andrade et al., 2018a; Zhao et al., 2019; Soltis et al., 2019), galaxy number counts (Gibelyou & Huterer, 2012; Yoon et al., 2014; Bengaly et al., 2018a; Rameez et al., 2018), the sky distribution of galaxy clusters (Bengaly et al., 2017; Migkas & Reiprich, 2018). There is also evidence for a homogeneity scale in the counts of quasars and galaxies (Scrimgeour et al., 2012; Ntelis et al., 2017; Gonçalves et al., 2018a; Gonçalves et al., 2018b). However, some controversial claims have appeared in the literature, such as large-angle features in the CMB (Schwarz et al., 2016) and a large dipole anisotropy in radio source counts (Singal, 2011; Rubart & Schwarz, 2013; Bengaly et al., 2018b) (see also Dolfi et al. 2019.).
Gamma-ray bursts (GRB) have also been used to test the CP. These events are extremely energetic explosions, whose range lies between erg, which exceeds hundred times the total energy radiated by a supernova. Also if they are not properly standard candles, they may reveal themselves as possible formidable distance indicators. For a detailed discussion on the topic, we refer the reader to Amati & Della Valle 2013; Dainotti & Amati 2018; Dainotti et al. 2018. They are usually classified into short-lived (, SGRBs) and long-lived (, LGRBs), where denotes the duration in which of the burst fluence is accumulated. The LGRBs have been thought to originate from distance star-forming galaxies and associated with collapse of massive stars related to a supernova (SN). However, LGRBs with no clear association with any bright SN have been found. Besides, some LGRBs were observed in a very metal-rich systems, in contradiction to the core-collapse model (Woosley & Bloom, 2006). Hence, the formation of LGRBs besides the collapse scheme is still a mater of debate. SGRBs are attributed to mergers between neutron star-black hole (NS-BH) or NS-NS. However, Perna et al. (2016) proposed an alternative scenario that can also lead to a SGRB from mergers of BH-BH. Therefore, SGRBs have been correlated with the local Universe (Tanvir et al., 2005; Ghirlanda et al., 2006), while LGRBs typicall consist of higher redshift objects, (Cucchiara et al., 2011).
In the last decades, several authors have shown that the GRBs sky distribution is consistent with statistical isotropy (Hartmann & Blumenthal, 1989; Hartmann et al., 1991; Meegan et al., 1992; Briggs et al., 1996; Tegmark et al., 1996). However, subsequent works suggested otherwise for SGRBs (Balazs et al., 1998; Meszaros et al., 2000; Magliocchetti et al., 2003; Vavrek et al., 2008; Tarnopolski, 2017). Moreover, there are also claims for the existence of GRB structures of 2000 Mpc at (Horvath et al., 2014, 2015; Ruggeri & Capozziello, 2016) – for a different conclusion, see also (Bernui et al., 2008; Gibelyou & Huterer, 2012; Li & Lin, 2015; Ukwatta & Wozniak, 2016; Tarnopolski, 2017; Ripa & Shafieloo, 2017, 2018)111In addition to test the CP, GRB have also been used to probe fundamental physics (Petitjean et al., 2016)..
Given the relevance of the topic, and the current controversies, we revisit in this paper the question of the statistical isotropy in the GRB sky distribution. The analysis performed uses the two-point angular correlation function (2pACF) of 2627 gamma-ray bursts of the Fermi Gamma-ray Burst Monitor Burst catalogue. We show that, after removing objects with large sky positional errors, there is no evidence of anisotropy signatures for the whole GRB sample, as well as for LGRBs and SGRBs sub-samples. We also applied our data analysis to the Burst And Transient Source Experiment (BATSE) current GRB catalogue of the Compton Gamma Ray Observatory (CGRO) satellite containing 2702 GRBs and similar results are found.
This paper is organised as follows. In Sec. II the observational data set used in the analysis is discussed. The methodology and data analysis performed are presented in Sec. III. Sec. IV presents our main results whereas Sec. V discusses such results and summarises our main conclusions.
2 The observational data set
In our analysis we use the Fermi Gamma-ray Burst Monitor Burst Catalogue, termed FERMIGBRST (Gruber et al., 2014; von Kienlin et al., 2014; Bhat et al., 2016). This catalogue is one of the most complete GRB catalogues currently available, comprising 2627 objects detected from July 14th 2008 until August 06th 2019 222https://heasarc.gsfc.nasa.gov/W3Browse/fermi/fermigbrst.html.. Specifically, we make use of the following quantities:
-
1.
RA: The Right Ascension of the burst, given in J2000 decimal degree.
-
2.
DEC: The Declination of the burst, given in J2000 decimal degree.
-
3.
ErrorRadius: The uncertainty of the object position, in degrees. We term it as , which ranges from zero, when the source localisation was obtained using something other than Fermi GBM (for example, Swift, XMM), up to .
-
4.
: The duration, in seconds, during which of the burst fluence was accumulated.
For completeness, we also use the BATSE current Gamma-Ray Burst catalogue, which contains 2702 GRBs detected from March 21th 1991 until May 26th 2000333https://heasarc.gsfc.nasa.gov/W3Browse/all/batsegrb.html.. We make use of similar quantities as the FERMIGRBST catalogue.
The FERMIGRBST and CGRO/BATSE sky distribution of the selected GRBs are displayed in the Fig. 2 and Fig. 2, respectively. Note that we removed one object in the former and 665 objects in the latter, because they do not contain information on the parameter. We test the statistical isotropy for three cases, namely the whole GRB sample, (allGRB), as well as the LGRB and SGRB sub-samples.


3 Data analysis
3.1 Two-point angular correlation function


In order to summarise the distribution of data points in the sky, one can report the mean number of points at a given scale. However, in the presence of clustering, the mean may be an insufficient descriptor, as this measure is insensitive to it. The 2pACF is a statistic capable of characterising the clustering of objects in the sky, which we denote by . Essentially, it provides the probability to find a pair of object encompassed in a given solid angle with respect to an isotropic distribution (Peebles, 1980). As a result, the 2pACF is null in the absence of clustering, and it is statistically similar for all angular scales if the underlying distribution is statistically isotropic.
We can determine the 2pACF from the data using the well-known Landy-Szalay estimator (Landy & Szalay, 1993),
| (1) |
where the brackets denote the normalised number of all GRB pairs in the real data (), in the auxiliary random isotropic catalogue (), and between the data and the random catalogue (). The counts of pairs for each angular scale is carried out through the range , where is the bin width. We choose evenly spaced samples in our analysis, so that is calculated over the interval with . The random isotropic catalogues are generated following a uniform distribution on a sphere, so that
| (2) | |||||
| (3) |
We estimate our uncertainties of the 2pACF via bootstrap method (Tarnopolski, 2017). By means of 100 re-samplings between the data and the random catalogue, we obtain a bootstrap sampling distribution of the 2pACF whose uncertainty is the standard deviation of this sampling distribution. We also compute the 2pACF for isotropic random sample through Monte Carlo (MC) method, and perform the bootstrap analysis on it as well. We denote the mean and the standard deviation of this distribution as the benchmark (Tarnopolski, 2017), since it provides the 2pACF limits that a finite isotropic sample must satisfy. Any significant deviation from this benchmark would hint at departures from statistical isotropy.
3.2 Absolute sum test
In order to further investigate the readability of the anisotropic signal, we devised what we hereafter call “Absolute sum test". We defined it as the summation of the absolute 2pACF values within a specific angular scale, i.e.,
| (4) |
where is the angular range at which we split the , so that we perform this summation in a tomographic fashion within this range, i.e., . We choose in order to have at least 10 values of within this interval (since ) and thus a robust statistics for each -bin. Hence we can compare the 2pACF at different angular scales for two distributions, e.g. the real data versus the benchmark. Again, any deviation beside the error bars (as obtained from standard uncertainty propagation) suggests potential deviations from statistical isotropy, after all, the 2pACF values should agree at different angular if this assumption holds.
3.3 Statistical significance estimate
We assess the statistical significance of our analysis by means of non-parametric tests between two different samples as follows:
-
1.
Kolmogorov-Smirnov (KS): It consists of a distribution-free test which compares the empirical cumulative distribution function (ECDF) of two samples (Ivezić et al., 2014). This test relies on a metric which measures the maximum distance of the two ECDF and ,
(5) -
2.
Anderson-Darling (AD): This test is based on the following statistics (Scholz & Stephens, 1987):
(6) and are ECDF for two independent samples that may have different number of points, namely and , respectively. is the ECDF of the pooled sample, where .
Our null hypothesis is that the two sample are drawn from the same distribution. KS test is sensitive to the location, the scale and the shape of the distribution, while AD test is only sensitive to the shape. Moreover, AD test is more sensitive to the tails differences than KS test, which in turn is more sensitive to the differences near the centre of the distribution. In this sense, these two non-parametric tests are complementary.
We choose as the significance level in which we reject the null hypothesis. Hence, a p-value lower than when we compare the real data with the benchmark, for example, would denote that the samples are not drawn from the same distribution - and thus the data is not statistically isotropic. We used the routines ks_2samp and anderson_ksamp of the SciPy Python library to compute the KS and AD statistics, as well as the p-values444Jones E, Oliphant E, Peterson P, et al. SciPy: Open Source Scientific Tools for Python, 2001-, http://www.scipy.org/ [Online; accessed 2018-11-13]..


3.4 GRB positional uncertainties
Previous works showed that the GRB positional uncertainties might affect the measurement of the 2pACF and angular power spectrum of their celestial distribution (Hartmann et al., 1991; Tegmark et al., 1996). Here, in order to investigate the impact of such uncertainties on our analysis, we produce 1000 Monte Carlo (MC) realisations with the following prescription:
| (7) | |||||
| (8) |
Due to the shuffling of GRB celestial positions, we henceforth call this test MC-shuffle. We compute the 2pACF for each of these realisations, then we take their mean and standard deviation, and compare them with the benchmark. We repeat this procedure for different positional uncertainty cutoffs, which we denote by . If we find significant discrepancy between these MC-shuffle and benchmark realisations for less restrictive cutoffs, this will hint at spurious anisotropies arising due to such uncertainties.
4 Results
We depict the impact of GRB positional errors on the 2pACFs in Fig. 3 and Fig. 4. By comparing the MC-shuffle and the benchmark with an upper limit of and , we can clearly see that the latter is in better agreement with the benchmark, especially on smaller angular scales. This result shows that large positional errors indeed introduce spurious anisotropic signatures, as previously reported in Hartmann et al. (1991); Tegmark et al. (1996), and therefore we should impose an upper cutoff in our working sample. The GRB sub-sample with will be hereafter taken as our real data sample, since it alleviates this feature, and we do not lose a large fractional of GRB, as we still retain 1760 GRBs in total, i.e., 1590 LGRBs and 170 SGRBs.
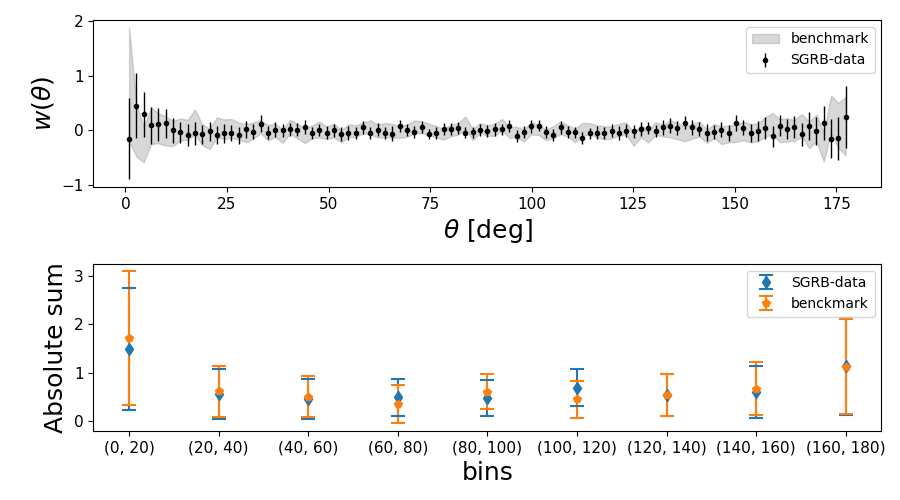
We compare the 2pACF between the real data and the benchmark in the upper panels of Fig. 5, while the bottom ones display the results from the absolute sum test as described in Section 3.2. The results obtained for LGRBs and SGRBs samples are displayed, respectively, in Fig. 6 and 7. Once more the shaded regions in the upper panels provide the allowed region which an intrinsic isotropic sample can vary due to randomness. From theses plots, we can conclude that both the 2pACF and the absolute sum show a good agreement between the allGRBs, LGRBs and SGRBs and the benchmark, and therefore no evidence against statistical isotropy. We verified that our results are unchanged for sub-samples of GRBs with fluence above a given value as or
In addition, we show the results obtained from the non-parametric tests in Table 1. We obtain that we cannot reject the null hypothesis at significance level of for all data samples, including SGRBs, although they yield the lowest p-value among all. We then confirm that the sky distribution of FERMIGBRST catalogue of GRBs is statistically isotropic, as expected from the CP.
For completeness, we also report the same analysis for the CGRO/BATSE GRB catalogue in Figs. 8, 9 and 10 for the allGRBs, LGRBs and SGRBs, respectively. We follow Chen & Hakkila (1998) who found that sky-exposure effects are small and should not affect our results. Here again, we see an agreement with the benchmark, which means no departure from statistical isotropy. The non-parametric tests for the CGRO/BATSE data set are displayed in Table 2. Although this set shows consistency with statistical isotropy, the allGRB sample shows departure from isotorpy. We discuss this latter result in the next section.
| allGRBs | LGRBs | SGRBs | |
|---|---|---|---|
| D | 0.11 | 0.11 | 0.14 |
| p-value | 0.55 | 0.55 | 0.26 |
| AD | -0.36555Negative values of AD statistic means that the p-value was obtained as an upper limits and the true value might be larger than 0.25 | -0.88 | 0.37 |
| p-value | 0.25 | 0.25 | 0.24 |
| allGRBs | LGRBs | SGRBs | |
|---|---|---|---|
| D | 0.21 | 0.11 | 0.12 |
| p-value | 0.02 | 0.55 | 0.44 |
| AD | 4.3 | 0.17 | -0.24 |
| p-value | 0.006 | 0.25 | 0.25 |
5 Discussion and conclusion
One of the major concepts of modern cosmology is the assumption of the statistical homogeneity and isotropy on large scales. Together with the Einstein’s field equations, they are at the basis of what we know as modern cosmology.
In this paper, we probed the statistical isotropic hypothesis of the CP by means of the 2pACF of the GRB sky distribution. To perform our analysis, we compared the 2pACF of the Fermi GRB catalogue with the 2pACF of the isotropic synthetic sample. We also investigated how the uncertainty in the GRBs position might affect ours conclusion by drawing 1000 MC simulations with new GRB positions inside the radius of the observational positional uncertainty.
We found that large positional uncertainties lead to spurious anisotropy detection, as shown in Fig. 3. For this reason, we perform cuts on the position uncertainty, choosing as an optimal upper cut in which we can avoid spurious anisotropy without losing too many sources. Then, we split the data in three samples: all GRBs, LGRBs and SGRBs, containing 1760, 1590 and 170 each, respectively, after this cutoff. Fig. 5, 6, and 7 show the results for each sample, respectively. We found a good agreement between all these data and the statistical isotropy hypothesis, since the 2pACF and the absolute sum test agrees with the benchmark simulations. This was also confirmed by the KS and AD tests between the real data and the benchmark, whose p-values are shown in Table 1. None of these p-values were smaller than , meaning we cannot reject the null hypothesis at this significance level. We remark that in the case of SGRB, despite a lower p-value, one still cannot reject the null hypothesis.
We performed the same analysis for the CGRO/BATSE GRB catalogue, whose results are shown in Fig. 8, 9 and 10 for allGRB, LGRB and SGRB samples, respectively, as well as in Table 2. We conclude that statistical isotropy holds in this catalogue as well, although that the allGRB sample exhibits a stronger departure from this assumption. We credit this anisotropy to the impact of the sky-exposure function. Although Chen & Hakkila (1998) showed that the effect on the 2pACF is small using a simple analysis, we argue that our analysis is more sensitive, and thus we could capture the impact of the sky-exposure function in the 2pACF as other anisotropy tests e.g. dipole and quadrupole moments (Meegan et al., 1996). This result shows that our method is robust enough to capture even small anisotropy effects.
We conclude that there is no significant evidence for isotropy departure in the currently available GRB catalogues - even in the the SGRB sub-samples. This result is in good agreement with Tarnopolski (2017); Ukwatta & Wozniak (2016); Ripa & Shafieloo (2017, 2018), although we used an updated sample of GRB, and a different estimator. Therefore, we confirm the validity of statistical isotropy of the GRB distribution across the sky, which should be definitely underpinned in light of forthcoming Gamma-Ray surveys like e.g. THESEUS (Amati et al., 2018). Specifically, this space mission is aimed to exploit GRBs in view of investigating the early Universe and then providing a substantial advance in time-domain astrophysics. Due to the wide range of redshift that this mission can reach, it can also be extremely interesting for multi-messenger astrophysics as well.
Acknowledgements
U.A. acknowledges financial support from CAPES. C.A.P.B. acknowledges financial support from the South African SKA Project. J.S.A. acknowledges support from CNPq (grant Nos. 310790/2014-0 and 400471/2014-0) and FAPERJ (grant No. E-26/203.024/2017). S.C. acknowledges support from INFN (Iniziativa Specifica QGSKY) and CANTATA COST action CA15117.
References
- Ade et al. (2016) Ade P. A. R., et al., 2016, Astron. Astrophys., 594, A16
- Amati & Della Valle (2013) Amati L., Della Valle M., 2013, International Journal of Modern Physics D, 22, 1330028
- Amati et al. (2018) Amati L., et al., 2018, Adv. Space Res., 62, 191
- Andrade et al. (2018a) Andrade U., Bengaly C. A. P., Santos B., Alcaniz J. S., 2018a, Astrophys. J., 865, 119
- Andrade et al. (2018b) Andrade U., Bengaly C. A. P., Alcaniz J. S., Santos B., 2018b, Phys. Rev., D97, 083518
- Balazs et al. (1998) Balazs L. G., Meszaros A., Horvath I., 1998, Astron. Astrophys., 339, 1
- Bengaly et al. (2017) Bengaly C. A. P., Bernui A., Alcaniz J. S., Ferreira I. S., 2017, Mon. Not. Roy. Astron. Soc., 466, 2799
- Bengaly et al. (2018a) Bengaly C. A. P., Novaes C. P., Xavier H. S., Bilicki M., Bernui A., Alcaniz J. S., 2018a, Mon. Not. Roy. Astron. Soc., 475, L106
- Bengaly et al. (2018b) Bengaly C. A. P., Maartens R., Santos M. G., 2018b, JCAP, 1804, 031
- Bernui et al. (2008) Bernui A., Ferreira I. S., Wuensche C. A., 2008, Astrophys. J., 673, 968
- Bhat et al. (2016) Bhat P. N., et al., 2016, Astrophys. J. Suppl., 223, 28
- Briggs et al. (1996) Briggs M. S., et al., 1996, Astrophys. J., 459, 40
- Chen & Hakkila (1998) Chen X., Hakkila J., 1998, in AIP Conference Proceedings. pp 149–153
- Cucchiara et al. (2011) Cucchiara A., et al., 2011, ApJ, 736, 7
- Dainotti & Amati (2018) Dainotti M. G., Amati L., 2018, PASP, 130, 051001
- Dainotti et al. (2018) Dainotti M., Del Vecchio R., Tarnopolski M., 2018, Adv. Astron., 2018, 4969503
- Deng & Wei (2018) Deng H.-K., Wei H., 2018, Eur. Phys. J., C78, 755
- Dolfi et al. (2019) Dolfi A., Branchini E., Bilicki M., Balaguera-Antolínez A., Prandoni I., Pandit R., 2019, Astron. Astrophys., 623, A148
- Ghirlanda et al. (2006) Ghirlanda G., Magliocchetti M., Ghisellini G., Guzzo L., 2006, Mon. Not. Roy. Astron. Soc., 368, L20
- Gibelyou & Huterer (2012) Gibelyou C., Huterer D., 2012, Mon. Not. Roy. Astron. Soc., 427, 1994
- Gonçalves et al. (2018a) Gonçalves R. S., Carvalho G. C., Bengaly C. A. P., Carvalho J. C., Bernui A., Alcaniz J. S., Maartens R., 2018a, Mon. Not. Roy. Astron. Soc., 475, L20
- Gonçalves et al. (2018b) Gonçalves R. S., Carvalho G. C., Bengaly C. A. P., Carvalho J. C., Alcaniz J. S., 2018b, Mon. Not. Roy. Astron. Soc., 481, 5270
- Gruber et al. (2014) Gruber D., et al., 2014, Astrophys. J. Suppl., 211, 12
- Hartmann & Blumenthal (1989) Hartmann D., Blumenthal G. R., 1989, Astrophys. J., 342, 521
- Hartmann et al. (1991) Hartmann D., Linder E. V., Blumenthal G. R., 1991, Astrophys. J., 367, 186
- Horvath et al. (2014) Horvath I., Hakkila J., Bagoly Z., 2014, Astron. Astrophys., 561, L12
- Horvath et al. (2015) Horvath I., Bagoly Z., Hakkila J., Toth L. V., 2015, Astron. Astrophys., 584, A48
- Ivezić et al. (2014) Ivezić Ž., Connolly A., Vanderplas J., Gray A., 2014, Statistics, Data Mining and Machine Learning in Astronomy. Princeton University Press
- Landy & Szalay (1993) Landy S. D., Szalay A. S., 1993, Astrophys. J., 412, 64
- Li & Lin (2015) Li M.-H., Lin H.-N., 2015, Astron. Astrophys., 582, A111
- Magliocchetti et al. (2003) Magliocchetti M., Ghirlanda G., Celotti A., 2003, Mon. Not. Roy. Astron. Soc., 343, 255
- Meegan et al. (1992) Meegan C. A., Fishman G. J., Wilson R. B., Paciesas W. S., Pendleton G. N., Horack J. M., Brock M. N., Kouveiotou C., 1992, Nature, 355, 143
- Meegan et al. (1996) Meegan C. A., et al., 1996, ApJS, 106, 65
- Meszaros et al. (2000) Meszaros A., Bagoly Z., Horvath I., Balazs L. G., Vavrek R., 2000, Astrophys. J., 539, 98
- Migkas & Reiprich (2018) Migkas K., Reiprich T. H., 2018, Astron. Astrophys., 611, A50
- Ntelis et al. (2017) Ntelis P., et al., 2017, JCAP, 1706, 019
- Peebles (1980) Peebles P. J. E., 1980, The large-scale structure of the universe. Princeton University Press
- Perna et al. (2016) Perna R., Lazzati D., Giacomazzo B., 2016, Astrophys. J., 821, L18
- Petitjean et al. (2016) Petitjean P., Wang F. Y., Wu X. F., Wei J. J., 2016, Space Sci. Rev., 202, 195
- Rameez et al. (2018) Rameez M., Mohayaee R., Sarkar S., Colin J., 2018, Mon. Not. Roy. Astron. Soc., 477, 1772
- Ripa & Shafieloo (2017) Ripa J., Shafieloo A., 2017, Astrophys. J., 851, 15
- Ripa & Shafieloo (2018) Ripa J., Shafieloo A., 2018, Arxiv:1809.03973
- Rubart & Schwarz (2013) Rubart M., Schwarz D. J., 2013, Astron. Astrophys., 555, A117
- Ruggeri & Capozziello (2016) Ruggeri A. C., Capozziello S., 2016, Astrophys. Space Sci., 361, 279
- Scholz & Stephens (1987) Scholz F. W., Stephens M. A., 1987, Journal of the American Statistical Association, 82, 918
- Schwarz et al. (2016) Schwarz D. J., Copi C. J., Huterer D., Starkman G. D., 2016, Class. Quant. Grav., 33, 184001
- Scrimgeour et al. (2012) Scrimgeour M., et al., 2012, Mon. Not. Roy. Astron. Soc., 425, 116
- Singal (2011) Singal A. K., 2011, Astrophys. J., 742, L23
- Soltis et al. (2019) Soltis J., Farahi A., Huterer D., Liberato C. M., 2019, Phys. Rev. Lett., 122, 091301
- Sun & Wang (2018) Sun Z. Q., Wang F. Y., 2018, Mon. Not. Roy. Astron. Soc., 478, 5153
- Tanvir et al. (2005) Tanvir N., Chapman R., Levan A., Priddey R., 2005, Nature, 438, 991
- Tarnopolski (2017) Tarnopolski M., 2017, Mon. Not. Roy. Astron. Soc., 472, 4819
- Tegmark et al. (1996) Tegmark M., Hartmann D. H., Briggs M. S., Meegan C. A., 1996, Astrophys. J., 468, 214
- Ukwatta & Wozniak (2016) Ukwatta T. N., Wozniak P. R., 2016, Mon. Not. Roy. Astron. Soc., 455, 703
- Vavrek et al. (2008) Vavrek R., Balazs L. G., Meszaros A., Horvath I., Bagoly Z., 2008, Mon. Not. Roy. Astron. Soc., 391, 1741
- Woosley & Bloom (2006) Woosley S. E., Bloom J. S., 2006, Ann. Rev. Astron. Astrophys., 44, 507
- Yoon et al. (2014) Yoon M., Huterer D., Gibelyou C., Kovács A., Szapudi I., 2014, Mon. Not. Roy. Astron. Soc., 445, L60
- Zhao et al. (2019) Zhao D., Zhou Y., Chang Z., 2019, Arxiv:1903.12401
- von Kienlin et al. (2014) von Kienlin A., et al., 2014, Astrophys. J. Suppl., 211, 13