ALMA observations require slower Core Accretion runaway growth
Abstract
Thanks to recent high resolution ALMA observations, there is an accumulating evidence for presence of giant planets with masses from to a few with separations up to AU in the annular structures observed in young protoplanetary discs. We point out that these observations set unique "live" constraints on the process of gas accretion onto sub-Jovian planets that were not previously available. Accordingly, we use a population synthesis approach in a new way: we build time-resolved models and compare the properties of the synthetic planets with the ALMA data at the same age. Applying the widely used gas accretion formulae leads to a deficit of sub-Jovian planets and an over-abundance of a few Jupiter mass planets compared to observations. We find that gas accretion rate onto planets needs to be suppressed by about an order of magnitude to match the observed planet mass function. This slower gas giant growth predicts that the planet mass should correlate positively with the age of the protoplanetary disc, albeit with a large scatter. This effect is not clearly present in the ALMA data but may be confirmed in the near future with more observations.
keywords:
planets and satellites: protoplanetary discs – planets and satellites: gaseous planets – planets and satellites: formation1 Introduction
In the Core Accretion paradigm, a solid core grows by accretion of solids (Safronov, 1972; Pollack et al., 1996). When the core mass reaches a critical value of , a gas envelope collapses onto the core, fuelling a phase of rapid gas accretion (Mizuno et al., 1978; Ikoma et al., 2000), during which the planet accretion rate is believed to be limited only by the rate at which the disc supplies it with gas. Detailed isothermal simulations showed that the planet may grow from the mass of to in a matter of less than ten thousand years (Bate et al., 2003; D’Angelo et al., 2003). In contrast, dispersal of protoplanetary discs takes Myr (Haisch et al., 2001). A planet is hence destined to become a massive gas giant if it enters the runaway accretion growth phase while the disc is still present.
This runaway gas accretion scenario produces a valley in the planet mass function from to or more (Ida & Lin, 2004a; Mordasini et al., 2009). Early exoplanet observations seemed to confirm this (e.g., see the red histogram in fig. 12 in Mayor et al., 2011). However, a number of new observational and theoretical arguments suggest that gas accretion onto planets is significantly less efficient than hitherto believed. Non-isothermal multi-dimensional simulations suggest that atmospheric circulation and inefficient radiative cooling may reduce accretion rates significantly (Ayliffe & Bate, 2009b, a; Ormel et al., 2015; Szulágyi et al., 2016; Szulágyi & Mordasini, 2017; Szulágyi, 2017; Cimerman et al., 2017; Lambrechts & Lega, 2017). This may explain why super-Earth planets with very modest gaseous atmospheres are abundant at separations of AU (Lee et al., 2014).
Additionally, the classical positive correlation of gas giants with host star metallicity (Fischer & Valenti, 2005), dominated by planets, was found to disappear at higher masses (Santos et al., 2017). The exact mass scale at which the switch in the metallicity correlations takes place is currently debated but is somewhere between (Schlaufman, 2018; Adibekyan, 2019; Maldonado et al., 2019; Goda & Matsuo, 2019). The trend is continuous into the brown dwarf regime (e.g., Troup et al., 2016), and suggests that at least a fraction of the most massive planets forms "as stars" – by disc fragmentation. This also suggests that gas accretion onto mass planets is inefficient as otherwise the positive host metallicity correlation of low mass “seed” giants would be passed on to higher mass planets, and even strengthened (Mordasini et al., 2012a).
Additional support for these ideas comes from the microlensing surveys sensitive to planets with separations of a few AU (Suzuki et al., 2016). The mass function of microlensing planets contains too many planets in the mass range compared with the runaway accretion scenario (Suzuki et al., 2018). The models were shown to fare better if gas accretion rate onto sub-Jupiter mass planets that open deep gaps in the disc and isolate themselves from the gas supply is reduced. In this scenario, may preferentially form by gravitational instability (Suzuki et al., 2018).
ALMA observations of annular structures (rings and gaps) in the dust emission of young protoplanetary discs at AU separations have been interpreted as signs of gas giant planets by many authors (ALMA Partnership et al., 2015; Dipierro et al., 2015; Dong et al., 2018; Long et al., 2018; Andrews et al., 2018). While other interpretations exist (see Discussion), it is important to ask what these candidate planets may mean for planet formation theories. Lodato et al. (2019) (L19 hereafter) considered evolutionary paths of these candidate planets, starting from their observed parameters, and found that they evolve into massive gas giants quickly. We ask a complementary question: how did the candidate planets evolve to be what they are now? These Million years old gaseous discs have not yet been dispersed and should fuel planetary growth, giving us the first ever time-resolved observational probe of runaway gas accretion. Furthermore, at large separations the runaway accretion should start at lower core masses (Piso et al., 2015) and terminate at larger masses (, because disc gap-opening is harder), producing a very wide valley from to , and an excess of planets.
2 The data
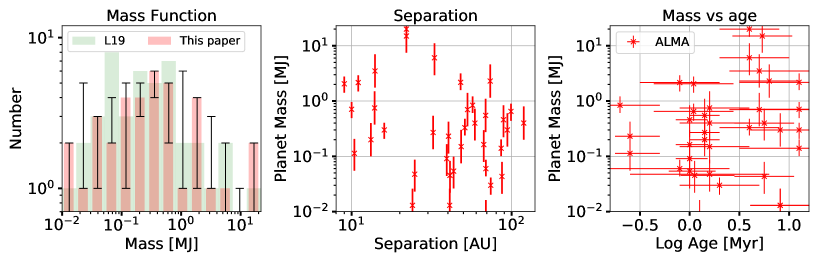
Table 1 shows the masses, separation and ages of the ALMA candidate planets that we use here. Our two major data sources are Long et al. (2018) and the DSHARP (Andrews et al., 2018; Huang et al., 2018) survey. The former lists dust gap widths , separations, , stellar masses, , and other relevant information. Following Lodato et al. (2019), we assume that the gap width scales with the planet Hill radius. Most of the hydrodynamical simulations to date have shown that corresponds to the range , where is the Hill radius for the planet of mass (e.g., Liu et al., 2019). We assume a reference value of to compute . The planet mass error bars are determined by solving for the maximum and minimum values of via the gap width parameters and , respectively. For several of the objects from the Long et al. (2018) sample, e.g., HL TAU and CI TAU, we instead rely on the results of published dedicated hydrodynamical simulations (Dipierro et al., 2015; Clarke et al., 2018). Zhang et al. (2018) lists DSHARP planet masses derived from detailed hydrodynamcal simulations, including error bars. From their Table 3 we use only model and DSD1 dust model, and omit the lower part of their table since most of the estimated masses there are consistent with 0 within the errors. For additional sources from other publications, TW Hya (Mentiplay et al., 2019), GY 91 (Sheehan & Eisner, 2018), HD 169142 (Pohl et al., 2017), PDS 70 (Keppler et al., 2019), we assume that the planet mass error is .
Fig. 1 shows the resulting planet mass histogram, the candidate planet mass versus separation, and mass versus age of the system. Our mass histogram (pale red with error bars) is rather similar to that derived by L19 (shown with the green colour).
3 Population synthesis modeling
In brief, to compare theoretical predictions to observations, we accept a simplified model for the protoplanetary disc structure and evolution. A massive core is then injected into the disc and allowed to grow and undergo the runaway gas accretion growth at rate , where is a dimensionless factor, and is the runaway rate given by one of three runaway models from the literature described below. The population synthesis is terminated at the age of the ALMA systems and the resulting planet masses are compared to those of the candidate ALMA planets. A reasonable agreement is found for .
We model the disc surface density as a power law in radius with a time dependent normalization,
| (1) |
where is the disc mass between radii AU and AU. The disc mass is evolved according to
| (2) |
where is the gas accretion rate onto the planet, and the disc dispersal time is Myr. The initial disk mass is a uniform random variable with the minimum and maximum disc masses of and , respectively, whereas stellar mass is . The disc is in a vertical hydrostatic equilibrium, i.e. the geometric aspect ratio is , where is the Boltzmann’s constant, is the gravitational constant, is the mean molecular weight where is the proton mass, and the disc midplane temperature is given by where K and AU. We fix the disc -viscosity parameter (Shakura & Sunyaev, 1973) at . The value of affects the disc gap opening condition, for which we follow Crida et al. (2006) results, and may also affect gas accretion rates onto the planets depending on the exact scenario described below.
A growing core is injected into the disc at separation , where is a random variable with a uniform distribution in the space between AU and AU. We neglect planet migration for clarity of the argument. The classical runaway accretion phase duration is as short as years (D’Angelo et al., 2003), implying that the orbital separation of the planet will shrink by a small fraction only during the runaway phase. For example, Dipierro et al. (2018) model the rings and gaps in the dusty disc of Elias 24 (one of the systems included in our paper). Their planet grows from mass of to in about years, during which it migrates from 65 AU to 61.7 AU only. Population synthesis with the three widely known models also shows that planets born beyond tens of AU do not start to migrate appreciably until the mass of (e.g., see Fig. 3 in Ida et al., 2018), which is more massive than most of the ALMA planets.
We tested two methods of injecting massive solid cores into the disc and obtained very similar results. In the first, the cores are injected into the disc with mass large enough (e.g., ) for the runaway accretion to start immediately, and the core injection time, , was a random variable distributed uniformly in the log space between Myr and Myr. In the second method, presented in the paper, the cores are injected in the disc at time with smaller initial mass, . The cores then accrete solids at a rate, , that is a uniform random variable in the space in the limits between yr-1 and yr-1. We found that choosing larger values of does not affect our conclusions on but reduces the number of sub-critical cores which have not yet entered the runaway valley. Choosing yr-1 leads to too few massive cores , and hence too few gas giants, failing to explain the data.
The gas envelope of the planet grows at the rate
| (3) |
where is the Kelvin-Helmholz timescale of the envelope (Ikoma et al., 2000; Ida & Lin, 2004a), which we write as
| (4) |
where is gas dust opacity in units of 1 cm2 g-1 (see eq. 10 in Ida et al., 2018, we set in this paper except for the Bern model). The total accretion rate of solids and gas is the sum . We terminate accretion of solids when 111Gas accretion dominates strongly at these masses anyway, but also ALMA observations show that the total disc dust masses are (Long et al., 2018; Dullemond et al., 2018).. The above model for planetary growth is capped by the disc-limited runaway gas accretion rate that is different for the three population synthesis scenarios explored below:
- •
-
•
In the Bern model (Mordasini et al., 2012b), the gas runaway accretion rate depends on whether the planet opened a deep gap in the disc or not. In the former case, . In the latter case, , where is the gas capture radius (their eq. 14). We employ the Crida et al. (2006) gap opening condition to select the appropriate limit. Following the authors, we use a reduced dust opacity .
-
•
In the Tanigawa & Tanaka (2016) (TT16 hereafter), the runaway gas accretion rate is the minimum of two expressions. The first, gas accretion in the embedded phase, is given by , where is the disc surface density perturbed by the presence of the planet, with the factor given by . The second is the maximum of the global viscous disc accretion rate, , specified previously, and the "local" rate (eq. 13 in Tanigawa & Tanaka, 2016) that is applicable only while the planet is clearing its local gas reserves. We neglect the latter phase for simplicity and note that its inclusion would require an even larger accretion rate suppression.
Finally, we apply the suppression factor for all the models and compare the three models with observation. We do not allow the planets to exceed the mass of in order to remain in the planetary regime.
4 Comparison of results to observations
L19 used population synthesis and asked how the ALMA planet candidates will evolve by the time their discs are dispersed. Here we ask a complementary question: can we form the observed population of ALMA planets within the widely accepted framework for planetary growth? Therefore, we terminate our population synthesis at the age of the ALMA discs. In practice, the termination time of our models is randomly selected from the list of the stellar ages (shown in Table 1), , multiplied by a random number between 0.5 and 1.5. This multiplication bears no practical importance but improves visibility of population synthesis planet ages in the figures.
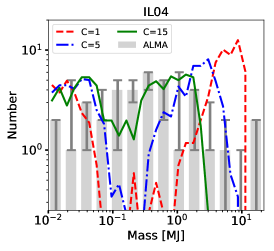
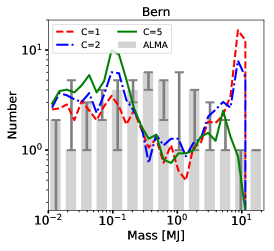
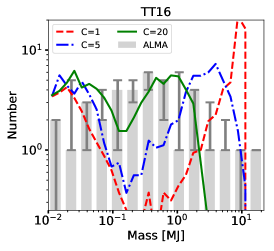
Fig. 2 compares the mass function of ALMA planets, shown with the gray histogram, with the resulting mass distribution of the three population synthesis calculations for various values of . The nominal runaway gas accretion models (red, ) are inconsistent with the data. The Bern model shows the smallest disagreement since its nominal accretion rate is lower than the two other models. In all cases there is a synthetic planet desert between the mass of to several . The population of very massive gas giants seen in the synthetic models should be easily observable in the ALMA data as such planets open gaps not only in dust but also in gas, but such planets are rare. Suppression of gas accretion rates by factors of reduces the disagreement between the models and the data. Qualitatively, the models with , 5 and 20, for the IL04, Bern and TT16 models, respectively, produce reasonable planet mass functions (solid green curves).
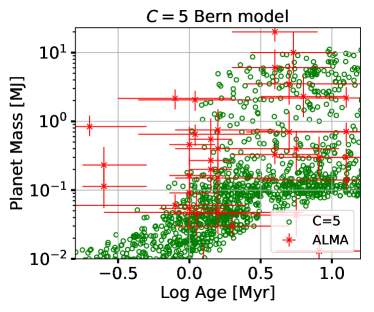
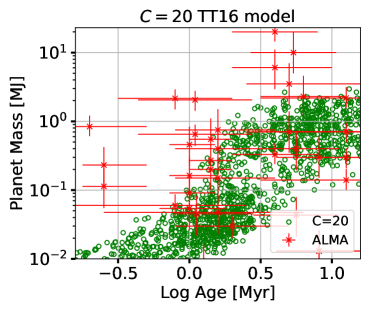
Fig. 3 shows the synthetic planet masses versus system ages for two of the models ( Bern and TT16 models), compared to ALMA data (red symbols with the error bars). The synthetic planets show a trend of increasing planet mass with the system age, which is to be expected. Synthetic planets more massive than are usually older than Myrs. It is not clear if the current ALMA data support or challenge theoretical predictions. There are several massive planets too young for their masses for the population models to reproduce, however the age estimates have significant uncertainties.
5 Discussion and Conclusions
We showed that the runaway gas accretion scenario predicts too few sub-Jupiter mass giants and too many planets compared with the candidate ALMA planets. Reduction in the efficiency of gas accretion by a factor of order 10 results in a better agreement of theory and observations.
Although icelines, dead zone transition, secular gravitational instability and other effects were proposed to explain the observed ringed dust structures instead of planets (Zhang et al., 2015; Pinilla et al., 2016; Flock et al., 2015; Takahashi & Inutsuka, 2014), these are not likely to account for most of the observations because there is no correlation between the structures and thermal disc properties, and because some of the rings are narrower than the disc scaleheight (Long et al., 2018; Huang et al., 2018; Zhang et al., 2018).
Some authors suggested that candidate planets are less massive than the typically inferred Saturn masses, e.g., in Boley (2017); in Dong et al. (2018). However, planets less massive than are unlikely to work for most sources as the disc viscosity parameter required in these scenarios, , is too small to account for the observed ring profiles (see §5.3 in Dullemond et al., 2018), and also cannot explain the observed stellar accretion rates, assuming a viscous angular momentum transport in the disc (see Clarke et al., 2018). Furthermore, runaway gas accretion sets in at lower core masses – as low as at wide separations (Piso & Youdin, 2014). Therefore, the exact planet masses are not crucial for validity of our argument as long as the planets are more massive than ; the runaway gas accretion would still happen and the results would then diverge from the ALMA observations significantly. There are also suggestions that planets may be larger, e.g., (Bae et al., 2018). However, planets are inside the “forbidden” middle region of the runaway valley. The mere (wide-spread) existence of such planets at large separations would again challenge an unabated runaway growth scenario. On the other hand, the number of planets in ALMA discs may be smaller since planets may open more than one gap for low disc viscosities (Dong et al., 2018).
Based on observations of planets at separations less than a few AU, gas giant planets were suggested to not grow via the Core Accretion scenario beyond the gap-opening mass (e.g., Ida & Lin, 2004a, b; Santos et al., 2017; Suzuki et al., 2018). Our results extend these suggestions in several ways. Firstly, ALMA planet candidates are separated by AU from their host stars. Further, their gaseous discs are not yet dispersed, so yield "live" constraints on the process of planet accretion. Finally, most of the planet candidates are not massive enough to open significant gaps in the gas (Dipierro et al., 2015; Clarke et al., 2018; Dipierro & Laibe, 2017), so their low gas accretion rates cannot be explained by gap opening.
One reason for the inefficiency of gas accretion may be dust opacity. To obtain the envelope contraction time scales within a few Myr, dust opacity is typically assumed to be times lower than the interstellar dust opacity due to dust growth (Pollack et al., 1996; Papaloizou & Nelson, 2005; Lissauer et al., 2009; Ayliffe & Bate, 2012; Piso et al., 2015). However, dust growth could be counteracted by grain fragmentation (Dullemond & Dominik, 2005; Helled & Bodenheimer, 2011; Mordasini, 2013), an effect that increases the opacity. Further, composition of gas envelopes of giant planets may be strongly over-abundant in metals and dust for two reasons: (i) the bulk composition of planets is significantly over-abundant in metals compared to their parent stars (Miller & Fortney, 2011); and (ii) gas giant planets tend to be found preferentially around metal-rich stars (Fischer & Valenti, 2005). These two effects may increase envelope dust opacity by a factor of a few to ten compared with that of the interstellar medium at Solar metallicity. Ayliffe & Bate (2009a) finds that gas accretion rate onto a core is at least an order of magnitude lower for the full insterstellar dust opacity case compared with that for opacity reduced by a factor of 100.
Additionally, classic hydrostatic calculations of envelope contraction (e.g., Ikoma et al., 2000) assumed 1D geometry. Modern 3D simulations (Szulágyi et al., 2014; Ormel et al., 2015; Fung & Chiang, 2016; Lambrechts & Lega, 2017) show that there is not only an inflow but also an outflow from the Hill sphere of the planet. This outflow is part of the meridional circulation between the circumstellar and circumplanetary discs in the case of giant planets (Szulágyi et al., 2014; Fung & Chiang, 2016). In the terrestrial regime, a similar recycling of gas within the Bondi-radius has been found (Ormel et al., 2015). In both planetary mass regimes, the gas flow enters the Hill sphere from the vertical directions and leaves through the midplane region, leading to a reduction in the gas accretion rate.
Acknowledgements
SN acknowledges support from STFC grants ST/N000757/1 and ST/M006948/1 to the University of Leicester. G.D. acknowledges financial support from the European Research Council (ERC) under the European Union’s Horizon 2020 research and innovation programme (grant agreement No 681601). J.Sz. acknowledges the funding from the the Swiss National Science Foundation (SNSF) Ambizione grant PZ00P2_174115.
References
- ALMA Partnership et al. (2015) ALMA Partnership et al., 2015, ApJ, 808, L3
- Adibekyan (2019) Adibekyan V., 2019, arXiv e-prints,
- Andrews et al. (2018) Andrews S. M., et al., 2018, ApJ, 869, L41
- Ayliffe & Bate (2009a) Ayliffe B. A., Bate M. R., 2009a, MNRAS, 393, 49
- Ayliffe & Bate (2009b) Ayliffe B. A., Bate M. R., 2009b, MNRAS, 397, 657
- Ayliffe & Bate (2012) Ayliffe B. A., Bate M. R., 2012, MNRAS, 427, 2597
- Bae et al. (2018) Bae J., Pinilla P., Birnstiel T., 2018, ApJ, 864, L26
- Bate et al. (2003) Bate M. R., Bonnell I. A., Bromm V., 2003, MNRAS, 339, 577
- Boley (2017) Boley A. C., 2017, ApJ, 850, 103
- Cimerman et al. (2017) Cimerman N. P., Kuiper R., Ormel C. W., 2017, MNRAS, 471, 4662
- Clarke et al. (2018) Clarke C. J., et al., 2018, ApJ, 866, L6
- Crida et al. (2006) Crida A., Morbidelli A., Masset F., 2006, Icarus, 181, 587
- D’Angelo et al. (2003) D’Angelo G., Henning T., Kley W., 2003, ApJ, 599, 548
- Dipierro & Laibe (2017) Dipierro G., Laibe G., 2017, MNRAS, 469, 1932
- Dipierro et al. (2015) Dipierro G., Price D., Laibe G., Hirsh K., Cerioli A., Lodato G., 2015, MNRAS, 453, L73
- Dipierro et al. (2018) Dipierro G., et al., 2018, MNRAS, 475, 5296
- Dong et al. (2018) Dong R., Li S., Chiang E., Li H., 2018, ApJ, 866, 110
- Dullemond & Dominik (2005) Dullemond C. P., Dominik C., 2005, A&A, 434, 971
- Dullemond et al. (2018) Dullemond C. P., et al., 2018, ApJ, 869, L46
- Fischer & Valenti (2005) Fischer D. A., Valenti J., 2005, ApJ, 622, 1102
- Flock et al. (2015) Flock M., Ruge J. P., Dzyurkevich N., Henning T., Klahr H., Wolf S., 2015, A&A, 574, A68
- Fung & Chiang (2016) Fung J., Chiang E., 2016, ApJ, 832, 105
- Goda & Matsuo (2019) Goda S., Matsuo T., 2019, ApJ, 876, 23
- Haisch et al. (2001) Haisch Jr. K. E., Lada E. A., Lada C. J., 2001, ApJ, 553, L153
- Helled & Bodenheimer (2011) Helled R., Bodenheimer P., 2011, Icarus, 211, 939
- Huang et al. (2018) Huang J., et al., 2018, ApJ, 869, L42
- Ida & Lin (2004a) Ida S., Lin D. N. C., 2004a, ApJ, 604, 388
- Ida & Lin (2004b) Ida S., Lin D. N. C., 2004b, ApJ, 616, 567
- Ida et al. (2018) Ida S., Tanaka H., Johansen A., Kanagawa K. D., Tanigawa T., 2018, ApJ, 864, 77
- Ikoma et al. (2000) Ikoma M., Nakazawa K., Emori H., 2000, ApJ, 537, 1013
- Keppler et al. (2019) Keppler M., et al., 2019, arXiv e-prints,
- Lambrechts & Lega (2017) Lambrechts M., Lega E., 2017, A&A, 606, A146
- Lee et al. (2014) Lee E. J., Chiang E., Ormel C. W., 2014, ApJ, 797, 95
- Lissauer et al. (2009) Lissauer J. J., Hubickyj O., D’Angelo G., Bodenheimer P., 2009, Icarus, 199, 338
- Liu et al. (2019) Liu Y., et al., 2019, A&A, 622, A75
- Lodato et al. (2019) Lodato G., et al., 2019, MNRAS, 486, 453
- Long et al. (2018) Long F., et al., 2018, preprint, (arXiv:1810.06044)
- Maldonado et al. (2019) Maldonado J., Villaver E., Eiroa C., Micela G., 2019, arXiv e-prints,
- Mayor et al. (2011) Mayor M., et al., 2011, ArXiv e-prints (astro-ph 1109.2497),
- Mentiplay et al. (2019) Mentiplay D., Price D. J., Pinte C., 2019, MNRAS, 484, L130
- Miller & Fortney (2011) Miller N., Fortney J. J., 2011, ApJ, 736, L29
- Mizuno et al. (1978) Mizuno H., Nakazawa K., Hayashi C., 1978, Progress of Theoretical Physics, 60, 699
- Mordasini (2013) Mordasini C., 2013, A&A, 558, A113
- Mordasini et al. (2009) Mordasini C., Alibert Y., Benz W., Naef D., 2009, A&A, 501, 1161
- Mordasini et al. (2012a) Mordasini C., Alibert Y., Benz W., Klahr H., Henning T., 2012a, A&A, 541, A97
- Mordasini et al. (2012b) Mordasini C., Alibert Y., Klahr H., Henning T., 2012b, A&A, 547, A111
- Ormel et al. (2015) Ormel C. W., Shi J.-M., Kuiper R., 2015, MNRAS, 447, 3512
- Papaloizou & Nelson (2005) Papaloizou J. C. B., Nelson R. P., 2005, A&A, 433, 247
- Pinilla et al. (2016) Pinilla P., Flock M., Ovelar M. d. J., Birnstiel T., 2016, A&A, 596, A81
- Piso & Youdin (2014) Piso A.-M. A., Youdin A. N., 2014, ApJ, 786, 21
- Piso et al. (2015) Piso A.-M. A., Youdin A. N., Murray-Clay R. A., 2015, ApJ, 800, 82
- Pohl et al. (2017) Pohl A., et al., 2017, ApJ, 850, 52
- Pollack et al. (1996) Pollack J. B., Hubickyj O., Bodenheimer P., Lissauer J. J., Podolak M., Greenzweig Y., 1996, Icarus, 124, 62
- Safronov (1972) Safronov V. S., 1972, Evolution of the protoplanetary cloud and formation of the earth and planets.. Jerusalem (Israel): Israel Program for Scientific Translations, Keter Publishing House, 212 p.
- Santos et al. (2017) Santos N. C., et al., 2017, preprint, (arXiv:1705.06090)
- Schlaufman (2018) Schlaufman K. C., 2018, ApJ, 853, 37
- Shakura & Sunyaev (1973) Shakura N. I., Sunyaev R. A., 1973, A&A, 24, 337
- Sheehan & Eisner (2018) Sheehan P. D., Eisner J. A., 2018, ApJ, 857, 18
- Suzuki et al. (2016) Suzuki D., et al., 2016, ApJ, 833, 145
- Suzuki et al. (2018) Suzuki D., et al., 2018, ApJ, 869, L34
- Szulágyi (2017) Szulágyi J., 2017, ApJ, 842, 103
- Szulágyi & Mordasini (2017) Szulágyi J., Mordasini C., 2017, MNRAS, 465, L64
- Szulágyi et al. (2014) Szulágyi J., Morbidelli A., Crida A., Masset F., 2014, ApJ, 782, 65
- Szulágyi et al. (2016) Szulágyi J., Masset F., Lega E., Crida A., Morbidelli A., Guillot T., 2016, MNRAS, 460, 2853
- Takahashi & Inutsuka (2014) Takahashi S. Z., Inutsuka S.-i., 2014, ApJ, 794, 55
- Tanigawa & Tanaka (2016) Tanigawa T., Tanaka H., 2016, ApJ, 823, 48
- Troup et al. (2016) Troup N. W., et al., 2016, AJ, 151, 85
- Zhang et al. (2015) Zhang K., Blake G. A., Bergin E. A., 2015, ApJ, 806, L7
- Zhang et al. (2018) Zhang S., et al., 2018, ApJ, 869, L47
Appendix A Data table
| Source | Age [Myr] | Sep [AU] | Planet mass [] |
|---|---|---|---|
| RY TAU | 1.00 | 43.41 | 0.054 |
| UZ TAUE | 1.26 | 69.00 | 0.009 |
| DS TAU | 3.98 | 32.93 | 6.058 |
| FT TAU | 1.58 | 24.78 | 0.048 |
| MWC 480 | 6.31 | 73.43 | 2.300 |
| DN TAU | 2.51 | 49.29 | 0.005 |
| GO TAU | 5.62 | 58.91 | 0.399 |
| GO TAU | 5.62 | 86.99 | 0.043 |
| IQ TAU | 1.12 | 41.15 | 0.045 |
| DL TAU | 1.00 | 39.29 | 0.091 |
| DL TAU | 1.00 | 66.95 | 0.163 |
| DL TAU | 1.00 | 88.90 | 0.459 |
| CI TAU | 1.58 | 13.92 | 0.750 |
| CI TAU | 1.58 | 48.36 | 0.150 |
| CI TAU | 1.58 | 118.99 | 0.400 |
| HL TAU | 1.41 | 13.20 | 0.200 |
| HL TAU | 1.41 | 32.30 | 0.270 |
| HL TAU | 1.41 | 68.80 | 0.550 |
| AS 209 | 1.10 | 9.00 | 2.050 |
| AS 209 | 1.10 | 99.00 | 0.650 |
| EL 24 | 0.20 | 57.00 | 0.840 |
| EL 27 | 0.79 | 69.00 | 0.060 |
| GW Lup | 2.00 | 74.00 | 0.030 |
| HD 142666 | 12.59 | 16.00 | 0.300 |
| HD 143006 | 3.98 | 22.00 | 20.000 |
| HD 143006 | 3.98 | 51.00 | 0.330 |
| HD 163296 | 12.59 | 10.00 | 0.710 |
| HD 163296 | 12.59 | 48.00 | 2.180 |
| HD 163296 | 12.59 | 86.00 | 0.140 |
| SR 4 | 0.79 | 11.00 | 2.160 |
| GY 91 | 0.25 | 10.40 | 0.113 |
| GY 91 | 0.25 | 40.30 | 0.232 |
| GY 91 | 0.25 | 68.90 | 0.002 |
| TW Hya | 8.13 | 24.00 | 0.013 |
| TW Hya | 8.13 | 41.00 | 0.013 |
| TW Hya | 8.13 | 94.00 | 0.300 |
| HD 169142 | 5.01 | 14.00 | 3.500 |
| HD 169142 | 5.01 | 53.00 | 0.700 |
| PDS 70 | 5.37 | 22.00 | 15.000 |