SOFIA Far-infrared [O III] and [O I] Observations of Dense CO-knots in the Supernova Remnant Cassiopeia A: Multi-phase Ejecta
Abstract
Dense, fast-moving ejecta knots in supernova remnants are prime sites for molecule and dust formation. We present SOFIA far-IR spectrometer FIFI-LS observations of CO-rich knots in Cas A which cover a 1 square arc minute area of the northern shell, in the [O III] 52 and 88m and [O I] 63m lines. The FIFI-LS spectra reveal that the line profiles of [O III] and [O I] are similar to those of the Herschel PACS [O III] and CO lines. We find that the [O III] maps show very different morphology than the [O I] map. The [O III] maps reveal diffuse, large-scale structures and the ratio of the two [O III] lines imply the presence of gas with a range of density 500 - 10,000 cm-3 within the mapped region. In contrast, the [O I] map shows bright emission associated with the dense CO-rich knots. The 63m [O I] line traces cooled, dense post-shocked gas of ejecta. We find that IR-dominated [O III] emission is from post-shocked gas based on its morphology, high column density, and velocity profile. We describe multi-phase ejecta knots, a lifetime of clumps, and survival of dust in the young supernova remnants.
Subject headings:
astrochemistry:oxygen - infrared:supernova remnants - ISM:individual objects (Cas A) - dust:shock waves1. Introduction
Massive stars (8 M⊙) eject much of the elements synthesized over its lifetime back into the interstellar medium (ISM) at the end of its lifetime. This is one of the main ways in which a galaxy’s metallicity is increased, thereby enriching the next generation of stars and planets (Pagel, 1997). Supernova are also a main source of kinetic energy for the ISM, stirring up the gas, providing turbulent support to the ISM and processing interstellar dust through powerful shocks (Tielens, 2005). Instabilities create dense clumps in the ejecta (Hammer et al., 2010) and hundreds of such dense Fast Moving Knots (FMKs) are commonly observed in type II supernova remnants (SNRs), containing a substantial fraction of the supernova ejecta and its kinetic energy (Fesen, 2001). The high density of these knots is conducive to molecule and dust formation (Sarangi & Cherchneff, 2015; Sluder et al., 2018). However, whether dust can survive the reverse shock is still not clear (Nozawa et al., 2007; Nath et al., 2008; Silvia et al., 2012; Biscaro & Cherchneff, 2016).
Understanding the formation and survival of supernova dust has gotten additional impetus with the recent Herschel detection of copious amounts of dust in SNRs, Cas A (0.1-0.6M⊙), SN 1987A (0.5M⊙) and G54.1+0.3 (0.1-0.9M⊙) (Barlow et al., 2010; De Looze et al., 2017; Matsuura et al., 2011; Rho et al., 2018), as well the detection of copious amounts of dust in the early universe (Laporte et al., 2017; Spilker et al., 2018), which is often ascribed to injection by supernovae (Pei et al., 1991; Cherchneff & Dwek, 2010). Understanding the characteristics of dense knots in SNRs and their interaction with the reverse shock and eventual dispersion and merging with the ISM is therefore a key question for the evolution of galaxies and the cosmic history of dust.
Cassiopeia A (Cas A) is one of the youngest Galactic SNRs with an age of 350 yr and its progenitor is believed to be a Wolf-Rayet star with a mass of 15-25 M⊙ (Krause et al., 2008). [O I] observation was reported by Docenko & Sunyaev (2010, DS10) with ISO/LWS. The Herschel Space Observatory detected 88m [O III] lines, and high-J rotational CO lines (Wallström et al., 2013, W13). We report [O I] and [O III] maps toward the northern part of Cas A over a 1 square arc minute with SOFIA Field-Imaging Far-Infrared Line Spectrometer (FIFI-LS), and this letter is one of the first observations with FIFI-LS.
2. Observations
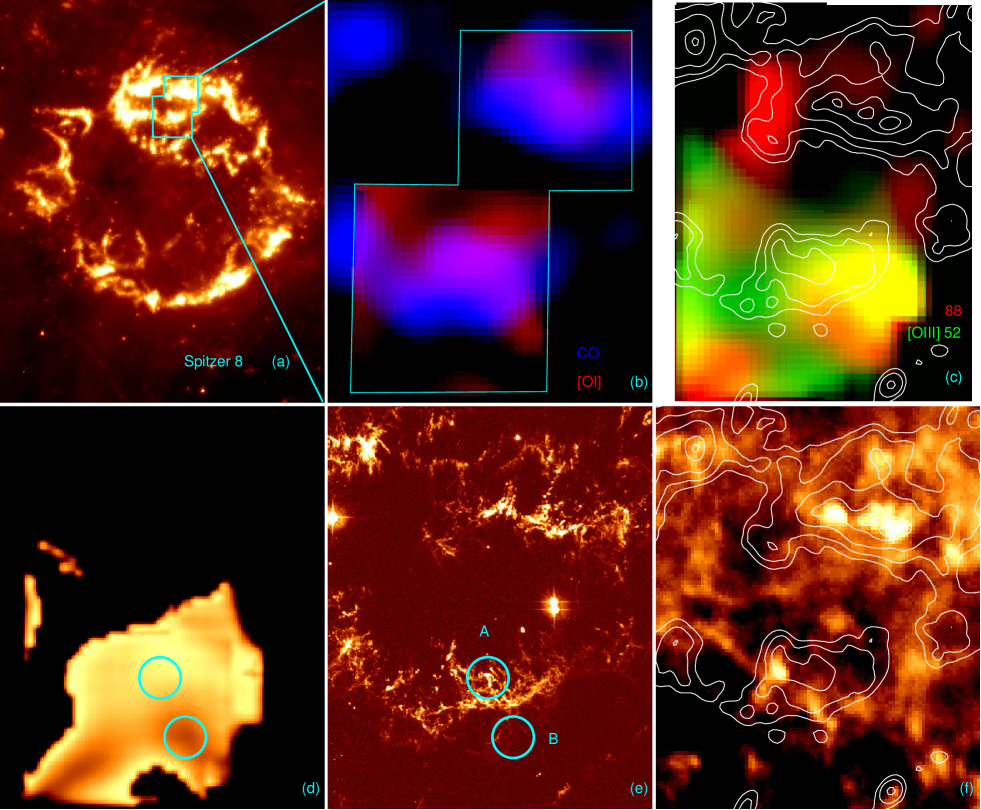
We have targeted a region in the north of Cas A with FIFI-LS on the SOFIA 2.5-m telescope, for the lines of [O III] at 52 and 88m and [O I] at 63m. The observations covered two partially overlapping 30′′x30′′ regions as shown in Figure 1a where two observations of NW (knot2) and SE (knot1) fields were combined. The SE location (knot1) is first recognized as Ne-rich crescent-shaped (a.k.a. Ne moon) region (Ennis et al., 2006), and CO-rich knots (see Fig. 4 of Rho et al., 2012). The [O III] at 52m and 88m, and [O I] at 63m observations took place on 2014 April 26, and additional observations for the [O III] at 52 and 88m took place on 2015 October 14 and 21 (PROG_ID of 02_0058 and 03_0051; PI. Tielens). The on-source exposures are 69, 86, and 43 min for [O I] 63m, [O III] 52 and 88m, respectively. A chopping/nodding mode was used with a chop throw of 300′′, and FIFI-LS covers a field of view (FOV) of 30′′30′′ in the lines we present. FIFI-LS spectral cube has a sampling with a pixel size of 1′′, and the spatial resolution of the blue (51-120m) channel is 6′′ (Colditz et al., 2018) because of a better spatial sampling and more efficient dithering than the default spectroscopy mode of Herschel PACS (W13). The pointing stability of SOFIA is better than 0.4′′ (Temi et al., 2018). The data used is the FIFI-LS pipeline version of 1_3_3 produced by SOFIA Science Center.
FIFI-LS calibration uncertainty on the blue channel is at 15% level, and line observations are corrected for atmospheric absorption and telluric features by the SOFIA FIFI-LS team using ATRAN models. We checked the atmospheric transmission (0.8) curve for each line, and the primary line structures and fluxes are not significantly affected but it may add some uncertainty (20%). The spectral cube was reduced using the Python GUI software SOSPEX111https://github.com/darioflute/sospex/ (Fadda & Chambers, 2018). We obtained consistent results by using the other data reduction methods such as fluxer”222http://www.ciserlohe.de/fluxer/fluxer.html and our own IDL extraction routines.
3. Results
We extracted FIFI-LS spectra from the central area (a 9′′x9′′ area centered on R.A. and Dec. 50, J2000) of the PACS observations (W13) as shown in Figure 2. The surface brightness of [O I] and [O III] lines listed in Table 1A are comparable to those from ISO (a beam size of 80′′, # 2 of DS10) and PACS (W13) within a factor of 1.2-2.6.
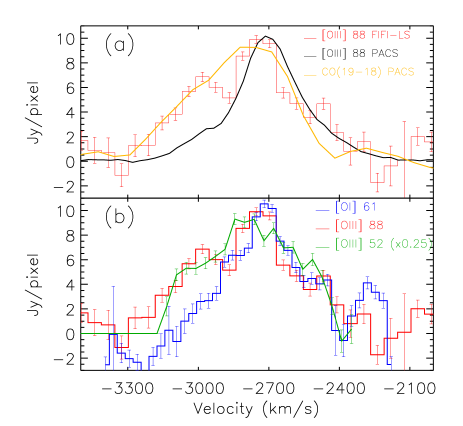
For detailed comparison, we extracted PACS 88m [O III] spectra from archival data to match the exact extraction area of two different missions and instruments. We note that recently processed PACS data (version v14.2.0) yield fainter brightness (in Table 1) than the one by Wallström et al. (2013). The FIFI-LS 88m [O III] line brightness is 60% smaller than that of the PACS spectrum and the line profiles show 400-600 km s-1. We use 60% as our systematic uncertainty of the brightness, which would not change our main science results considering that the SNR is a diffuse source.
| Table 1A | Wavelength | Wavelength | Shift | FWHM | FWHM | Surface Brightness | |
| Line | bandwidth(m) | center (m) | (km s-1) | (m) | (km s-1) | (erg s-1 cm-2 sr-1) | |
| [O III] | 51.27-51.56 (51.29-51.72)a | 51.33570.0089 | -277252 | 0.09240.0327 | 540190 | 1.8410.092 10-3 | |
| [O III] | 87.04-88.05 (87.36-88.34) | 87.54450.0150 | -275551 | 0.15010.0260 | 51489 | 2.7000.117 10-4 | |
| [O III] | PACSa: 85.27-89.14 | 87.55940.0100 | -267835 | 0.09600.0016 | 32907 | 4.3600.065 10-4 | |
| [O I] | 62.41-62.96 (62.43-62.98) | 62.61380.0127 | -270661 | 0.09640.0447 | 461214 | 4.0270.328 10-4 | |
| Table 1B | |||||||
| Regionb | 5007Åc | 52m | |||||
| (erg s-1 cm-2 sr-1) | (erg s-1 cm-2 sr-1) | ||||||
| A (Ejecta) | 3.650.14 10-2 | 17.76.0 10-4 | 8 | 207 | 0.05 | 0.006 | |
| B (IR-[O III]) | 4.600.50 10-3 | 8.24.1 10-4 | 2 | 5.63.0 | 0.36 | 0.18 | |
| Table 1C | density | temperature | column density | Rd | Einstein A | Pressure | |
| Emission | n(cm-3) | T (K) | (cm-2) | (cm) | (s-1) | (cm-3 K) | |
| IR [O III]e | 500 | 6600 | 1016 | 21013/ | A(52)=9.8E-5 | 3106 | |
| Optical [O III]f | 104 | 6000 | 1015 | 1011/ | A(5007)=2E-2 | 1108 | |
| IR [O I] | 106 | … | 21015 | 2109/ | A(63)=8.9E-5 | … | |
| CO | 106 | 400, 2000 | 51017 | 51011/ | … | (5-10)108 |
a The wavelength bandwidth in parenthesis is the coverage for the northwestern region.
b Regions A and B are marked in Figure 1d and Figure 1e.
c The optical flux is extinction corrected.
d R is the thickness of the emitting region and is a filling factor.
e,f “IR [O III]” is IR-bright and optical dim [O III] region estimated from Region A”,
and Optical [O III]” is optical-bright and IR dim [O III] region estimated from Region B”.
We present velocity integrated maps (the velocity range is from -3300 to -2400 km s-1; see Fig. 2) of [O I] 63, [O III] 52 and 88m maps in Figure 1. The 88m FIFI-LS map is consistent with that of PACS although the existing PACS data have only 25 spatial pixels as the region was undersampled. Both 88 and 52m [O III] maps show very different structure from the [O I] map. The [O I] 63m map reveals clumpy structures and bright emission associated with the dense ejecta and CO-rich knots Rho et al. (2008) in Figure 1b. In contrast, the [O III] 52 and 88m maps show mostly diffuse, large-scale structures and bright emission clearly present outside of the region of dense ejecta knots in Figure 1c. The 63m [O I] line is 50% brighter than the 88m [O III] line and 22% of 52 m [O III] brightness, as listed in Table 1A.
We estimated the ratio of [O III] 52 and 88m maps since the ratio is a density indicator (see Fig. 3 and discussion below). We used the pixels with positive values for both 52 and 88 m emission, where the NW regions (knot2) within the observed FOV show weak [O III] emission. We find ratios between 2 and 9 (Fig. 1d).
4. Discussion
High-J CO emission with Herschel (W13) together with Spitzer, AKARI, and ground-based IR studies (Rho et al., 2009, 2012) of dense clumps in Cas A have revealed large column densities (41017 cm-2) of warm, dense CO gas (W13). The theoretical model of Biscaro & Cherchneff (2014) suggested that CO molecules are destroyed in the reverse shock but rapidly reformed in the postshock gas. As a result of the large density contrast between the dense knots and their surroundings, the reverse shock driven into the knots is relatively weak and dust can survive in the CO-rich gas. Morphologically, the 63m [O I] emission (Fig. 1b) is closely related to dense ejecta/CO-knot emission. The [O I] line traces cooled, dense post-shocked gas of ejecta and the luminosity of [O I] for 9′′9′′ area is 0.5 L⊙. Because of its high critical density, the [O I] emission likely arises from very dense (105-6 cm-3) post-shock gas, with a high column density of 21015 cm-2 (Table 1A); these physical properties are consistent with the theoretical shock models (Borkowski & Shull, 1990, DS10).
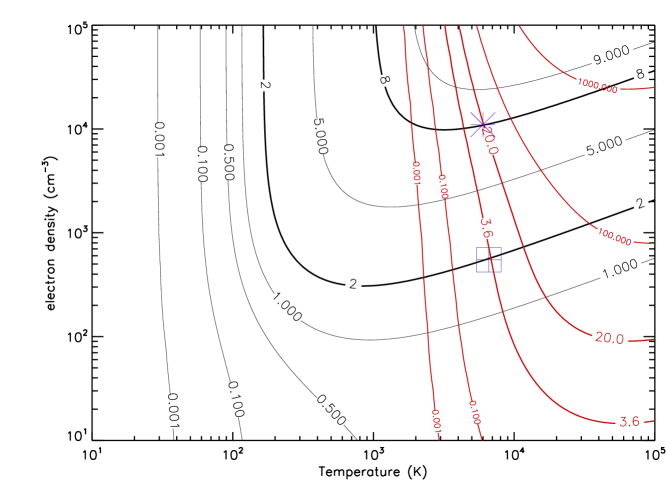
Based on the energy levels of the ground-state atomic fine structure, the ratios of [O III] lines constrain the density and temperature of the emitting region, independent of the geometry. We generated the set of [O III] IR line ratio between 52m and 88m with a grid of density and temperature (see Reach & Rho, 2000) and the line diagnostic model (see also Osterbrock, 1988) is shown in Figure 3. The IR [O III] line ratio between [O III] 52m and 88m ranges from 2 to 9, and the IR [O III] line diagnostic implies a density range of 300 - 5104 cm-3 (and a temperature 100 K). The ratio map in Figure 1d corresponds to a density map, indicating a higher density at the ejecta and neighboring region, but the ratio map differs from the ejecta map.
The [O III] far-IR morphology of 52m and 88m emission in Figure 1c differs from the dense ejecta emission seen in optical [O III], infrared Ar ejecta, and 63m [O I] emission. The optical [O III] emission at 5007Å shows bright knots at the ejecta position, and the optical [O III] is faint outside the ejecta (Figure 1e). The HST optical [O III] emission is found near the reverse shock and shocked gas from a cooling post-shock region (Fesen, 2001; Morse et al., 2004).
What is the origin of far-IR [O III] Itoh (1981) estimated 70% of 52m [O III] is from shocked gas using a collisional ionization equilibrium (CIE) model, and the model by Sutherland & Dopita (1995) predicts bright [O III] below 20,000 K. To understand the origin and physical condition of IR-emitting [O III] emission, we selected two regions, one (Region A, see Figs. 1d, 1e) with the high ratio of 52/88m () of 8 which coincides with dense ejecta (centered on R.A. and Dec. 50), and the other (Region B) with the low of 2 which is outside the ejecta emission (centered on R.A. and Dec. 49). Region A” is the compact dense ejecta region, optical-[O III] bright and CO/[O I] emitting region, and Region B” is IR-[O III] bright region. We have measured the brightness of [O III] 5007Å, 52m and 88m for a 6′′ circular aperture. In Table 1B, the brightness and the ratios are listed. We used HST ACS F475W image which contains both 5007 and 4959Å lines (Fesen et al., 2006) and we assumed 3/4 of optical emission is from 5007Å [O III] line and the extinction is Av = 5.7 mag (Hurford & Fesen, 1996). When we compare the line ratios of and with the line diagnostics in Figure 3, IR-[O III] bright regions (Region B) are dominated by gas with an electron density and temperature of (ne, T) = (500 cm−3, 6000 K). Optical-[O III] bright, dense knots (Region A) are dominated by gas with (104 cm−3, 6600 K). The densities are much less than the densities from the CO observations (106 cm-3, W13) or the density required to collisionally excite the [O I] line.
We compare the optical and IR [O III] with Chandra X-ray map. The optical [O III] emission is well correlated with the IR dense (Ar) ejecta from Spitzer IRAC 8m map. The X-ray gas appears outside the dense optical ejecta (Region A) as shown in Figures 1e and 1f and is in some degree associated with IR-[O III] bright region. Indications of ejecta knot mass stripping in Cas A have been reported (Fesen et al., 2011).

We estimated the oxygen column density and abundance of oxygen. The column density is for each line, where is the surface brightness, is the line Einstein coefficient, is the Planck constant, and is the frequency. We summarize the physical properties of IR [O III], optical [O III], IR [O I], and CO emitting regions in Table 1C. The column densities of 52 and 88m [O III] lines are of an order of 1016 cm-2 and are comparable to those of 63m [O I] line and optical emission.
Shock models predict bright [O III] emission arising from the preshock gas photo-ionized by the shock emission and the postshock cooling and recombining gas. Such regions are called Photo-Ionized Regions (PIR). It is tempting to associate the low density gas bright in the IR but not the optical [O III] lines (Region B) with the preshock PIR while the denser optically bright [O III] emission (Region A) would naturally arise from the postshock gas (Fesen et al., 2011; Docenko & Sunyaev, 2008). Given the uncertainties in the shock models, the observed IR-[O III] intensities and derived column densities, densities and temperatures are in good agreement with calculated post-shock models (Sutherland & Dopita, 1995, DS10). However, the morphology of the [O III] emission is not in agreement with this interpretation. The PIR gas should be in the region interior to the reverse shock; e.g., deep within the FMK. Observationally, this gas is very diffuse and surrounds the dense clumps and, hence, it should be postshock gas. So, rather than PIR gas, we surmise that the IR bright/optically dim [O III] emitting gas is associated with the evaporating gas in the surfaces of the shocked clumps driven by electron conduction (Borkowski & Shull, 1990). Another evidence that IR [O III] emission is post-shocked gas comes from the velocity information. The velocity profiles of [O III] are the same as that from shocked gas of 63m [O I] line. Unshocked gas using Spitzer [O IV] line (from the central region) indicates the velocity for the gas toward us peaks at -2000 km s-1. We expect to observe a difference in velocity between shocked and unshocked gas and this is not the case for IR [O III] lines as shown in Figure 2.
The observed CO and [O I] emission is most naturally associated with postshock gas that has had time to cool, recombine and form molecules (Biscaro & Cherchneff, 2014). This gas is directly related therefore to the [O III] emitting gas. The pressure of the optically bright [O III] emitting gas is 108 cm-3 K as summarized in Table 1C. This is a little less than the pressure derived from the CO observations of 5108 cm-3 K (W13). The agreement in morphology supports this interpretation. In contrast, the low density, IR bright [O III] emitting gas has a gas pressure of 3106 cm-3 K; much less than the pressure of the postshock gas. Momentum conservation in the evaporating gas requires with the pressure in the the postshock gas and where we have neglected the gas pressure in the flow. This results in a flow velocity of 3 km/s, or — as expected — about the sound speed, of an oxygen gas at 6000 K.
The mass loss rate of the clumps as measured by the evaporation flow is then,
| (1) |
where is the radius of the emitting region ( cm), the density (500 cm-3) and the oxygen mass. The lifetime of the clumps is
| (2) |
with the column density of the clump. This column density is at least equal to the postshock column density which is equal to with N and X the CO column density and abundance. Observationally, CO is more abundant than O in the postshock gas and this would imply a lifetime of the clumps at least comparable to the lifetime of the remnant. For calculated CO abundances of 10-2 (Biscaro & Cherchneff, 2014), the expected lifetime is some 3104 yr and the knots may well survive the SNR phase. Finally, we note that the optical knots show variations on a timescale of tens of years (Fesen et al., 2011) and we attribute this to variable geometric structure associated with the heavily corrugated surface of the clumps, reflecting the effects of the Rayleigh Taylor instabilities.
Figure 4 illustrates the structure of the region in a cartoon, identifying the different zones present in this region. The knots are oxygen-rich gas traversed by a 200 km s-1 (reverse) shock. The hot (106 K) gas layer immediately behind the shock is very thin. The optical bright [O III] gas represents the cooling and recombining postshock gas, once the gas has cooled down and recombined, CO is formed and it as well as [O I] are the dominant coolant of this gas. The evaporating surface layers are bright in the IR [O III] lines but not the optical lines. Eventually, this evaporating gas will mix into the dominant X-ray emitting gas that fills the interior of the remnant (Fesen et al., 2011; Patnaude & Fesen, 2014). This flux of evaporating gas is driven by heat conduction due to the fast electrons in the X-ray plasma.
The CO/[O I] emitting layers are postshock gas (e.g., material processed by a 200 km s-1 shock) and now cooled down. For the CO/[O I] emitting layers that have a density of 105-6 cm-3, the velocity in the knot (Vk) ranges 6 - 20 km s-1 where C-shock is dominated. Grain sputtering requires a velocity greater than 50 km s-1 (Draine, 1995; Tielens et al., 1994). IR-[O III] emitting regions have a temperature of 6000 K where no thermal sputtering occurs (105 K, Biscaro & Cherchneff, 2016) and have a counterpart of cold dust when we examined Herschel 70 and 160m maps, indicating that dust destruction is not significant. Recent estimates by Nath et al. (2008) and Micelotta et al. (2016) show only 1-20% of grains are sputtered in SN ejecta and the cooling in SN ejecta is rapid due to metal enriched ejecta. This long sputtering timescale as well as the constant reloading of the hot gas with dust from evaporating FMKs may be the reasons that we still observe a significant amount of dust in the hot gas processed by the reverse shock in Cas A. In the end, only those clumps that survive” the whole SNR expansion phase or that travel beyond the strong shock plowing into the ISM will contribute to seeding the ISM with supernova dust.
In conclusion, SOFIA FIFI-LS observations reveal the morphology of the [O I] and [O III] line emission in the SNR Cas A. The [O I] traces cooled, dense shocked gas and is related to CO emission and dense ejecta. The 52 and 88m [O III] emission reveals a component bright in the optical [O III] lines with a density of 104 cm-3 and temperature of 6000 K. This emission is coincident with the dense knots and we associate this with the cooling and recombining postshock gas layer before the gas has cooled down to 500 K and CO has formed. The IR [O III] maps reveal the region with 500 cm-3 and 6000 K. This gas envelopes the dense knots and we attribute this emission to gas evaporating from the dense knots due to the heat conduction by fast electrons.
References
- Barlow et al. (2010) Barlow, M. J., Krause, O., Swinyard, B. M., et al. 2010, A&A, 518, L138
- Biscaro & Cherchneff (2014) Biscaro, C., & Cherchneff, I. 2014, A&A, 564, A25
- Biscaro & Cherchneff (2016) —. 2016, A&A, 589, A132
- Borkowski & Shull (1990) Borkowski, K. J., & Shull, J. M. 1990, ApJ, 348, 169
- Cherchneff & Dwek (2010) Cherchneff, I., & Dwek, E. 2010, ApJ, 713, 1
- Colditz et al. (2018) Colditz, S., Beckmann, S., Bryant, A., et al. 2018, Journal of Astronomical Instrumentation, 7, 1840004
- De Looze et al. (2017) De Looze, I., Barlow, M. J., Swinyard, B. M., et al. 2017, MNRAS, 465, 3309
- Docenko & Sunyaev (2008) Docenko, D., & Sunyaev, R. A. 2008, A&A, 484, 755
- Docenko & Sunyaev (2010) —. 2010, A&A, 509, A59 (DS10)
- Draine (1995) Draine, B. T. 1995, Ap&SS, 233, 111
- Ennis et al. (2006) Ennis, J. A., Rudnick, L., Reach, W. T., et al. 2006, ApJ, 652, 376
- Fadda & Chambers (2018) Fadda, D., & Chambers, E. T. 2018, in BAAS, Vol. 231, , 150.11
- Fesen (2001) Fesen, R. A. 2001, ApJS, 133, 161
- Fesen et al. (2011) Fesen, R. A., Zastrow, J. A., Hammell, M. C., Shull, J. M., & Silvia, D. W. 2011, ApJ, 736, 109
- Fesen et al. (2006) Fesen, R. A., Hammell, M. C., Morse, J., et al. 2006, ApJ, 645, 283
- Hammer et al. (2010) Hammer, N. J., Janka, H.-T., & Müller, E. 2010, ApJ, 714, 1371
- Hurford & Fesen (1996) Hurford, A. P., & Fesen, R. A. 1996, ApJ, 469, 246
- Itoh (1981) Itoh, H. 1981, PASJ, 33, 521
- Krause et al. (2008) Krause, O., Birkmann, S. M., Usuda, T., et al. 2008, Science, 320, 1195
- Laporte et al. (2017) Laporte, N., Ellis, R. S., Boone, F., et al. 2017, ApJ, 837, L21
- Matsuura et al. (2011) Matsuura, M., Dwek, E., Meixner, M., et al. 2011, Science, 333, 1258
- Micelotta et al. (2016) Micelotta, E. R., Dwek, E., & Slavin, J. D. 2016, A&A, 590, A65
- Morse et al. (2004) Morse, J. A., Fesen, R. A., Chevalier, R. A., et al. 2004, ApJ, 614, 727
- Nath et al. (2008) Nath, B. B., Laskar, T., & Shull, J. M. 2008, ApJ, 682, 1055
- Nozawa et al. (2007) Nozawa, T., Kozasa, T., Habe, A., et al. 2007, ApJ, 666, 955
- Osterbrock (1988) Osterbrock, D. E. 1988, PASP, 100, 412
- Pagel (1997) Pagel, B. E. J. 1997, Nucleosynthesis and Chemical Evolution of Galaxies, 392
- Patnaude & Fesen (2014) Patnaude, D. J., & Fesen, R. A. 2014, ApJ, 789, 138
- Pei et al. (1991) Pei, Y. C., Fall, S. M., & Bechtold, J. 1991, ApJ, 378, 6
- Reach & Rho (2000) Reach, W. T., & Rho, J. 2000, ApJ, 544, 843
- Rho et al. (2012) Rho, J., Onaka, T., Cami, J., & Reach, W. T. 2012, ApJ, 747, L6
- Rho et al. (2009) Rho, J., Reach, W. T., Tappe, A., et al. 2009, ApJ, 700, 579
- Rho et al. (2008) Rho, J., Kozasa, T., Reach, W. T., et al. 2008, ApJ, 673, 271
- Rho et al. (2018) Rho, J., Gomez, H. L., Boogert, A., et al. 2018, MNRAS, 479, 5101
- Sarangi & Cherchneff (2015) Sarangi, A., & Cherchneff, I. 2015, A&A, 575, A95
- Silvia et al. (2012) Silvia, D. W., Smith, B. D., & Shull, J. M. 2012, ApJ, 748, 12
- Sluder et al. (2018) Sluder, A., Milosavljević, M., & Montgomery, M. H. 2018, MNRAS, 480, 5580
- Spilker et al. (2018) Spilker, J. S., Aravena, M., Béthermin, M., et al. 2018, Science, 361, 1016
- Sutherland & Dopita (1995) Sutherland, R. S., & Dopita, M. A. 1995, ApJ, 439, 381
- Temi et al. (2018) Temi, P., Hoffman, D., Ennico, K., & Le, J. 2018, Journal of Astronomical Instrumentation, 7, 1840011
- Tielens (2005) Tielens, A. G. G. M. 2005, The Physics and Chemistry of the Interstellar Medium
- Tielens et al. (1994) Tielens, A. G. G. M., McKee, C. F., Seab, C. G., & Hollenbach, D. J. 1994, ApJ, 431, 321
- Wallström et al. (2013) Wallström, S. H. J., Biscaro, C., Salgado, F., et al. 2013, A&A, 558, L2 (W13)