Measurements of particle spectra in diffractive proton-proton collisions with the STAR detector at RHIC††thanks: Presented at Diffraction and Low- 2018 workshop, 26 August 2018 to 1 September 2018, Reggio Calabria, Italy
Abstract
We present the inclusive and identified particle (pion, proton and their antiparticle) production in Single Diffraction Dissociation and Central Diffraction processes with the STAR detector at RHIC. The forward-scattered proton(s) are tagged in the STAR Roman Pot system while the charged particle tracks are reconstructed in the STAR Time Projection Chamber. Ionization energy loss and time of flight of charged particles are used for particle identification. In addition, the proton-antiproton production asymmetry as a function of rapidity is measured and used to study the baryon number transfer over a large rapidity interval in Single Diffraction Dissociation.
13.85.-t,13.85.Hd,14.40.Aq, 14.20.Dh
1 Introduction
Diffractive processes at high energies are characterized by the exchange of a color singlet object with vacuum quantum numbers, so called Pomeron, and are well described by the Regge theory. In + collisions two kind of processes are of particular interest, Single Diffraction Dissociation (SD: ) and Central Diffraction , where denotes the diffractively produced system.
Charged-particle measurements in + collisions provide insight into the strong interaction in the low-energy, non-perturbative regime of QCD. Particle interactions at these energy scales are typically described by QCD-inspired models implemented in Monte Carlo (MC) event generators with free parameters that can be constrained by measurements. Charged-particle distributions have been measured previously in minimum bias (MB) inelastic hadron-hadron collisions at various center-of-mass energies [1, 2]. The identified charged particle production in the midrapidity region has been also widely studied starting from the very first experiments performed at ISR at CERN to contemporary measurements with very high center-of-mass energies at RHIC [3] and LHC [4].
In the Standard Model, the baryon number is a conserved quantity in all interactions. The conserved baryon number associated with the beam particles is called ,,baryon number transfer” and has been studied both theoretically [5, 6] and experimentally in MB interactions [7], by a long time. The similar effect can be also studied in SD interactions, where the direction of the initial baryon is uniquely defined. The baryon number transfer is quantified by the baryon to antibaryon ratios.
In this paper we report on measurements of inclusive charged-particle distributions and identified particle/antiparticle ratios as a function of transverse momentum and pseudorapidity in CD and SD + collisions at GeV using data collected by the STAR experiment in 2015. In addition, we focus on the asymmetry of the production of protons and antiprotons at midrapidity in SD process.
2 Experimental setup
The main components of the STAR detector [8] used in this analysis include the Time Projection Chamber (TPC), which provides information about momentum and ionization energy losses of charged particles, the Time-Of-Flight (TOF) system which extends the capability of TPC in particle identification and the Roman Pot detectors (RP) [9], which enable tagging of the forward scattered protons.
3 Charged-particle distributions
The selection of diffractive events starts with the reconstruction of forward proton tracks. Exactly one track is required on each side of the Interaction Point (IP) for CD and exactly one track on one side only for SD (with fractional momentum loss ). Only one primary vertex with -component cm and at least two charged primary tracks with hits in the TOF system are required. To obtain the charged-particle multiplicity distributions, the distributions of tracks are unfolded into the distributions of particles using Bayes theorem. Figure 1 shows the measured distributions of primary charged particles in the kinematic range MeV/c and for SD and CD processes together with PYTHIA 8.182 [10] prediction using SaS [11] and MBR [12] Pomeron fluxes, respectively.
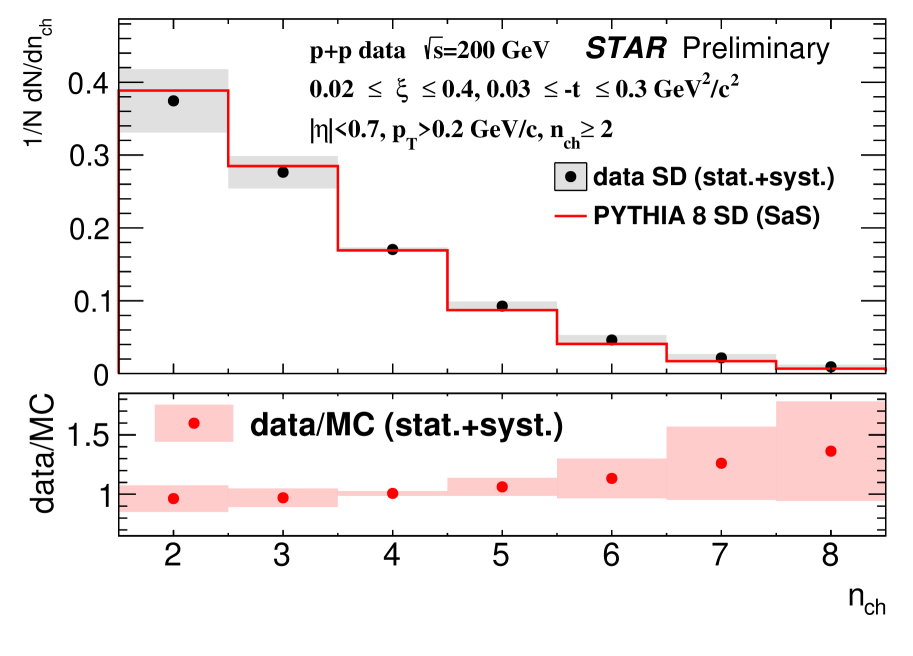
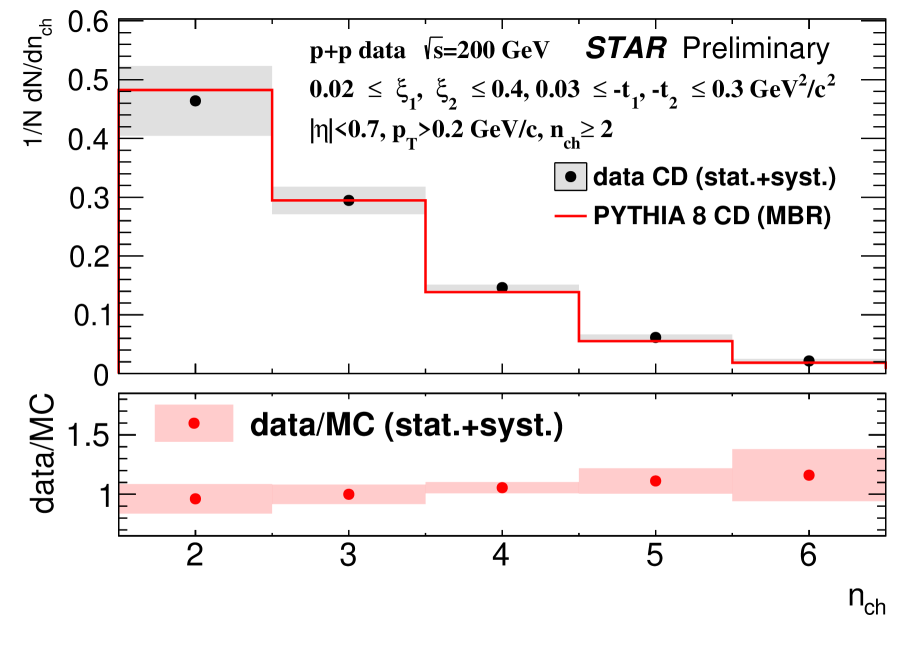
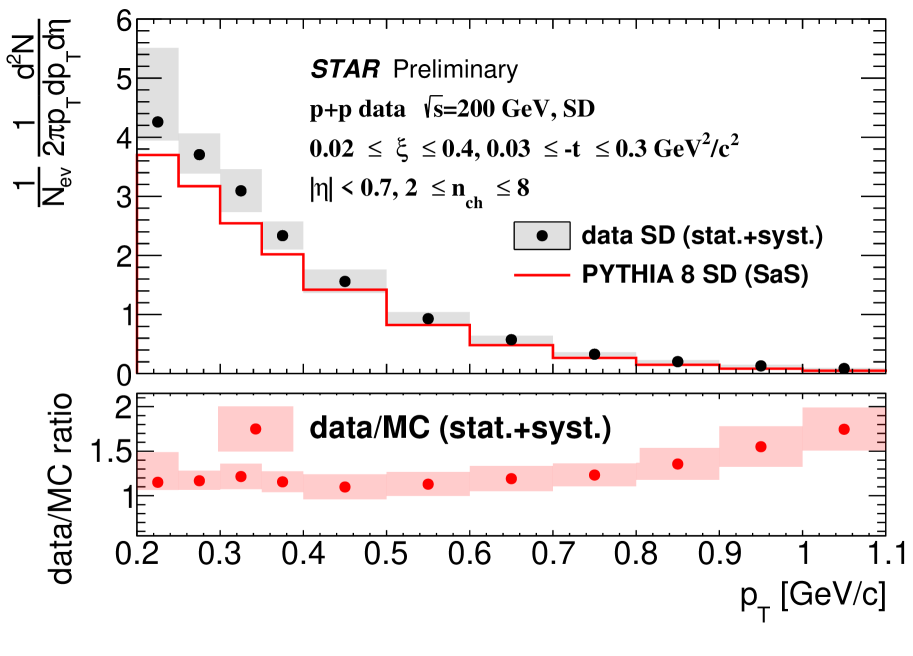
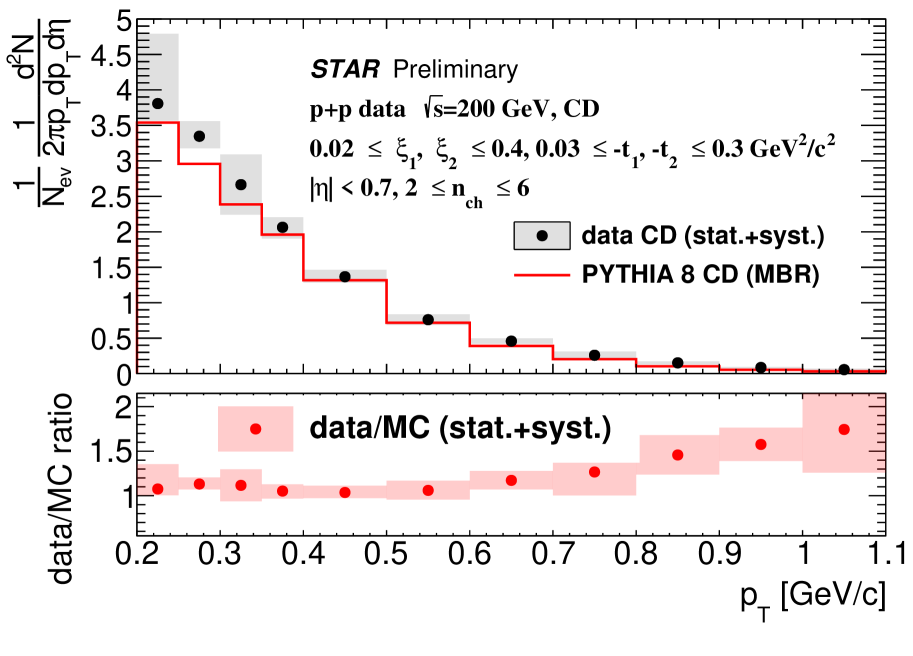
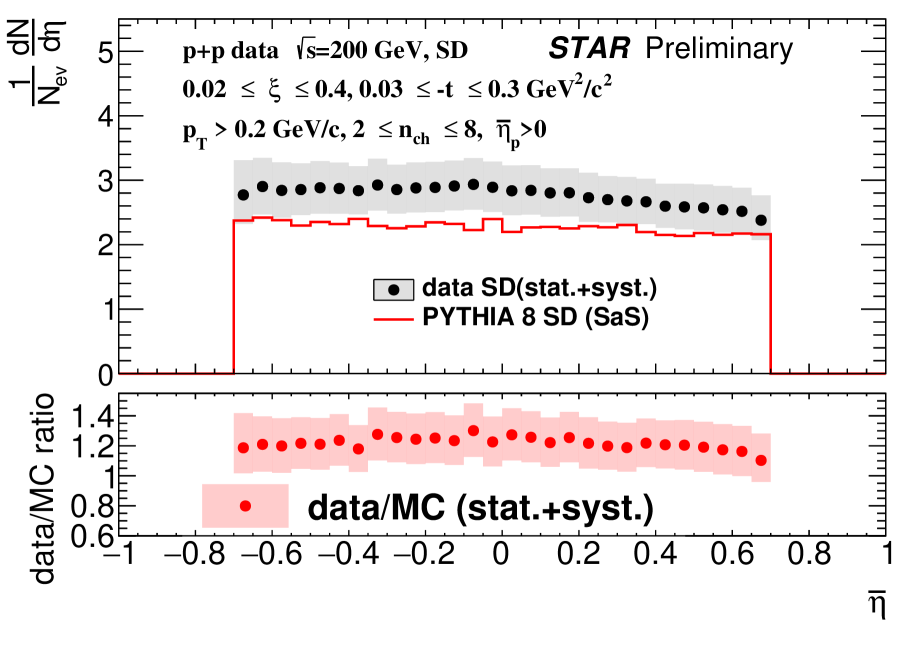
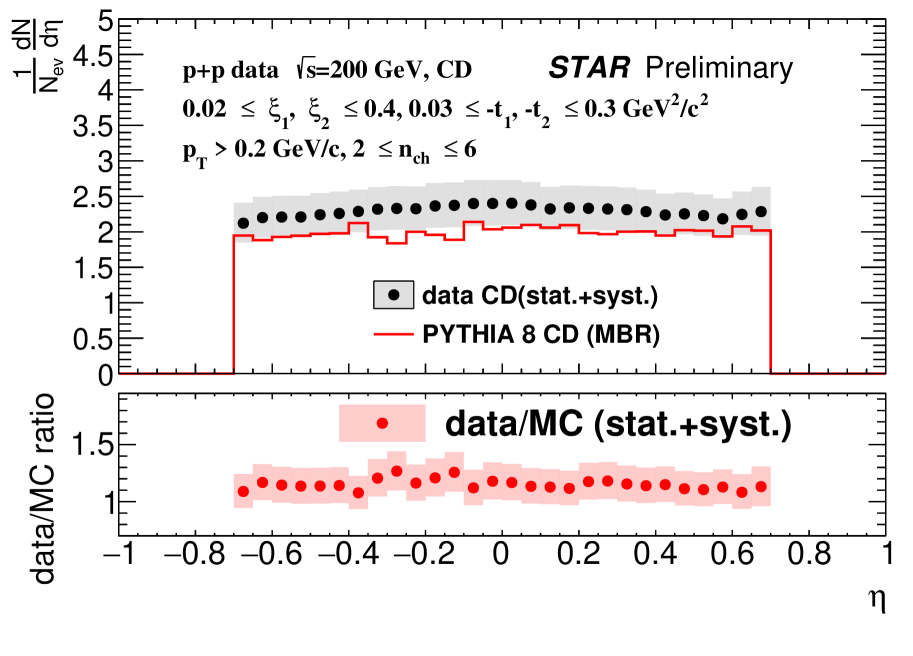
The analysis is limited to the number of charged particles between 2 and 8 for SD and for CD, to avoid large background. The measurements could be described by the PYTHIA 8 simulation very well. Figure 2 shows the charged-particle transverse momentum distributions in SD and CD collisions. Generally, data are underestimated by PYTHIA 8 especially for relatively high- ( GeV/c). Analysing the distribution require to define a new variable for SD, where is the longitudinal momentum of the forward proton: positive for particles produced on the outgoing proton direction and negative on the opposite side of the IP. Figure 3 shows the density of charged particles as a function of pseudorapidity. PYTHIA 8 simulations describes the data within accuracy.
4 Identified particle spectra
In the case of the identified particle spectra measurements, we require cm and . The charged tracks are measured in the kinematic range MeV/c and . The combined information from TPC and TOF is used to identify charged pions , protons and antiprotons.
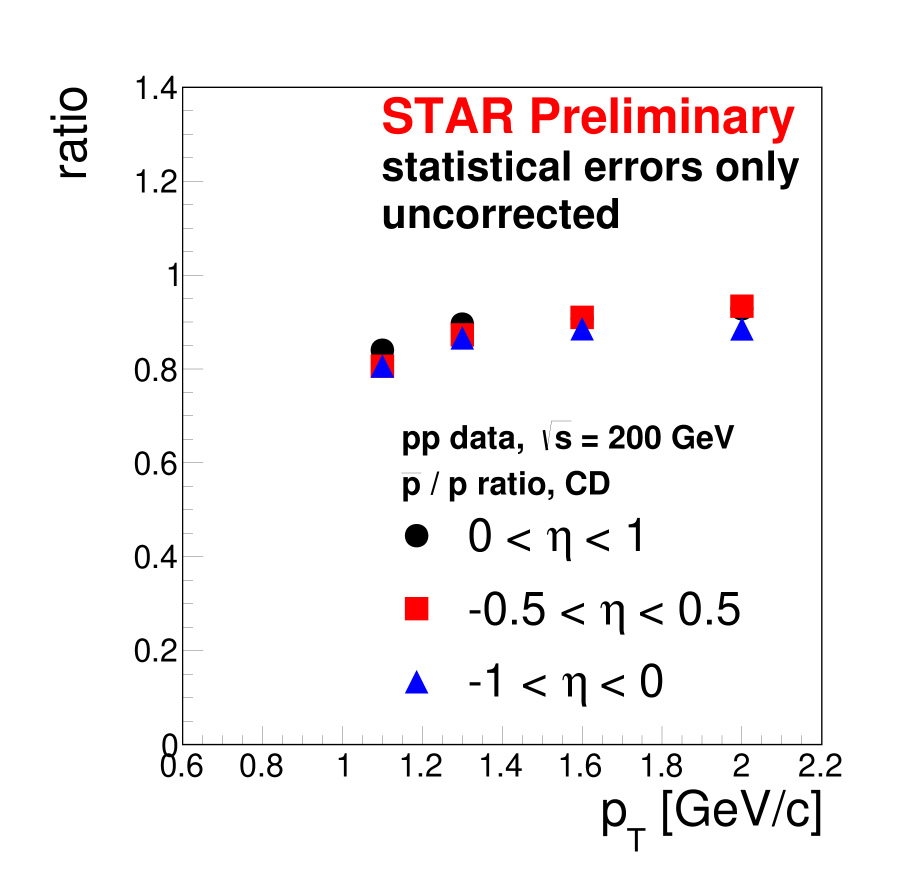
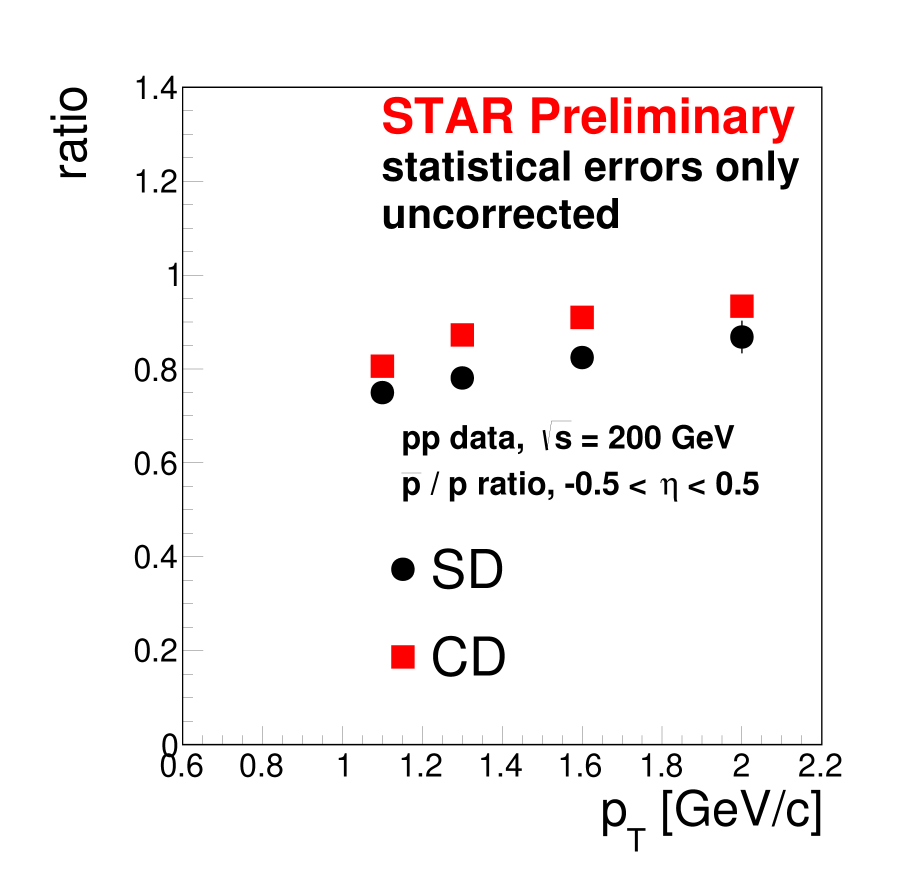
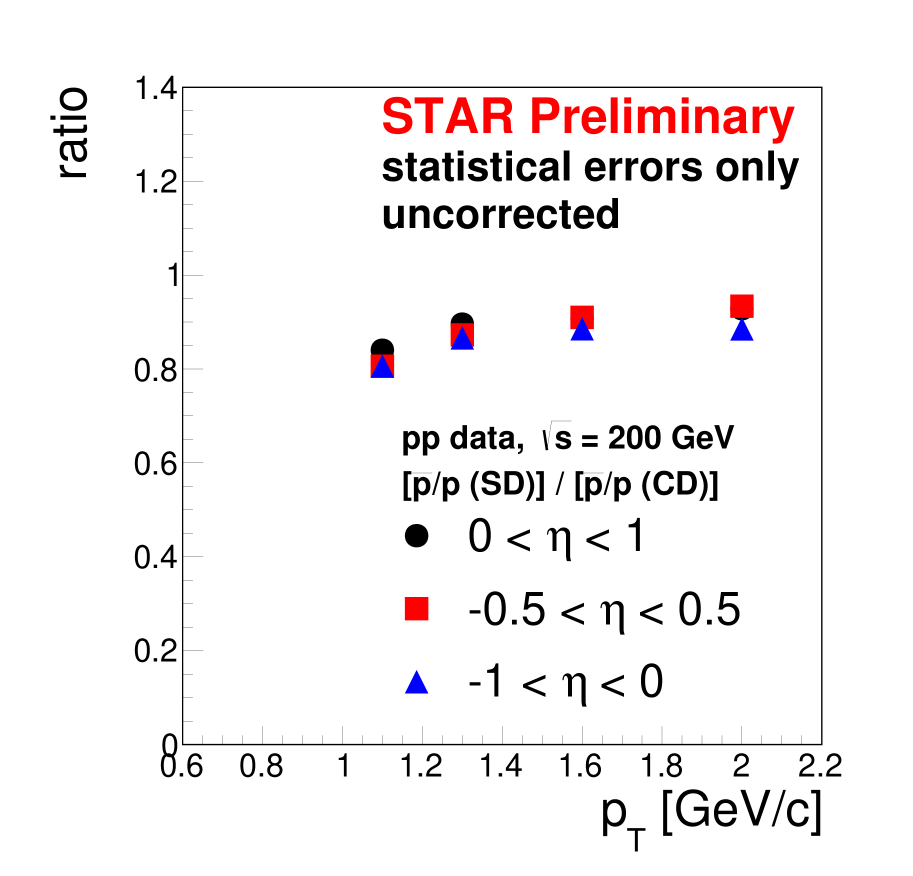
The particle to antiparticle ratios for pions and protons are shown in Fig. 4 for CD process and in Fig. 6 for SD process. The comparison of particle-antiparticle ratios between SD and CD in most central pseudorapidity interval are presented in Fig. 5. Charged pions are identified with transverse momentum GeV/c. In both processes, the ratio is equal to 1 in almost all bins and all ranges . This result is also consistent with the STAR minimum bias inelastic measurements [3]. The ratio is analyzed for particles with GeV/c because in that range the background from secondary interactions is expected to be small. Due to the antiproton absorption, the TPC track reconstruction efficiency is smaller for antiprotons than that for protons. Hence, the ratio is below 1 in CD, but the same in all three ranges. Nevertheless, it is noticed that this ratio is smaller in SD than that in CD. The ratio in SD divided by the ratio in CD, , gives the ratio in SD corrected for , efficiencies (Fig. 6). As a result, the ratio in the SD for particles within varies between and . And the ratio is greater than that in STAR minimum bias inelastic measurements, where it is between and . Moreover, the comparison of the ratio in different ranges indicates that baryon number transfer is smaller in the outgoing proton direction.


5 Summary
The distributions of charged-particle multiplicity, and measured in SD and CD processes are not well reproduced by PYTHIA 8 simulations in full accessible ranges. The preliminary results on ratios are in agreement with the STAR MB inelastic measurements, while the ratio in SD is measured to be greater than that in MB inelastic + collisions.
References
- [1] V. Khachatryan et al. (CMS Collab.), Phys. Lett. B 751, 143 (2015).
- [2] G. Aad et al. (ATLAS Collab.), New J. Phys. 13, 053033 (2011).
- [3] B. I. Abelev et al. (STAR Collab.), Phys. Rev. C 79, 034909 (2009).
- [4] J. Adam et al. (ALICE Collab.), Eur. Phys. J. C 75, 226 (2015).
- [5] B. Z. Kopeliovich, B. G. Zakharov, Z. Phys. C 43, 241 (1989).
- [6] G. C. Rossi, G. Veneziano, Nucl. Phys. B 123, 507-545 (1977).
- [7] K. Aamodt et al. (ALICE Collab.), Phys. Rev. Lett. 105, 072002 (2010).
- [8] K. Ackermann et al. (STAR Collab.), Nucl. Instrum. Meth. A 499, 624 (2003).
- [9] W. Guryn, Proceedings of this conference (Diffraction and Low-x 2018).
- [10] T. Sjostrand, S. Mrenna, P. Skands, Comput. Phys. Commun. 178, 852 (2008).
- [11] G. A. Schuler, T. Sjostrand, Phys. Rev. D 49, 2257 (1994).
- [12] R. Ciesielski, K. Goulianos, PoS ICHEP2012, 301 (2013).