Unconventional phase III of high-pressure solid hydrogen
Abstract
We reassess the phase diagram of high-pressure solid hydrogen using mean-field and many-body wave function based approaches to determine the nature of phase III of solid hydrogen. To discover the best candidates for phase III, density functional theory calculations within the meta-generalized gradient approximation by means of the strongly constrained and appropriately normed (SCAN) semilocal density functional are employed. We study eleven molecular structures with different symmetries, which are the most competitive phases, within the pressure range of 100 to 500 GPa. The SCAN phase diagram predicts that the and structures are the best candidates for phase III with an energy difference of less than 1 meV/atom. To verify the stability of the competitive insulator structures of and , we apply the diffusion Monte Carlo (DMC) method to optimise the percentage of exact-exchange in the trial many-body wave function. We found that the optimised equals to , and denote the corresponding exchange and correlation functional as PBE1. The energy gain with respect to the well-known hybrid functional PBE0, where , varies with density and structure. The PBE1-DMC enthalpy-pressure phase diagram predicts that the structure is stable up to 210 GPa, where it transforms to the . Hence, we predict that the phase III of high-pressure solid hydrogen is polymorphic.
I Introduction
The phase diagram of high-pressure hydrogen is a challenging problem in condensed matter and high-pressure physics. It has been extensively studied since 1935 1935 by experiment, theory and more recently computational methods. The main interests are the relevance of solid metallic hydrogen to room-temperature superconductivityAshcroft , possible existence of a metallic liquid ground stateBonev ; JChen , and astrophysicsHemley ; Ginzburg ; RevMod12 .
In this work, we focus on low temperature phases of solid hydrogen. Infrared (IR) and Raman measurements suggest the existence of several phases and phase transitions within the low temperature region of the phase diagram. Phase I, which is stable up to 1105 GPa, is a molecular solid composed of quantum rotors arranged in a hexagonal close-packed structure. Changes in the low-frequency regions of the Raman and IR spectra imply the existence of phase II, also known as the broken-symmetry phase, above 1105 GPa. The appearance of phase III at 150 GPa is verified by a large discontinuity in the Raman spectrum and a strong rise in the spectral weight of the molecular vibronsHemley . The IR activity increases dramatically upon transition from phase II to phase III, and the IR and Raman vibron frequencies soften by about 80 XZLi . Phase IV, characterized by two vibrons in its Raman spectrum, was discovered at 300 K and pressures above 230 GPaEremets ; Howie ; Howie2 . A new phase has been observed at pressures above 200 GPa and higher temperatures (for example, 480 K at 255 GPa)Howie3 . This phase is thought to meet phases I and IV at a triple point, near which hydrogen retains its molecular character. The most recent experimental resultsSimpson indicate that H2 and hydrogen deuteride at 300 K and pressures greater than 325 GPa transform to a new phase V, characterized by substantial weakening of the vibrational Raman activity. The structure of high-pressure solid hydrogen above 150 GPa is experimentally unknown. Thus, theoretical and computational techniques play a crucial role in determining the structure of solid hydrogen. The main goal of this work is to determine the phase III of solid hydrogen using the most accurate ab-initio techniques.
The electronic structure properties and lattice dynamic of solid hydrogen were mainly investigated using density functional theory (DFT) with local and semi-local exchange-correlation (XC) functionals Pickard ; Pickard2 ; Goncharov ; Magdau ; Naumov ; Morales2013 ; Clay ; Clay16 ; JETP ; singh ; PRB13 including van der Waals XC functionals PCCP17 . In particular, DFT with generalized gradient approximation (GGA) functionals were widely applied to search for low-energy crystal candidate structures and to calculate their vibrational properties. More accurate results for the phase diagram NJP ; samprl ; Neil15 , excitonic and quasi-particle band gaps of insulator phasesPRB17 ; JCC18 were obtained by many-body wave function based quantum Monte Carlo (QMC) methods Matthew1 ; samjcp15 ; sambenz . These QMC results were used for benchmarking DFT functionals and it was indicated that the GGA for the XC functional can dramatically alter the predicted phase diagramClay16 .
The crystal structure is the fundamental input for the first principle calculations. Due to lack of established experimental results for the crystal structure, there is no option but to use the structures predicted by DFT. Most of the structures have been predicted using the Perdew-Burke-Ernzerhof (PBE)PBE XC functionalPickard ; Pickard2 . Yet. it is now widely accepted that DFT results for high-pressure hydrogen strongly depends on the choice of employed XC functionalClay ; PRB13 . To the best of our knowledge, there is no comparison between the predicted structures by DFT-based structure prediction methods, which are performed using different XC functionals. The QMC results rely on the structures that are obtained by DFT simulations since structure prediction by QMC is yet unaffordable due to computational costs of dealing with many-body wave functions. Therefore, benchmarking DFT functionals and calculating the phase diagram using different XC functionals are important for finding the most accurate XC functional. Moreover, the functionality of the enhancement factor within the high density regime and treatment of the exchange energy in DFT functionals yield different phase stability and phase transitions. Fortunately, there are some properties which are not affected by the XC approximation. For instance, recently we have proposed a rule of thumb of the shorter the molecular bond-length, the larger the electronic band gap and the higher the vibron frequencies, which appears to be valid for all considered XC functionals PCCP17 .
It was demonstrated that for the enthalpy-pressure (H-P) phase diagram calculations the best performing XC functionals over all densities are the meta-GGA functionalsClay16 . However, the recently developed strongly constrained and appropriately normed (SCAN) meta-GGA functionalscan15 has not been applied on solid hydrogen. The behaviour of the exchange enhancement factor in the SCAN functional as a function of the density gradient can provide more accurate results than using GGA functionals. Benchmarking DFT functionals indicated that the exchange energy and the exchange enhancement factor play a crucial role in H-P calculations Clay16 . In this work, we calculate the H-P phase diagram of molecular structures using the SCAN XC functional.
The derivative discontinuity of the DFT-XC functional differs from the single-particle Kohn-Sham energy band gap. Local and semi-local DFT XC functionals underestimate the fundamental gap because for them. The inclusion of Hartree-Fock exchange enables us to approximate the exchange contribution of , but owing to the nonlocality, the exchange energy overestimates the band gap. Therefore, hybrid DFT, which includes a fraction of Hartree-Fock exchange, usually yields an improved description of the electronic structure of insulators. Moreover, because of the absence of an artificial self-repulsion between the occupied states, Hartree-Fock exchange cancels the self-interaction contribution of the Hartree energy and consequently provides a more accurate method to calculate the Kohn-Sham spectra of insulators than GGA. The fraction of Hartree-Fock exchange used in hybrid DFT can be considered as a variational parameters. In this work we optimize this variational parameter using the diffusion Monte Carlo (DMC) method to build an efficient variational many-body wave function, which accurately describes the electronic structural properties of insulators phases.
II Computational Details
In this work, we consider the molecular structures of , , , , , , , , , , and within the pressure range of 100 to 500 GPa. The number after hyphen indicates the number of hydrogen atoms in the primitive cell used in our calculations. Our DFT calculations were carried out using the latest version of the Quantum-Espresso suite of programsQS . We used a basis set of plane waves with an energy cutoff of 100 Ry. For the geometry and cell optimisations a -point mesh is employed for all the structures except of and for which a -point mesh is used. The quasi-Newton algorithm was used for all cell and geometry optimization, with a convergence thresholds on the total energy and forces of 0.01 mRy and 0.1 mRy/Bohr, respectively. To calculate the SCAN enthalpy-pressure phase diagram, we used a norm-conserving Troullier-Martin pseudopotential without nonlinear core corrections, which was generated by the SCAN XC functionalJCP-SCAN-PP . It was demonstrated that use of other conventional pseudopotentials, which are not explicitly produced for the SCAN functional, can lead to discrepancies for some systems JCP-SCAN-PP . The relative enthalpy-pressure phase diagram is simulated by fitting a quartic polynomial with five fitting parameters on nine enthalpy-pressure DFT points within the pressure range of 100 to 500 GPa.
All QMC calculations were performed via the CASINO package using a Slater-Jastrow trial wave functioncasino . The orbitals of the Slater-determinant were obtained by means of DFT within the local density approximation using the developer version of the Quantum-Espresso code. The Slater orbitals were generated using a norm-conserving pseudopotential in conjunction with a basis set energy cutoff of 400 Ry that were transformed into a localized blip polynomial basisblip . The PBE1 exchange-correlation functional, in which the mixing of exact-exchange parameter and , was used to optimize the atomic coordinates and generate the single particle Kohn-Sham orbitals to be used in the QMC calculations. For the geometry optimization, the PBE pseudopotential is used. The DMC results were obtained using a real -point wave function, super cell size, and time step of 0.005 a.u. We used the the model-periodic Coulomb interactions MPC to correct for Coulomb finite-size errors. We used the conventional Jastrow factor that includes the polynomial one-body electron-nucleus, two-body electron-electron, and three-body electron-electron-nucleus terms, which were optimized by minimizing the variance at the VMC levelvariance .
III Results and discussion
III.1 SCAN phase diagram
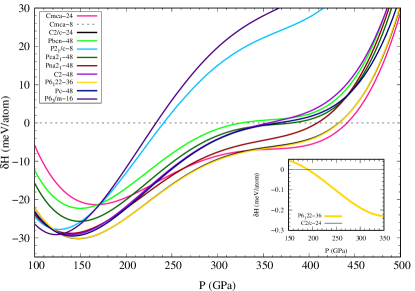
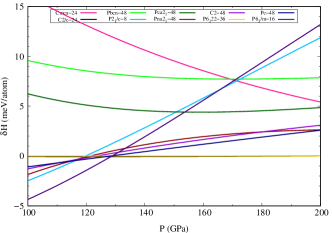
In the following, we first discuss the predicted DFT-SCAN phase diagram. Fig. 1 illustrates the H-P phase diagram for the molecular structures of solid hydrogen within the pressure range of 100 to 500 GPa, which is simulated using the SCAN functional. The studied structures were predicted in previous works by ab-initio random structure searching method (AIRSS) using GGA functionals at the static level in which the vibrational contributions were not included Pickard ; Pickard2 . The SCAN H-P phase diagram predicts four phase transitions of hexagonal to monoclinic at 129 GPa, to hexagonal at 190 GPa, to orthorhombic at 343 GPa, and to at 442 GPa. The hexagonal structure is the most stable phase at pressures below 130 GPa and is the best candidate for the phase I of solid hydrogen. This agrees with low pressure static phase diagram as calculated by GGA functionals Pickard ; JETP ; PRB13 . The other candidate for the pressure range below 150 GPa is which was initially predicted with eight atoms per primitive cell. Previous static DFT calculations using different GGA functionals, where the were not considered, suggested that the with twenty four hydrogen atoms per primitive cell is the best candidate for phase I Neil15 .
According to the SCAN phase diagram, is stable within the pressure window of 129-190 GPa and it transforms to at 190GPa. The phase has been predicted by AIRSS with the Becke-Lee-Yang-Parr (BLYP)BLYP XC functional tomeu16 . According to the static DFT-BLYP phase diagram the is more stable than the phase within pressure range of 100-350 GPa, whereas the phase stabilizes because of the zero point energy (ZPE) contributions. The DFT-BLYP Gibbs free energy phase diagram at zero temperature, where the ZPE is taken into account, suggested that is more stable than the phase at pressures below 180 GPa tomeu16 . Our static SCAN phase diagram predicts that the structure is the best candidate for phase III of solid hydrogen above 200 GPa and below 340 GPa. The phase is stable from 343 GPa till it transforms to at 442 GPa. Our DMC calculations indicated a very similar phase transition of to at 439 GPa samprl . All previous studies of the high-pressure solid hydrogen phase diagram, which were carried out using DFT based methods, predict that solid hydrogen adopts the symmetry before atomization. Taking into account the consistent prediction of previous first-principles calculations within different levels of theory, we propose a new fact of low-temperature solid hydrogen adopts a symmetry before atomization, which is independent of particular XC functional.
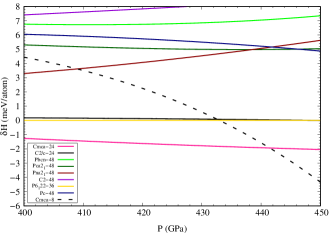
We studied the recently predicted structures of and , which have been suggested as the best candidates for phase V at pressures above 300 GPa Tomeu18 . We found that none of these structure are stable at any pressure range. According to the BLYP phase diagram, at a pressure above 300 GPaTomeu18 , is stable until it transforms into the phase at pressures above 420 GPa. The BLYP Gibbs free energy calculations predict that at low and room temperatures the structure transforms into at around 350 GPa. The static SCAN phase diagram indicates a phase transition around 343 GPa, namely the to phase transition. The BLYP dynamic phase diagram at zero temperature, where the ZPE contributions are included, showed the to phase transition at 130 GPa, which is close to the prediction of the static SCAN phase diagram. The reason could be due to the fact that the BLYP-ZPE difference between the and phases within the pressure range of 110-150 GPa is smaller than 3 meV/atomPRB13 .
III.2 Diffusion Monte Carlo phase diagram
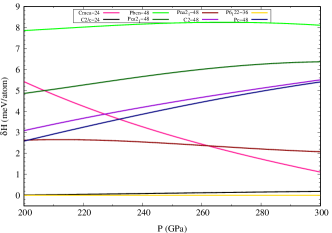
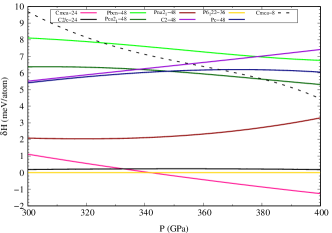
Within the studied pressure range, the SCAN enthalpy difference between the and phases is lees than 1 meV/atom, which is below the accuracy of DFT. The DFT energy difference between these two phases within the pressure window of 160-260 GPa is around 0.3 meV/atom, which is affected by ZPE and thermal contributions. The IR and Raman spectra of and were calculated using DFTtomeu16 . Their results indicate that, since the and structures are identical, the frequencies of the active modes are indistinguishable and agree with available experimental data. The only important difference between the two signals is the stronger IR vibron peak for the phase, which agrees with the experimental report that in phase III the IR activity is much larger than that in phase II. The main conclusion is that the IR and Raman spectra of and are consistent with the corresponding spectra observed for phase III, which is why the structure of phase III can not be determined purely based on its vibrational response. Hence, we apply a higher level of theory to determine phase III of solid hydrogen.
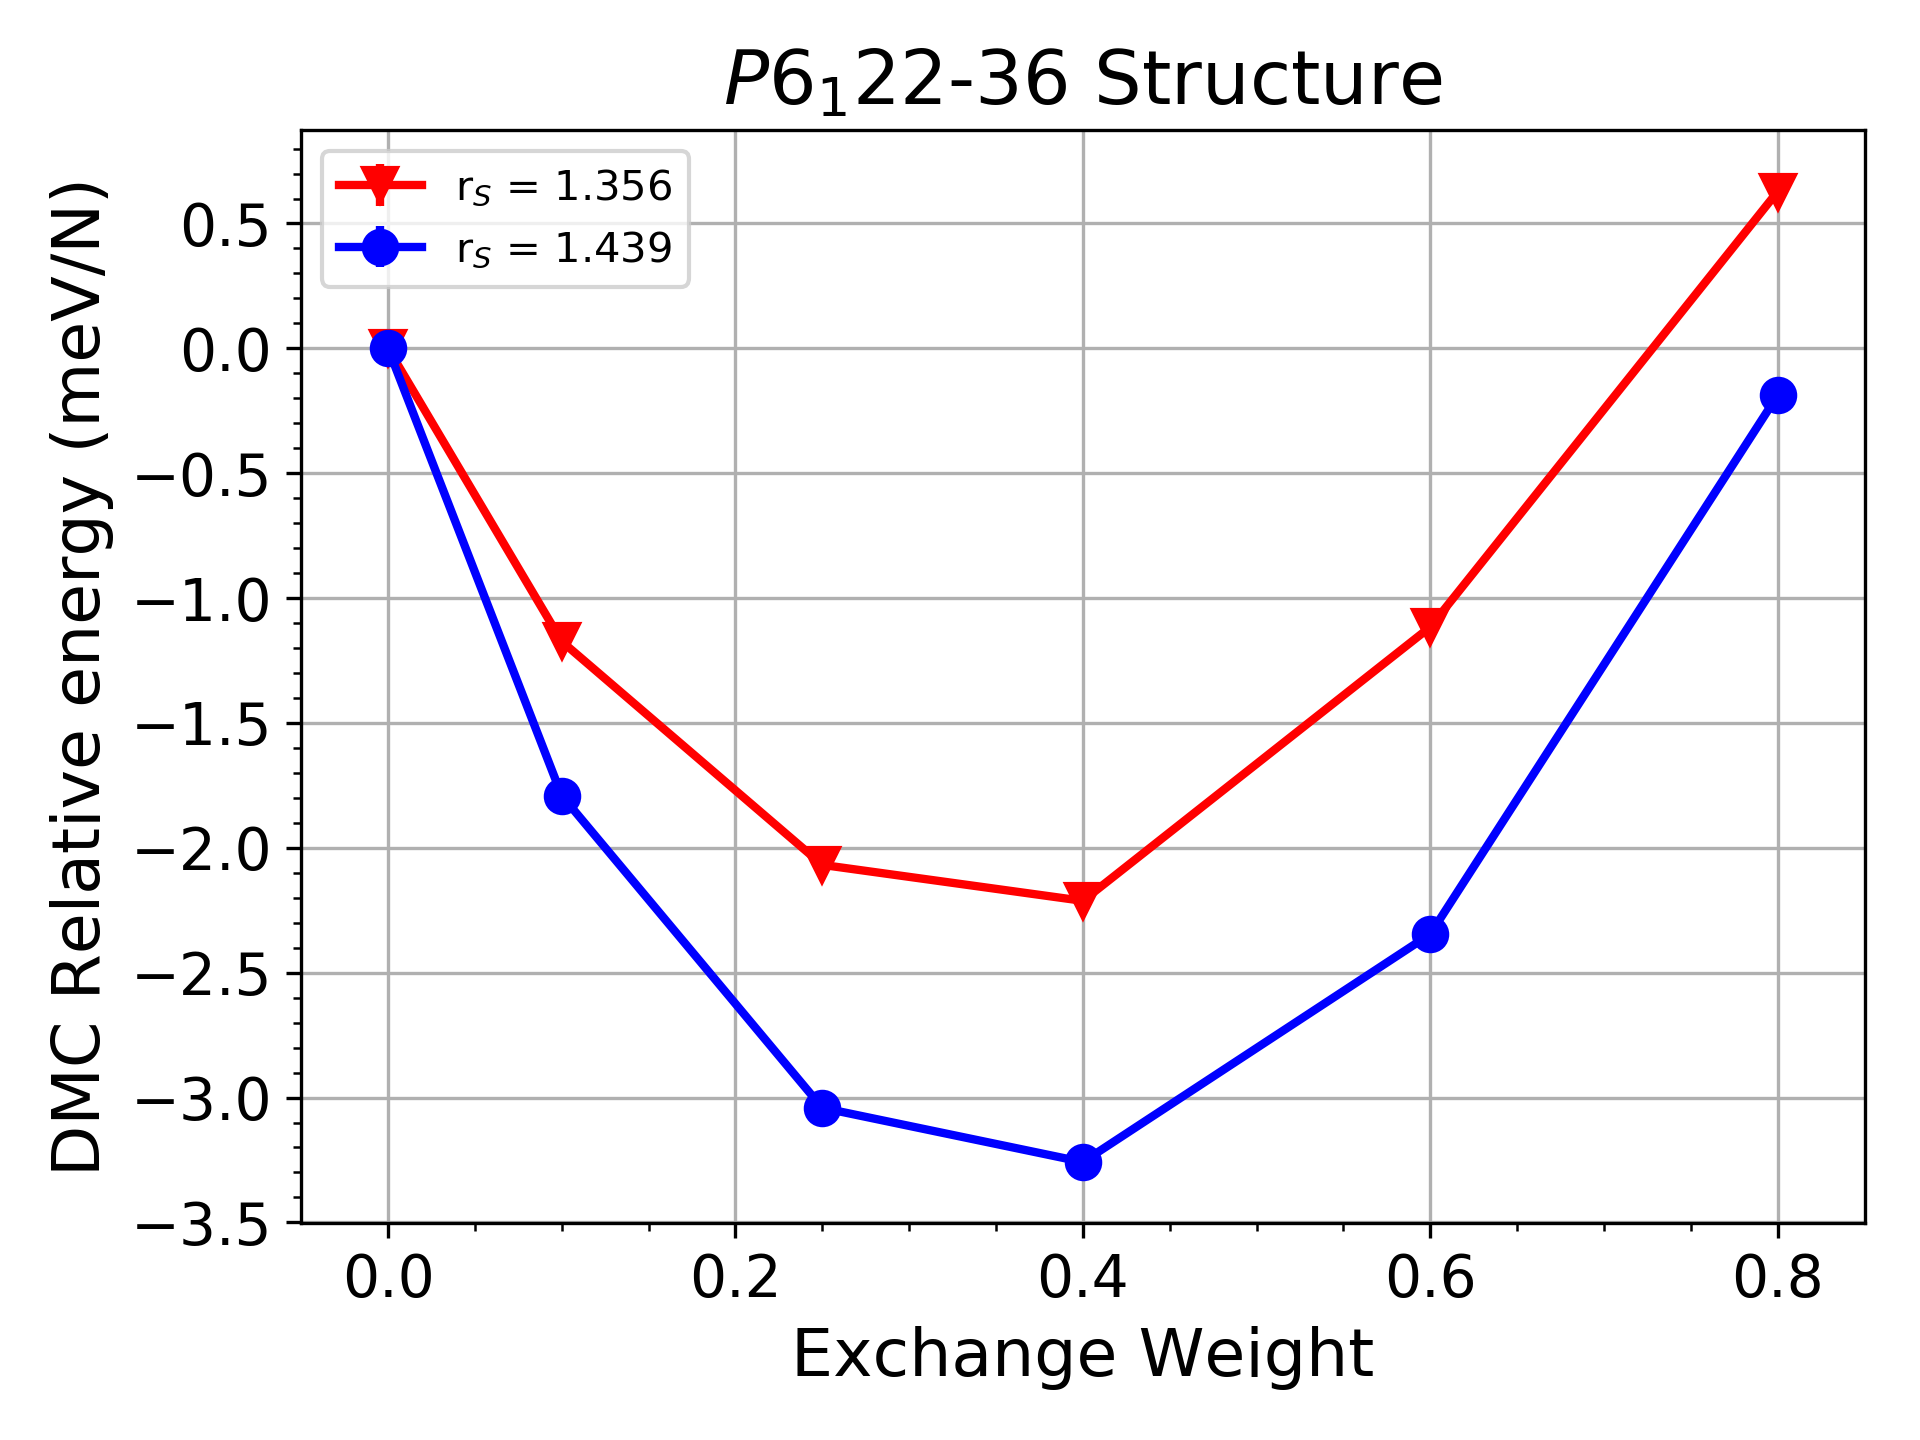
In the rest of this work, we only focus on two structures of () and (), which are the most likely candidates for phase III within the pressure range below 300 GPa and above 150 GPa. To calculate the phase transition between these two candidates and determining the structure of phase III, we employed the DMC method. Phase III of solid hydrogen has a finite energy band gap below 300 GPa, and the phase transition between the and structures is a pressure driven insulator-insulator structural transition. For the DMC simulations, our initial aim is to find the trial many-body wave function that produces the best description of both phases. We generated a set of trail wave functions using the present DFT-PBE1 XC functional, in which the value of the exact-exchange parameter is varied within the range of 0 to . The DMC approach is a variational method and therefore the that gives the lowest ground state DMC energy provides the most accurate representation of the many-body wave function of the system. We therefore use to vary the single particle orbitals of the trial wave function. Yet, prior to our DMC calculations, the atomic coordinates of each structure were fully relaxed for each value of .
 |
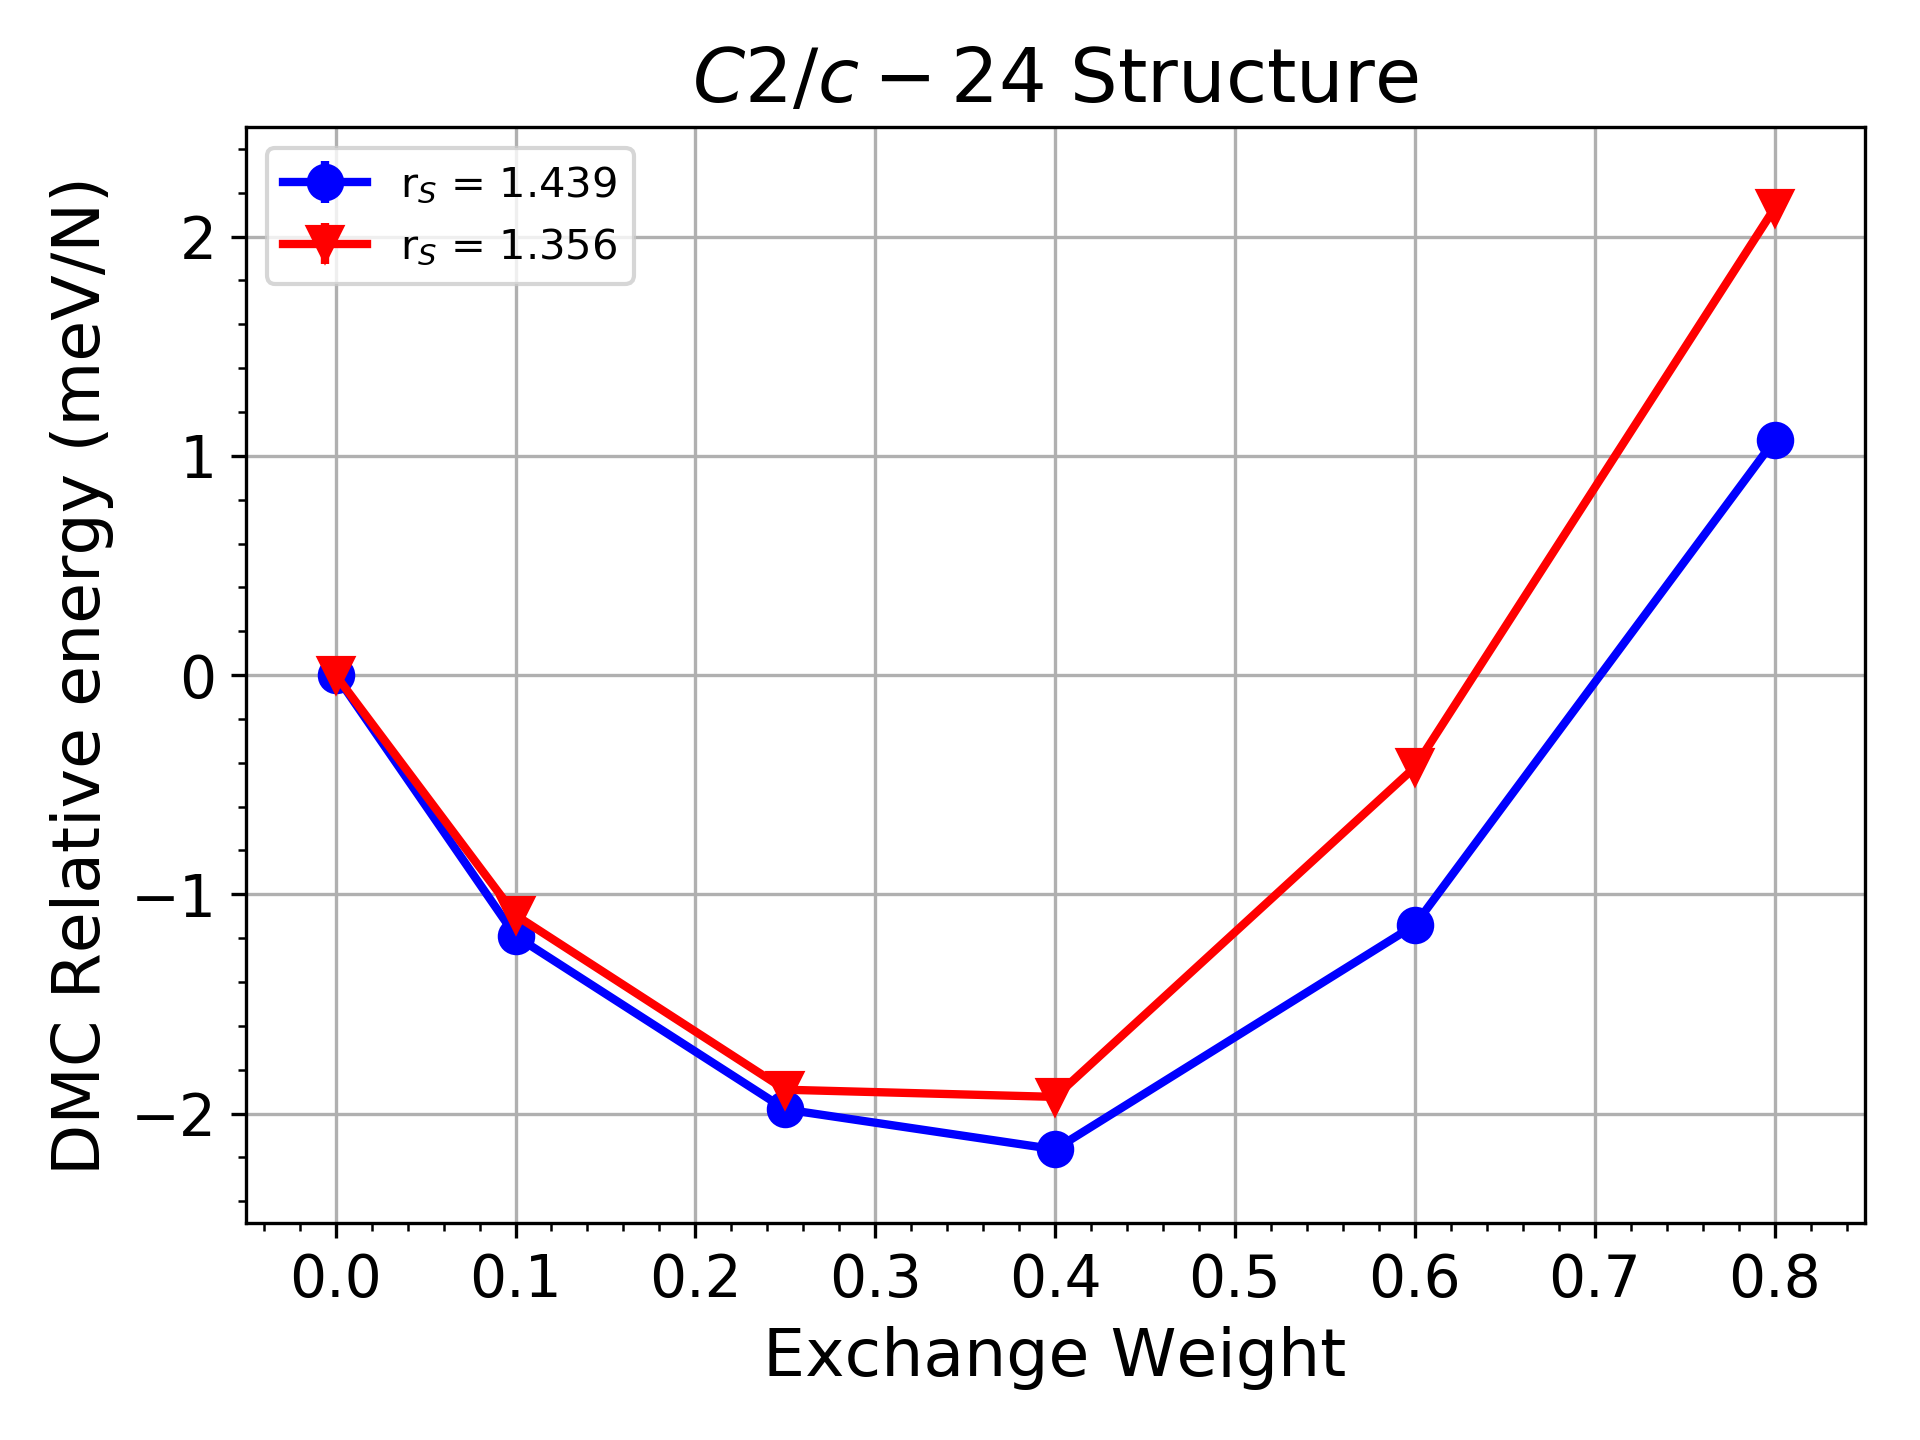 |
Fig. 3 shows the DMC energies for the and structures as a function of . The reference DMC energy was obtained using the conventional PBE exchange-correlation functional, i.e.. The and phases were considered at two different densities with Wigner–Seitz radius of and a.u, respectively. For the structure a minimum in the DMC energy is observed for . The DMC energy difference between the conventional PBE0 Perdew96 ; Becke93 , where , and our PBE1 with at and is 0.23(6), and 0.24(6) meV/atom. In the case of the structure, this difference at and equals 0.18(5) and 0.06(5) meV/atom, respectively. The DMC results predict that may tend to produce the best description of the ground state electronic structure of the and structures, which are the most likely candidates for phase III of solid hydrogen. The energy gain at the minimum for with respect to the PBE XC functional for the phase at and is -3.26(4) and -2.21(3) meV/atom. For the structure, the energy gain at the minimum with respect to PBE at and equals to -2.16(2) and -1.92(3) meV/atom, respectively. Our DMC results indicate that for the and structures, reducing the , which corresponds to higher densities and consequently larger pressure, reduces the energy gain with respect to the PBE XC functional.
In the Table 1 we have listed the pressure, the nearest neighbour distance (bond-length), and the energy band-gap for the and structures, which are obtained using the PBE () and PBE1 () XC functionals. The difference between PBE and PBE1 pressures for the and phases at lower density is 3 and 2 GPa, respectively. The same pressure difference for the and structures at is 5 and 4 GPa. Since the volume is fixed, the pressure difference between PBE and PBE1 functionals is only due to the atomic coordinate optimization.
| ; | |||
|---|---|---|---|
| Structure | Pressure (GPa) | BL () | (eV) |
| 170 | 0.727 | 2.4 | |
| 173 | 0.727 | 2.6 | |
| ; | |||
| 167 | 0.717 | 5.7 | |
| 171 | 0.716 | 5.9 | |
| 262 | 0.730 | 0.92 | |
| 266 | 0.730 | 0.96 | |
| 257 | 0.715 | 3.8 | |
| 262 | 0.714 | 4.2 |
We also used the PBE1 XC functional to calculate the enthalpy of and structures. The electronic structure energy was obtained by DMC and the term was calculated using the PBE1 functional. Fig. 4 illustrates the relative DFT and DMC enthalpies of the and structures as a function of exchange weight with respect to the PBE- enthalpy. Similar to the SCAN prediction, the DFT-enthalpy phase diagrams, which are obtained for different values of , at and yield nearly indistinguishable results for the and structures. We found differences between the and phases by using the DMC electronic energy. Since is not a variational parameter within hybrid-DFT, increasing the reduces the Kohn-Sham total electronic energy for the systems with wide energy gaps. Our DMC simulations yields a parabola for the energy as a function of , where the energy gain of the phase at lower densities is larger than that of the one. For both studied phases, the DMC-enthalpy reduces with due to contributions of the dominating DFT- term, which is also decreasing with .
 |
 |
 |
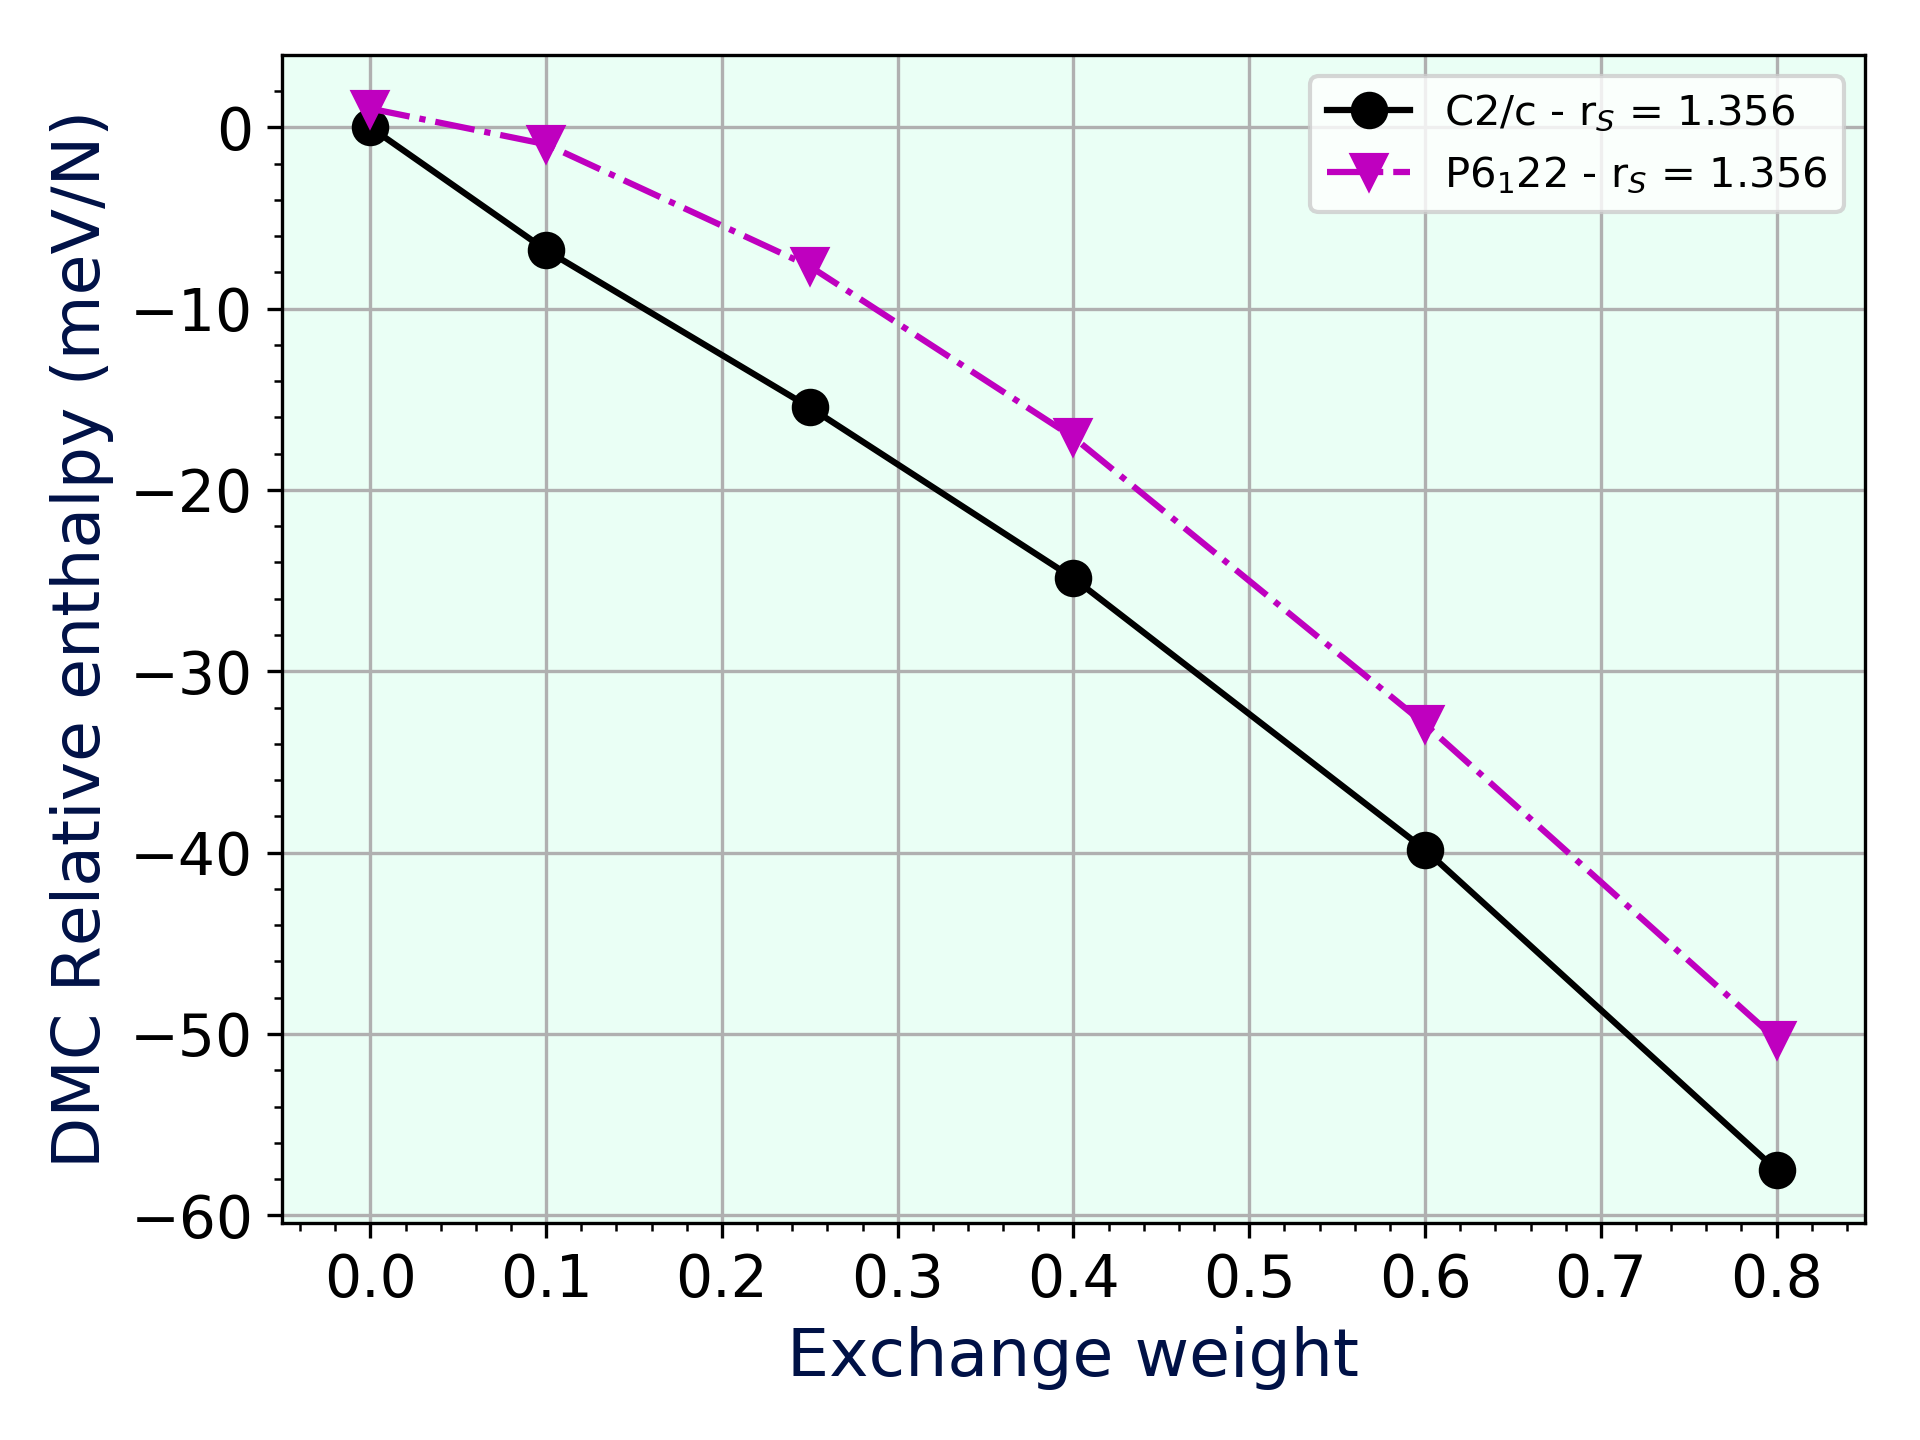 |
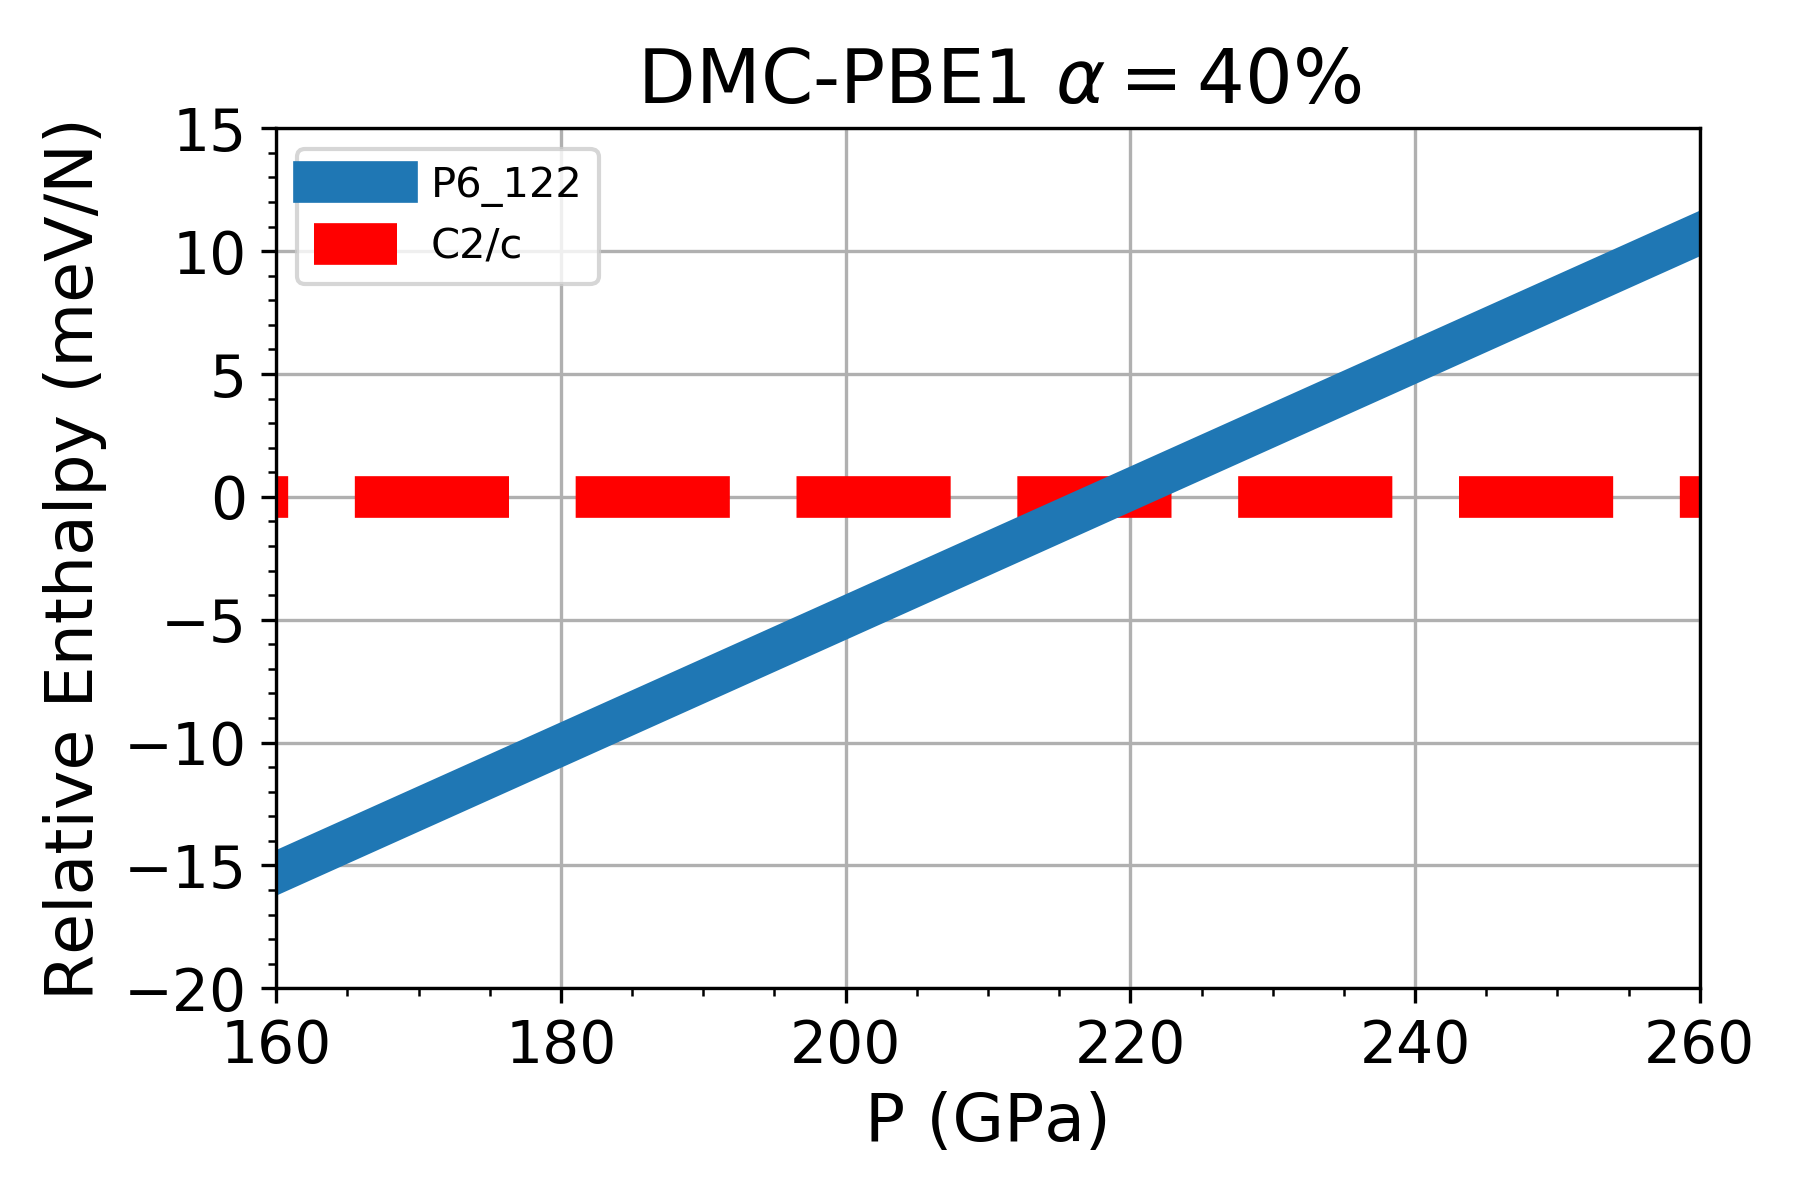
Fig. 5 illustrates the relative enthalpy of with respect to the structure. Our DMC H-P diagrams indicate that is the stable phase within pressure range of 160-210 GPa and that it transforms to the structure at around 210-220 GPa. The structure is the best candidate for the phase III at pressures above 210 GPa, whereas the is the most likely candidate for phase III below 210 GPa. Our DMC phase diagram prediction is based on the DFT pressure, which introduces a 3-4 meV/atom error within the enthalpyNJP . Obviously, using the DMC pressure for the static enthalpy-pressure phase diagram may alter the predicted outcomes. The DMC phase diagram indicates that phase III of solid hydrogen could be polymorphic. Our prediction on the polymorphic nature of the phase III agrees with recent nuclear magnetic resonance spectroscopy observations Tomeu19 , where the quantitative results are strongly depend on the used XC functional. A very recent experimental observation shows a first order phase transition near 425 GPa from an insulating molecular phase to metallic hydrogen Loubeyre19 . The synchrotron infrared spectroscopy measurement indicates the stability of the insulating phase in the high-density regime before matallization. Our DMC results for phase III and the stability of at low-density and at higher pressures agrees with this recent experiment.
Including the DFT-based ZPE contribution in our phase diagram calculations changes the phase stability of the phases and the transitions between them. We expect that including the phonon energies will also change the SCAN H-P phase diagram. Note that the lattice dynamic should also be calculated using the SCAN functional, for instance by means of linear response theory or using the direct atom displacement method. The Gibbs free energy calculations up to room temperature for the and structures, which were performed by DFT-PBE and DFT-BLYP (tomeu16, ), indicate that the relative phonon free energy within the pressure range of 150-300 GPa, in which the to phase transition occurs, is less than 2 meV/atom. Based on our DMC enthalpy pressure phase diagram, the energy difference between the and phases at 160 and 200 GPa are -15(3) and -5(3) meV/atom, respectively. Therefore, we expect that the effects of including the ZPE and thermal contributions on the DMC H-P phase diagram are negligible.
IV Conclusion
In the first part of this work, for the first time, we employed the SCAN meta-GGA XC functional to provide a new revised static enthalpy-pressure phase diagram for eleven competitive molecular structures of solid hydrogen within the pressure range of 100-500 GPa. Our SCAN enthalpy-pressure phase diagram predicts four phase transitions of hexagonal to monoclinic at 129 GPa, to hexagonal at 190 GPa, to orthorhombic at 343 GPa, and to at 442 GPa. Moreover, we compared all the available phase diagrams for high-pressure solid hydrogen, which were obtained by different DFT XC approximations and quantum Monte Carlo based methods, and proposed a new rule of thumb that the molecular solid high pressure hydrogen obeys symmetry before dissociating into an atomic physe. We previously proposed our first rule of thumb about insulating molecular structures of high-pressure solid hydrogenPCCP17 , which is the shorter the molecular bond-length the larger the electronic band gap and the higher vibron frequencies.
In the second part of this work, we focused on determining the insulating phase III using the many-body wave function based DMC method. We considered two competitive candidates, namely the and structures that have finite energy band gaps. To find the most accurate trial many-body wave function, we took into account the fraction of exact-exchange as a variational parameter, which was then optimised by DMC. We found that is the optimised value that provides the lowest ground state electronic structure total energy. The energy gain with respect to the conventional PBE XC functional, where , depends on the atomic structure and density. Our DMC enthalpy-pressure phase diagram indicates that phase III of solid hydrogen adopts two structures, the one , which is stable below 210 GPa, and the phase, which is stable at pressures above 210 GPa.
V Acknowledgements
This project has received funding from the European Research Council (ERC) under the European Union’s Horizon 2020 research and innovation programme (grant agreement No 716142). The generous allocation of computing time by the Paderborn Center for Parallel Computing (PC2) on OCuLUS and the FPGA-based supercomputer NOCTUA is kindly acknowledged.
References
- (1) E. Wigner and H. B. Huntington, J. Chem. Phys. 3, 764 (1935).
- (2) N. W. Ashcroft, Phys. Rev. Lett. 21, 1748 (1968).
- (3) S. A. Bonev, E. Schwegler, T. Ogitsu, and G. Galli, Nature 431, 669 (2004).
- (4) J. Chen, X-Z Li, Q. Zhang, M. I. J. Probert, C. J. Pickard, R. J. Needs, A. Michaelides, and E. Wang, Nat. Commun. 4, 2064 (2013)
- (5) H. K. Mao and R. J. Hemley, Rev. Mod. Phys. 66, 671 (1994).
- (6) V. L. Ginzburg, Phys. Usp. 42, 353 (1999).
- (7) J. M. McMahon, M. A. Morales, C. Pierleoni, and D. M. Ceperley, Rev. Mod. Phys. 84, 1607 (2012).
- (8) X-Z Li, B. Walker, M. I. J. Probert, C. J. Pickard, R. J. Needs, A. Michaelides, J. Phys.: Condens. Matter 25, 085402 (2013).
- (9) M. I. Eremets and I. A. Troyan, Nat. Mater. 10, 927 (2011).
- (10) R. T. Howie, C. L. Guillaume, T. Scheler, A. F. Goncharov, and E. Gregoryanz, Phys. Rev. Lett. 108, 125501 (2012).
- (11) R. T. Howie, I. B. Magdǎu, A. F. Goncharov, G. J. Ackland, and E. Gregoryanz, Phys. Rev. Lett. 113, 175501 (2014).
- (12) R. T. Howie, P. Dalladay-Simpson, and E. Gregoryanz, Nat. Mater. 14, 495 (2015).
- (13) P. Dalladay-Simpson, R. T. Howie, and E. Gregoryanz, Nature 529, 63 (2016).
- (14) C. J. Pickard and R. J. Needs, Nat. Phys. 3, 473 (2007).
- (15) C. J. Pickard, M. Martinez-Canales, and R. J. Needs, Phys. Rev. B 85, 214114 (2012).
- (16) A. F. Goncharov, J. S. Tse, H. Wang, J. Yang, V. V. Struzhkin, R. T. Howie, and E. Gregoryanz, Phys. Rev. B 87, 024101 (2013).
- (17) I. B. Magdău and G. J. Ackland, Phys. Rev. B 87, 174110 (2013).
- (18) I. I. Naumov, R. E. Cohen, and R. J. Hemley, Phys. Rev. B 88, 045125 (2013).
- (19) M. A. Morales, J. M. McMahon, C. Pierleoni, and D. M.Ceperley, Phys. Rev. B 87, 184107 (2013).
- (20) R. C. Clay, J. Mcminis, J. M.McMahon, C. Pierleoni, D. M. Ceperley, and M. A. Morales, Phys. Rev. B 89, 184106 (2014).
- (21) R. C. Clay, M. Holzmann, D. M. Ceperley, and M. A. Morales, Phys. Rev. B 93, 035121 (2016).
- (22) S. Azadi and T. D. Kühne, JETP letters 95, 449 (2012).
- (23) R. Singh, S. Azadi, and T. D. Kühne, Phys. Rev. B 90, 014110 (2014).
- (24) S. Azadi and W. M. C. Foulkes, Phys. Rev. B 88, 014115 (2013).
- (25) S. Azadi, and G. J. Ackland, Phys. Chem. Chem. Phys. 19, 21829 (2017).
- (26) W. M. C. Foulkes, L. Mitas, R.J. Needs, and G. Rajagopal, Rev. Mod. Phys. 73, 33 (2001).
- (27) S. Azadi and W. M. C. Foulkes, J. Chem. Phys. 143, 102807 (2015).
- (28) S. Azadi and R. E. Cohen, J. Chem. Phys. 143, 104301 (2015).
- (29) S. Azadi, W. M. C. Foulkes, and T. D. Kühne, New J. Phys. 15, 113005 (2013).
- (30) S. Azadi, B. Monserrat, W. M. C. Foulkes, and R. J. Needs, Phys. Rev. Lett. 112, 165501 (2014).
- (31) N. D. Drummond, B. Monserrat, J. H Lloyd-Williams, P. López Ríos, C. J. Pickard, and R. J. Needs, Nat. Comm. 6, 7794 (2015).
- (32) S. Azadi, N. D. Drummond, and W. M. C. Foulkes, Phys. Rev. B 95, 035142 (2017).
- (33) S. Azadi, R Singh, and T. D. Kühne, J. Comp. Chem. 39, 262 (2018).
- (34) J. P. Perdew, K. Burke, and M. Ernzerhof, Phys. Rev. Lett. 77, 3865 (1996).
- (35) J. Sun, A. Ruzsinszky, and J. P.Perdew, Phys. Rev. Lett. 115, 036402 (2015)
- (36) B. Monserrat, R. J. Needs, E. Gregoryanz, and C. J. Pickard, Phys. Rev. B 94, 134101 (2016)
- (37) P. Giannozzi, S. Baroni, N. Bonini, M. Calandra, R. Car, C. Cavazzoni, D. Ceresoli, G. L. Chiarotti, M. Cococcioni, I. Dabo, et al., J. Phys.: Condens. Matt. 21, 395502 (2009).
- (38) C. Lee, W. Yang, and R. G. Parr, Phys. Rev. B 37, 785 (1988).
- (39) Y. Yao, and Y. Kanai, J. Chem. Phys. 146, 224105 (2017).
- (40) R. J. Needs, M. D. Towler, N. D. Drummond and P. López Ríos, J. Phys.: Condens. Matter 22, 023201 (2010).
- (41) D. Alfé and M. J. Gillan, Phys. Rev. B 70, 161101 (2004).
- (42) N. D. Drummond and R. J. Needs, Phys. Rev. B 72, 085124 (2005).
- (43) J. P. Perdew, and Y. Wang, Phys. Rev. B 45, 13244 (1992).
- (44) L. M. Fraser, W. M. C. Foulkes, G. Rajagopal, R. J. Needs, S. D. Kenny, and A. J. Williamson, Phys. Rev. B 53, 1814 (1996).
- (45) J. P. Perdew, M. Ernzerhof, and K. Burke, J. Chem. Phys. 105, 9982 (1996)
- (46) A. D. Becke, J. Chem. Phys. 98, 1372 (1993); J. Chem. Phys. 98, 5648 (1993); J. Chem. Phys. 104, 1040 (1996).
- (47) B. Monserrat, N. D. Drummond, P. Dalladay-Simpson, R. T. Howie, P. Lòpes Riòs, E. Gregoryanz, C. J. Pickard, and R. J. Needs, Phys. Rev. Lett. 120, 255701 (2018)
- (48) B. Monserrat, S. E. Ashbrook, and J. Pickard, Phys. Rev. Lett. 122, 135501 (2019)
- (49) Paul Loubeyre, Florent Occelli, and Paul Dumas, arXiv:1906.05634 (2019)