Cross-correlation between the 21-cm signal and [O iii] emitters during early cosmic reionization
Abstract
We study statistics of the 21-cm signal from the epoch of reionization. We propose to use [O iii] line emitting galaxies to cross-correlate with the 21-cm signal from . To this aim, we employ simulations of reionization obtained post-processing the high-resolution cosmological hydrodynamics simulation Massive Black-II with the three-dimensional (3D) radiative transfer code crash to follow the propagation of ionizing photons from a variety of sources. We show that, during the early phases of reionization, the 21-cm signal is positively correlated with the spatial distribution of the [O iii] emitters on large scales . This positive correlation is generated by the temperature - galaxy correlation and it is a few times larger than when we assume that the heating is saturated. As the reionized regions expand, the correlation changes its sign to negative from to 8. The signals at this epoch can be detected by combining the Square Kilometre Array (SKA) and a wide-field [O iii] emitter survey. We also calculate the cross-power spectrum with a 3D [O iii] intensity field, aiming at exploiting future intensity mapping observations. We conclude that high-redshift [O iii] line emitters can be used to probe the reionization process when the inter-galactic medium is largely neutral.
keywords:
galaxies: high-redshift – intergalactic medium – dark ages, reionization, first stars1 INTRODUCTION
A number of observational programmes are planned to probe the evolution of the intergalactic medium (IGM) during cosmic reionization. So far, observations of absorption lines in quasar spectra (e.g. McGreer, Mesinger & D’Odorico 2015) and the polarisation of the cosmic microwave background (Planck Collaboration XIII, 2016) suggest that the IGM was almost fully ionized by , whereas the recent global hydrogen 21-cm signal measurement by EDGES, if confirmed, indicates that reionization began as early as (Bowman et al., 2018). Although the inferred epoch of reionization (EoR) is roughly consistent with theoretical models based on the standard cosmology, there still remain outstanding issues such as the nature of its sources and the detailed ionization history.
The hydrogen 21-cm line provides a direct method to probe the distribution of neutral hydrogen in the Universe. Ongoing and planned radio observations include Murchison Wide Field Array (MWA)111http://www.mwatelescope.org, Low Frequency Array (LOFAR)222http://www.lofar.org, Precision Array for Probing Epoch of Reionization (PAPER)333http://eor.berkeley.edu, Hydrogen Epoch of Reionization Array (HERA)444https://reionization.org, and Square Kilometer Array (SKA)555https://astronomers.skatelescope.org. It is well known that a variety of the so-called foregrounds hamper robust detection of the 21-cm signal from the EoR. Most notably the Galactic synchrotron emission and extragalactic radio sources are far brighter than the expected 21-cm signal. A promising way of mitigating the systematic noise or contamination from foregrounds, in addition to confirming the origin of the signal, is to utilise the cross-correlation of the 21-cm line with some other known tracers at the same redshift. The spatial cross-correlation between the 21-cm signal and the distribution of galaxies at the EoR has been suggested as one of such probes, and correlation with Ly emitters (LAEs) has been studied extensively (e.g. Lidz et al. 2009; Wiersma et al. 2013; Vrbanec et al. 2016; Hutter et al. 2017; Kubota et al. 2018). While LAEs can be an excellent tracer of the underlying large-scale structure at , it becomes progressively difficult to detect LAEs toward higher redshift, when the neutral fraction of the IGM is large. Konno et al. (2014) has shown that the Ly luminosity becomes significantly weak compared to UV continuum at . It is thus necessary to investigate the possibility of using other tracers, if they exist, to measure the cross-correlation during the early phase of reionization.
Recent observations by Atacama Large Millimeter/submillimeter Array (ALMA) demonstrated that the FIR [O iii] line is an excellent target to detect and study galaxies at (e.g. Inoue et al. 2016; Carniani et al. 2017; Laporte et al. 2017; Hashimoto et al. 2018, 2019; Tamura et al. 2019). Earlier in our study, we propose that [O iii] line emitters can be used as a tracer of the underlying large-scale structure at high redshift (Moriwaki et al., 2018). Line intensity mapping is another powerful method to study the large-scale distribution of galaxies. Intensity mapping observations of the high-redshift [C ii], CO, H lines are already planned (Kovetz et al., 2017). The Spectrophotometer for the History of the Universe, Epoch of Reionization, and Ice Explorer (SPHEREx), which is aiming to map the H intensity at , can also detect the high-redshift optical [O iii] line in the future. The possibility of using intensity mapping, rather than galaxy surveys, in cross-correlation studies should then be considered, and indeed has been proposed by a number of authors (e.g. Visbal & Loeb 2010; Silva et al. 2015; Dumitru et al. 2019).
In this paper, we examine the cross-correlation between the 21-cm line and [O iii] emitters. The paper is structured as follows. In Section 2 we describe the methodology used for this study, in Section 3 we present the results, and in Section 4 we discuss future prospects for the detectability of the correlation and give our conclusions.
2 METHODOLOGY
In this section we present the simulation and the methodology employed to evaluate the cross-correlation between the 21-cm and [O iii] lines.
2.1 Simulations of reionization
Here we provide a brief description of the simulations of reionization employed in this work, while we refer the reader to Eide et al. (2018) and Eide et al. in prep for more details.
The IGM and source properties are retrieved from Massive Black-II, a high-resolution cosmological hydrodynamics simulation of galaxy formation (Khandai et al., 2015), which follows physical processes such as star formation, feedback, and black hole (BH) evolution (Springel & Hernquist, 2003; Di Matteo, Springel & Hernquist, 2005; Springel, 2005; Croft et al., 2009; Degraf, Di Matteo & Springel, 2010; Di Matteo et al., 2012). The simulated volume is a cube of cMpc on a side, where gas and dark matter particles with masses of and are distributed initially, so that the minimum halo mass identified in the simulation is . The cosmological parameters are from the 7-year Wilkinson Microwave Anisotropy Probe (WMAP7), i.e. , , , , and (Komatsu et al., 2011).
Radiation transfer (RT) is done as in Eide et al. (2018). Briefly, a density and a source distribution map on cells are generated from each snapshot. The Monte Carlo ray-tracing code crash (Ciardi et al., 2001; Maselli, Ferrara & Ciardi, 2003; Maselli, Ciardi & Kanekar, 2009; Graziani, Maselli & Ciardi, 2013; Graziani, Ciardi & Glatzle, 2018) is then used to compute the ionization degree and the gas temperature of each cell. Four types of ionizing sources are considered: stars, X-ray binaries, supernova-heated interstellar medium, and nuclear BHs. A constant escape fraction of UV photons is assumed for all the sources except BHs, for which the escape fraction is unity. Further details on the spectral shapes and the ionizing photon production rates are found in Eide et al. (2018) and Eide et al. in prep. The reionization simulation yields the Thomson scattering optical depth of the cosmic microwave background (CMB) , which is consistent with the Planck result (Planck Collaboration VI, 2018). We note here that stars contribute to generate and heat fully ionized Hii regions, whereas the other, more energetic sources contribute to partial ionization and heating of the diffuse IGM.
2.2 21-cm signal
The 21-cm brightness temperature relative to the CMB temperature is given by (e.g. Field 1959; Furlanetto, Oh & Briggs 2006)
| (1) |
where is the volume averaged neutral fraction, is the spin temperature, and are the fluctuations of the neutral fraction and the gas density respectively, and
| (2) |
is the normalization factor that scales with cosmological parameters. The spin temperature is set to be the gas temperature, which is a valid assumption in the presence of strong Ly coupling. We also make the common assumption that , where is the Hubble parameter and is the velocity gradient along the line of sight. To examine the contribution from the temperature fluctuations to the 21-cm signal, we rewrite equation (1) as
| (3) |
by introducing , where is the volume averaged value of and .
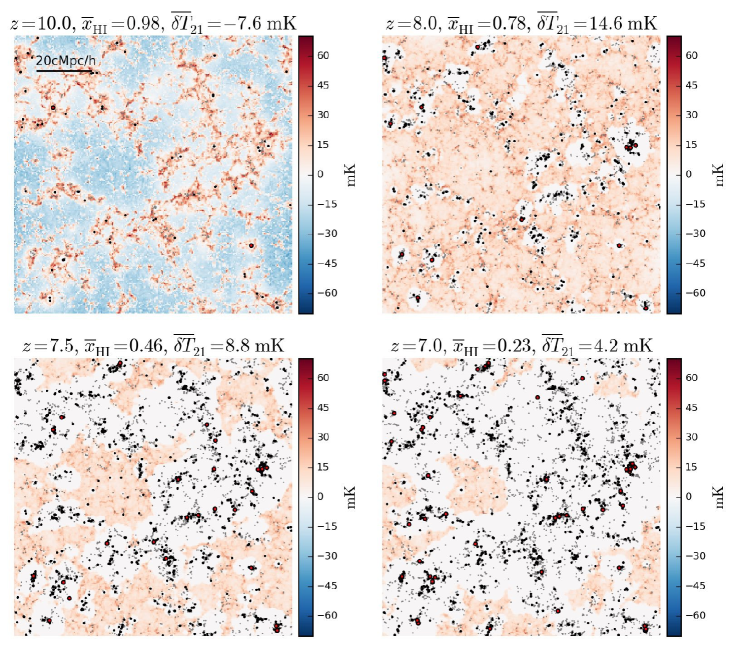
Fig. 1 shows the slice maps of the 21-cm signals at , , , and . The red (blue) regions correspond to areas where the emission (absorption) signals are seen. At , the gas temperature in low density regions distant from bright galaxies is smaller than the CMB temperature, and thus absorption features are clearly seen in such regions. For a more extensive discussion of the 21-cm signal obtained from the simulations we refer the reader to Ma et al. in prep.
2.3 [O iii] line emission
| redshift | a | |||
|---|---|---|---|---|
| 10.0 | 0.98 | 0.197 | 4851 | 84 |
| 8.0 | 0.78 | 1.13 | 30399 | 856 |
| 7.5 | 0.46 | 2.66 | 72619 | 2522 |
| 7.0 | 0.23 | 3.53 | 92593 | 3634 |
-
a
in units of .
FIR/optical [O iii] lines are excellent targets to study the high-redshift large-scale structure (Moriwaki et al., 2018). Emission lines of highly ionized heavy elements including [O iii] lines originate from H ii regions around young and massive stars, and thus, they directly trace the ionizing sources. In addition, they are easier to model compared to those emitted from both neutral and ionized regions, such as [C ii] line. Among them, the [O iii] 5007Å line is one of the easiest to model because the electron density in H ii regions, which cannot be properly resolved in simulations as large as those adopted here, does not affect its luminosity. In this paper, we thus investigate the [O iii] 5007Å line. If we considered the FIR [O iii] line instead, the detectability would change depending on the emission strength but the overall results would still hold as long as the electron densities do not vary substantially from galaxy to galaxy.
To compute the line luminosity, , we use a library generated with the photoionization code cloudy (Ferland et al., 2017) as in Moriwaki et al. (2018), which contains the line luminosity relative to the H luminosity with the case-B approximation, . The [O iii] 5007Å line luminosity is calculated as
| (4) |
where is the line luminosity ratio calculated with cloudy, is the mean gas metallicity of a galaxy, is the ionization parameter, and is the electron density. We calculate the ionization parameter as (e.g. Panuzzo et al. 2003)
| (5) |
where is the case-B hydrogen recombination coefficient, and is the number of ionizing photons emitted from sources other than BHs multiplied by . As already mentioned, the [O iii] 5007Å line luminosity is typically independent from the electron density because its critical density is as high as , while the typical electron density in H ii regions is (e.g. Sanders et al. 2016). Because the simulation does not resolve individual H ii regions within a galaxy, we adopt for all galaxies in this study, but we verified that the results are not affected by this specific choice.
For each output, we generate a number density map of [O iii] emitters, , and a [O iii] intensity map, , with cells to cross-correlate with the 21-cm signal. The [O iii] intensity at the position is given by
| (6) |
where is the total [O iii] luminosity within a cell at , is the proper luminosity distance, is the comoving distance, is the observed wavelength, is the comoving volume of a cell, and is the comoving luminosity density at . Table 1 summarizes the global properties of each snapshot. The [O iii] luminosity density and the number of bright galaxies rapidly increase from to , but the IGM neutral fraction remains larger than 0.7 at . The distribution of galaxies is also shown in Fig. 1. Bright [O iii] emitters are embedded in large H ii regions as they are tracers of high density regions, where ionizing sources are expected to reside.
2.4 Cross-power spectrum
We calculate the cross-power spectrum between the 21-cm signal, , and the fluctuation of the galaxy number density, , where is the mean number density of the galaxies. In intensity mapping, the volume-averaged intensity over the observation volume, , cannot be directly observed because of a variety of foreground sources and contamination. Thus we cross-correlate the 21-cm signal with instead of . We calculate the normalized three-dimensional (3D) cross-power spectra between and () or () as
| (7) |
As a consequence of the three fluctuation terms (, and ) in equation (3), the cross-power spectrum is composed of seven terms:
| (8) | |||||
If the IGM gas is much hotter than the CMB temperature (i.e., ), the cross-power spectrum is reduced to
| (9) |
as often assumed in previous studies. In the following section, we will show the cross-power spectrum calculated under this ”saturated heating assumption” to examine the effect of temperature fluctuations.
We also calculate the cross-correlation coefficient
| (10) |
where and are the respective autopower spectra. We subtract the shot noise after calculating the autopower spectrum .
3 Results
In this section we will discuss our results in terms of cross-correlation between the 21-cm signal and the [O iii] emitters as well as [O iii] intensity.
3.1 21 cm-[O iii] emitter cross-power spectrum
We first calculate the 3D cross-power spectrum between the 21-cm signal and the fluctuation of the number density of galaxies. We assume that all the galaxies with [O iii] luminosity greater than are detected. 666 For reference, NIRCam on James Webb Space Telescope can detect [O iii] emitters with at with S/N by integrating per one field-of-view (Moriwaki et al., 2018). Such galaxies are typically hosted by halos with masses greater than M⊙. Fig. 2 shows the cross-power spectra at various redshifts (solid lines), together with the expected errors (dotted lines), which will be discussed later.
At , dominates at , producing the positive correlation clearly seen in Fig. 2. As our reionization model includes sources more energetic than stars, the gas temperature near the ionizing sources is saturated () even at , and disappears on scales smaller than the size of the saturated regions. Instead, we observe an anti-correlation of on these small scales (i.e., ). As the IGM gets heated with decreasing redshift, gets smaller. Inversely, the anti-correlation of becomes larger and shifts to larger scales as the ionized regions grow in size. From to 7.5, one can see a positive-to-negative transition of a large-scale cross-power spectrum. At , we find that the IGM temperature is saturated almost everywhere and there is always anti-correlation on large scales.
At every redshift, we observe another clear transition in the cross-correlation coefficient (the bottom panel of Fig. 2) from anti-correlation to no-correlation on the scale corresponding to the typical size of fully ionized regions, i.e., ( cMpc) at and ( cMpc) at . A positive correlation on these small scales has been found by other authors (see e.g. Lidz et al. 2009) and it could be related to two different effects. If galaxies outside ionized regions are observed, then the correlation between the gas density and these galaxies generates positive correlation. In our simulation, this is observed only when . Alternatively, this could be associated to some residual neutral gas in high density regions within Hii bubbles. In this case the neutral gas, and hence the associated 21-cm signal, is correlated with the galaxies residing within the same H ii region. In our simulations, we find that the gas within H ii regions is fully ionized, as a result either of the contribution from a large number of small mass galaxies (not resolved e.g. in Lidz et al. 2009) or of the lack of self-shielded Lyman limit systems as a consequence of the limited resolution of the simulation. The cross-power spectra in Fig. 2 do not show clear negative to positive “turnover”.
We next explore the detectability of the cross-power spectra. The variance of cross-power spectrum for a particular mode is given by (e.g. Lidz et al. 2009)
| (11) |
where is the cosine of the angle between and the line of sight and
| (12) | |||||
| (13) |
are the variances of the autopower spectra. The first terms, and , represent sample variances and the second terms, and , are the noise power spectra which depend on the instruments (see equations (22) and (23) of Kubota et al. 2018). The variance of the spherically averaged cross-power spectrum is then calculated as
| (14) |
where is the survey volume. We assume a SKA survey (Waterson et al., 2016) with 1000 hour integration time, and a hypothetical redshift survey of [O iii] emitters capable of detecting galaxies with with a redshift error and a survey volume , which corresponds to an area of with a redshift interval of at . With this survey volume, a statistically significant number () of galaxies can be detected even at (see table 1). For SKA observations, we adopt the system temperature, the number density of antenna tiles, and the effective area of each antenna tile from Kubota et al. (2018). The dotted lines in Fig. 2 show the variance given in equation (14). The large-scale correlation at (and up to depending on redshift) can be detected by combining SKA and our hypothetical galaxy survey. We find that the sample variance ( and terms in equations (12) and (13)) dominate the errors at , whereas the observational errors ( terms) dominate on smaller scales.
To examine the effect of temperature fluctuations, we calculate the cross-power spectra under the saturated heating assumption, i.e. . The solid lines in Fig. 3 show the cross-power spectra calculated with saturated heating assumption. For reference, we also show the cross-power spectra calculated with the temperature fluctuations (i.e., , dashed lines), which are identical to those in Fig. 2. At , the positive correlation of on large scales () is present even without the fluctuations of , but its amplitude is much smaller than . At , we find stronger anti-correlation at in the case with the saturated heating assumption. This is owing to the absence of cancellation by (see Equation [8]). The fluctuations rapidly decay at , and the contribution to the 21cm cross-power gets smaller at lower redshifts. Therefore, we expect a positive-to-negative transition in the cross-power spectrum at a similar redshift between and 10 in both the cases, despite the large difference in the cross-power amplitudes at . We note that the heating rate of the IGM gas depends on the luminosity and the spectral shape of X-ray sources (Fialkov & Barkana, 2014; Fialkov et al., 2017). One should keep in mind that the transition would occur at a later stage of the EoR if the IGM gas is heated more slowly, though the inefficient X-ray heating model is disfavored by recent observations (e.g. Singh et al. 2018; Monsalve et al. 2019).
3.2 21 cm-[O iii] intensity cross-power spectrum
Next, we discuss the cross-correlation with [O iii] intensity. Fig. 4 shows the cross-power spectra between the 21-cm signal and the [O iii] intensity at four redshifts. The positive-to-negative transition of cross-power spectrum occurs between and 8, almost the epoch when changes its sign. The amplitude of the cross-power spectrum scales with the mean intensity. At , for instance, although there is a strong correlation between 21-cm and [O iii] intensity on large scales, the cross-power amplitude is smaller than at lower redshifts because of the small mean intensity at (see table 1). The transition in from anti-correlation to no-correlation is seen on scales smaller than in . This is because the entire [O iii] intensity is dominated by galaxies with and these fainter galaxies are embedded in smaller ionized bubbles (see Fig. 1). We find that the shapes of the cross-power spectra are overall similar to if the number density of galaxies with is used.
A large observation volume of intensity mapping may enable us to successfully detect a large-scale cross-correlation between 21-cm and intensity maps, but their noise levels can be estimated only if the detector, survey volume and depth are specified. In addition, a variety of foreground contamination needs to be considered. Although accurate accounts of these factors are beyond the scope of the present paper, further studies are clearly warranted because metal-lines such as [O iii] appear to provide a more promising probe than hydrogen/helium lines to identify early galaxy populations at .
4 DISCUSSION AND CONCLUSIONS
We have shown that the large-scale cross-power at (and up to depending on redshift) can be detected with SKA and a large volume galaxy survey or an intensity mapping. A successful detection at various redshifts would be valuable to probe the ionization and thermal state of the IGM. In Fig. 5 we show the redshift evolution of the cross-power amplitude at using the number density of [O iii] emitters (top) and [O iii] intensity (bottom). For , we show the observational errors described in the previous sections. From to 7.5, the IGM neutral fraction decreases rapidly from 1.0 to 0.5. As the temperature saturated regions and fully ionized regions grow in size, the sign of the cross-power spectrum changes from positive to negative. This transition is a clear signature to identify the beginning of the EoR. Although the exact epoch of this transition depends on the population of ionizing and heating sources, we find that the transition occurs when unless heating gets saturated at a very late stage of the EoR. To identify much earlier phases of the EoR, it is needed to detect and measure the cross-power spectra at smaller scales by reducing the observational errors.
Overall, we argue that [O iii] line emitters are excellent tracers of the underlying large-scale structure in the early universe and thus offer a promising method to probe the process of early reionization. In the future, the distribution of luminous [O iii] 88 m emitters at can be probed, for instance, by a multi-object spectrograph DESHIMA/MOSAIC proposed to be installed on Large Submillimeter Telescope (Kawabe et al., 2016). The James Webb Space Telescope NIRCam can also be used to carry out a survey of optical [O iii] 5007 Å line emitters at with either its grism module or narrow band filters (Moriwaki et al., 2018). Finally, all-sky infrared intensity mapping to be carried out by SPHEREx may also allow us to study the large-scale clustering of [O iii] emitters at . It is thus important to study further the distribution and the physical properties of [O iii] emitters and to understand their role in the process of cosmic reionization.
acknowledgments
We thank Saleem Zaroubi, Robin Kooistra, Keitaro Takahashi, Kenji Kubota, and Anastasia Fialkov for fruitful discussions. We also thank the anonymous referee for the helpful comments. KM has been supported by the Grant-in-aid for the Japan Society for the Promotion of Science (19J21379) and by Advanced Leading Graduate Course for Photon Science (ALPS) of the University of Tokyo.
References
- Bowman et al. (2018) Bowman J. D., Rogers A. E. E., Monsalve R. A., Mozdzen T. J., Mahesh N., 2018, Nature, 555, 67
- Carniani et al. (2017) Carniani S. et al., 2017, A&A, 605, A42
- Ciardi et al. (2001) Ciardi B., Ferrara A., Marri S., Raimondo G., 2001, MNRAS, 324, 381
- Croft et al. (2009) Croft R. A. C., Di Matteo T., Springel V., Hernquist L., 2009, MNRAS, 400, 43
- Degraf, Di Matteo & Springel (2010) Degraf C., Di Matteo T., Springel V., 2010, MNRAS, 402, 1927
- Di Matteo et al. (2012) Di Matteo T., Khandai N., DeGraf C., Feng Y., Croft R. A. C., Lopez J., Springel V., 2012, ApJ, 745, L29
- Di Matteo, Springel & Hernquist (2005) Di Matteo T., Springel V., Hernquist L., 2005, Nature, 433, 604
- Dumitru et al. (2019) Dumitru S., Kulkarni G., Lagache G., Haehnelt M. G., 2019, MNRAS, 485, 3486
- Eide et al. (2018) Eide M. B., Graziani L., Ciardi B., Feng Y., Kakiichi K., Di Matteo T., 2018, MNRAS, 476, 1174
- Ferland et al. (2017) Ferland G. J. et al., 2017, Rev. Mexicana Astron. Astrofis., 53, 385
- Fialkov & Barkana (2014) Fialkov A., Barkana R., 2014, MNRAS, 445, 213
- Fialkov et al. (2017) Fialkov A., Cohen A., Barkana R., Silk J., 2017, MNRAS, 464, 3498
- Field (1959) Field G. B., 1959, ApJ, 129, 536
- Furlanetto, Oh & Briggs (2006) Furlanetto S. R., Oh S. P., Briggs F. H., 2006, Phys. Rep., 433, 181
- Graziani, Ciardi & Glatzle (2018) Graziani L., Ciardi B., Glatzle M., 2018, MNRAS, 479, 4320
- Graziani, Maselli & Ciardi (2013) Graziani L., Maselli A., Ciardi B., 2013, MNRAS, 431, 722
- Hashimoto et al. (2019) Hashimoto T. et al., 2019, PASJ, 71, 71
- Hashimoto et al. (2018) Hashimoto T. et al., 2018, Nature, 557, 392
- Hutter et al. (2017) Hutter A., Dayal P., Müller V., Trott C. M., 2017, ApJ, 836, 176
- Inoue et al. (2016) Inoue A. K. et al., 2016, Science, 352, 1559
- Kawabe et al. (2016) Kawabe R., Kohno K., Tamura Y., Takekoshi T., Oshima T., Ishii S., 2016, in Society of Photo-Optical Instrumentation Engineers (SPIE) Conference Series, Vol. 9906, Ground-based and Airborne Telescopes VI, p. 990626
- Khandai et al. (2015) Khandai N., Di Matteo T., Croft R., Wilkins S., Feng Y., Tucker E., DeGraf C., Liu M.-S., 2015, MNRAS, 450, 1349
- Komatsu et al. (2011) Komatsu E. et al., 2011, ApJS, 192, 18
- Konno et al. (2014) Konno A. et al., 2014, ApJ, 797, 16
- Kovetz et al. (2017) Kovetz E. D. et al., 2017, arXiv e-prints, arXiv:1709.09066
- Kubota et al. (2018) Kubota K., Yoshiura S., Takahashi K., Hasegawa K., Yajima H., Ouchi M., Pindor B., Webster R. L., 2018, MNRAS, 479, 2754
- Laporte et al. (2017) Laporte N. et al., 2017, ApJ, 837, L21
- Lidz et al. (2009) Lidz A., Zahn O., Furlanetto S. R., McQuinn M., Hernquist L., Zaldarriaga M., 2009, ApJ, 690, 252
- Maselli, Ciardi & Kanekar (2009) Maselli A., Ciardi B., Kanekar A., 2009, MNRAS, 393, 171
- Maselli, Ferrara & Ciardi (2003) Maselli A., Ferrara A., Ciardi B., 2003, MNRAS, 345, 379
- McGreer, Mesinger & D’Odorico (2015) McGreer I. D., Mesinger A., D’Odorico V., 2015, MNRAS, 447, 499
- Monsalve et al. (2019) Monsalve R. A., Fialkov A., Bowman J. D., Rogers A. E. E., Mozdzen T. J., Cohen A., Barkana R., Mahesh N., 2019, ApJ, 875, 67
- Moriwaki et al. (2018) Moriwaki K. et al., 2018, MNRAS, 481, L84
- Panuzzo et al. (2003) Panuzzo P., Bressan A., Granato G. L., Silva L., Danese L., 2003, A&A, 409, 99
- Planck Collaboration VI (2018) Planck Collaboration VI, 2018, arXiv e-prints, arXiv:1807.06209
- Planck Collaboration XIII (2016) Planck Collaboration XIII, 2016, A&A, 594, A13
- Sanders et al. (2016) Sanders R. L. et al., 2016, ApJ, 816, 23
- Silva et al. (2015) Silva M., Santos M. G., Cooray A., Gong Y., 2015, ApJ, 806, 209
- Singh et al. (2018) Singh S. et al., 2018, ApJ, 858, 54
- Springel (2005) Springel V., 2005, MNRAS, 364, 1105
- Springel & Hernquist (2003) Springel V., Hernquist L., 2003, MNRAS, 339, 289
- Tamura et al. (2019) Tamura Y. et al., 2019, ApJ, 874, 27
- Visbal & Loeb (2010) Visbal E., Loeb A., 2010, J. Cosmology Astropart. Phys, 11, 016
- Vrbanec et al. (2016) Vrbanec D. et al., 2016, MNRAS, 457, 666
- Waterson et al. (2016) Waterson M. F., Labate M. G., Schnetler H., Wagg J., Turner W., Dewdney P., 2016, in Proc. SPIE, Vol. 9906, Ground-based and Airborne Telescopes VI, p. 990628
- Wiersma et al. (2013) Wiersma R. P. C. et al., 2013, MNRAS, 432, 2615