Second Outburst of the Yellow Symbiotic Star
LT Delphini
We present the results of our photoelectric observations of the yellow symbiotic star LT Del over 2010–2018. The binary system LT Del, which consists of a bright K giant and a compact hot star with a temperature of 100 000 K, has an orbital period of 476 days. In 2017 the variable experienced a second low-amplitude () outburst in the history of its studies whose maximum occurred at an orbital phase of 0.150.05. The outburst duration was 60 days. The and colors in the outburst became noticeably bluer. A difference in the photometric behavior of the star in the 1994 and 2017 outburst has been detected. In the orbital cycle preceding the 2017 outburst a secondary minimum with a depth of and appeared in the and light curves, respectively, whose cause is discussed. The phase light and color curves are presented and explained; the position of the star on the color–color diagram is interpreted. We have estimated the parameters of the cool and hot components of the system based on the distance determination from Gaia DR2.
Keywords: symbiotic stars, binary systems, photometric observations.
Introduction
The emission-line object He 2-467 from the catalogue of Henize (1967), which was deemed a planetary nebula for some time after its discovery, was assigned by Kaler and Lutz (1980) to a small group of yellow symbiotic stars whose cool components have a spectral type no later than K5. The binary system He 2-467 consists of a bright G or K giant and a compact hot star with a temperature of K. The emission-line spectrum is excited by radiation from the hot star and consists of hydrogen, neutral and ionized helium lines in the optical band. Based on infrared (IR) photometry, Allen (1984) classified He 2-467 as an S-type symbiotic star, a binary system without a circumstellar dust envelope.
The photometric variability of He 2-467 was discovered by Arkhipova and Noskova (1985). The authors detected a periodicity of its brightness variations in the bands with a period of 480 days. The shape of the light curves and the growth of the amplitude from to suggested that the variability is related to the so-called reflection effect, i.e., the heating and ionization of the upper atmospheric layers of the cool component facing the hot one by white dwarf radiation. Based on the results of this paper, the star was included in the catalogue of variable stars (Samus’ et al. 2017) and was designated as LT Del. In subsequent papers the period was refined and the ephemeris JD(Min) = 2445930 + 476.d0 was adopted based on the 1982–2009 observations (Arkhipova et al. 2011).
In 1994 the star experienced the first outburst that was detected by Passuello et al. (1994) and studied in detail by Arkhipova et al. (1995a, 1995b). This event allowed LT Del to be attributed to classical symbiotic stars. Arkhipova et al. (2011) showed that the system’s cool component does not fill its Roche lobe, the mass loss occurs in the form of a stellar wind with a rate yr-1, and the outburst activity is associated with slight variations in the rate of mass loss by the cool component.
In 2017 Munari et al. (2017) reported the detection of a new outburst. In this paper we present the results of our photoelectric observations over the period from 2010 to 2018, describe the 2017 outburst, and compare the photometric behaviors of the star in 1994 and 2017.
Observations
Systematic photoelectric observations of LT Del have been performed with a Zeiss-1 telescope at the Crimean Station of the Sternberg Astronomical Institute of the Moscow State University using a photoelectric photometer designed by V.M. Lyutyi (1971) since 1982. The results of the observations before 2010 were published in Arkhipova and Noskova (1985, 1988) and Arkhipova et al. (1995a, 2011).
The observations in 2010–2018 were carried out at the same telescope with the same photometer with a 13′′ aperture. The star BD+19∘4458 with the following magnitudes was used as a photometric standard: , and . We estimate the accuracy of the observations to be in and and at least in depending on the brightness level. More than 100 -magnitude estimates were obtained from 2010 to 2018. The results of the observations are presented in Table LABEL:ubv.
| JD | |||||
|---|---|---|---|---|---|
| 2455305 | 13.050 | 14.360 | 14.210 | 1.310 | -0.150 |
| 2455329 | 13.040 | 14.310 | 14.350 | 1.270 | 0.040 |
| 2455337 | 12.980 | 14.380 | 14.420 | 1.400 | 0.040 |
| 2455385 | 13.270 | 14.700 | 14.790 | 1.430 | 0.090 |
| 2455416 | 13.270 | 15.000 | 14.880 | 1.730 | -0.120 |
| 2455444 | 13.160 | 14.800 | 15.160 | 1.640 | 0.360 |
| 2455448 | 13.150 | 14.670 | 15.120 | 1.520 | 0.450 |
| 2455454 | 13.070 | 14.510 | 14.920 | 1.440 | 0.410 |
| 2455455 | 13.090 | 14.540 | 14.890 | 1.450 | 0.350 |
| 2455502 | 13.080 | 14.470 | 14.560 | 1.300 | 0.090 |
| 2455505 | 13.100 | 14.450 | 14.560 | 1.350 | 0.110 |
| 2455507 | 13.100 | 14.460 | 14.570 | 1.360 | 0.110 |
| 2455508 | 13.090 | 14.490 | 14.540 | 1.400 | 0.050 |
| 2455717 | 13.020 | 14.280 | 13.680 | 1.260 | -0.600 |
| 2455719 | 13.070 | 14.270 | 13.700 | 1.200 | -0.570 |
| 2455743 | 12.970 | 14.310 | 13.790 | 1.340 | -0.520 |
| 2455745 | 13.050 | 14.280 | 13.870 | 1.230 | -0.410 |
| 2455750 | 13.050 | 14.310 | 13.870 | 1.260 | -0.440 |
| 2455751 | 13.040 | 14.310 | 13.880 | 1.270 | -0.430 |
| 2455774 | 13.030 | 14.340 | 14.010 | 1.310 | -0.330 |
| 2455778 | 13.060 | 14.360 | 14.080 | 1.300 | -0.280 |
| 2455781 | 13.050 | 14.370 | 14.030 | 1.320 | -0.340 |
| 2455809 | 13.110 | 14.480 | 14.340 | 1.370 | -0.140 |
| 2455810 | 13.100 | 14.440 | 14.450 | 1.340 | 0.010 |
| 2455831 | 13.120 | 14.500 | 14.530 | 1.380 | 0.030 |
| 2455832 | 13.130 | 14.540 | 14.490 | 1.410 | -0.050 |
| 2455862 | 13.230 | 14.620 | 14.470 | 1.390 | -0.150 |
| 2456040 | 13.029 | 14.335 | 13.959 | 1.307 | -0.376 |
| 2456043 | 13.038 | 14.325 | 14.243 | 1.287 | -0.082 |
| 2456097 | 13.152 | 14.337 | 13.817 | 1.185 | -0.520 |
| 2456182 | 13.029 | 14.291 | 13.693 | 1.262 | -0.598 |
| 2456185 | 13.013 | 14.390 | 13.734 | 1.377 | -0.656 |
| 2456186 | 13.026 | 14.313 | 13.712 | 1.287 | -0.601 |
| 2456216 | 13.094 | 14.368 | 13.911 | 1.273 | -0.457 |
| 2456247 | 12.944 | 14.374 | 14.228 | 1.430 | -0.147 |
| 2456249 | 13.018 | 14.374 | 14.009 | 1.356 | -0.365 |
| 2456431 | 13.145 | 14.575 | 14.672 | 1.430 | 0.096 |
| 2456451 | 13.135 | 14.495 | 14.593 | 1.360 | 0.099 |
| 2456454 | 13.099 | 14.472 | 14.538 | 1.373 | 0.066 |
| 2456480 | 13.096 | 14.428 | 14.361 | 1.331 | -0.067 |
| 2456510 | 13.089 | 14.389 | 13.991 | 1.300 | -0.398 |
| 2456514 | 13.066 | 14.383 | 14.094 | 1.318 | -0.290 |
| 2456534 | 13.096 | 14.397 | 13.975 | 1.301 | -0.421 |
| 2456537 | 13.091 | 14.379 | 13.859 | 1.288 | -0.520 |
| 2456574 | 13.085 | 14.362 | 13.766 | 1.277 | -0.597 |
| 2456591 | 13.079 | 14.312 | 13.720 | 1.233 | -0.592 |
| 2456784 | 13.165 | 14.562 | 14.639 | 1.397 | 0.077 |
| 2456832 | 13.184 | 14.710 | 15.207 | 1.526 | 0.496 |
| 2456837 | 13.161 | 14.703 | 15.366 | 1.542 | 0.663 |
| 2456860 | 13.202 | 14.777 | 15.435 | 1.575 | 0.657 |
| 2456870 | 13.211 | 14.754 | 15.485 | 1.543 | 0.731 |
| 2456893 | 13.202 | 14.610 | 14.892 | 1.408 | 0.282 |
| 2456930 | 13.058 | 14.494 | 14.580 | 1.436 | 0.087 |
| 2456960 | 13.085 | 14.353 | 14.351 | 1.269 | -0.002 |
| 2457006 | 13.018 | 14.489 | 14.011 | 1.471 | -0.478 |
| 2457167 | 13.017 | 14.330 | 13.898 | 1.313 | -0.431 |
| 2457189 | 13.030 | 14.371 | 14.183 | 1.341 | -0.188 |
| 2457217 | 13.103 | 14.479 | 14.349 | 1.376 | -0.130 |
| 2457248 | 13.127 | 14.493 | 14.571 | 1.367 | 0.078 |
| 2457249 | 13.107 | 14.536 | 14.670 | 1.428 | 0.134 |
| 2457250 | 13.073 | 14.516 | 14.617 | 1.443 | 0.101 |
| 2457270 | 13.058 | 14.495 | 14.605 | 1.437 | 0.110 |
| 2457281 | 13.139 | 14.535 | 14.771 | 1.396 | 0.236 |
| 2457301 | 13.170 | 14.624 | 15.122 | 1.454 | 0.498 |
| 2457516 | 13.045 | 14.270 | 13.645 | 1.224 | -0.625 |
| 2457544 | 13.011 | 14.196 | 13.423 | 1.185 | -0.773 |
| 2457545 | 13.032 | 14.237 | 13.419 | 1.205 | -0.818 |
| 2457548 | 13.036 | 14.195 | 13.384 | 1.159 | -0.811 |
| 2457578 | 13.260 | 14.338 | 13.423 | 1.078 | -0.915 |
| 2457600 | 13.203 | 14.280 | 13.132 | 1.077 | -1.148 |
| 2457602 | 13.259 | 14.270 | 13.172 | 1.011 | -1.098 |
| 2457608 | 13.195 | 14.318 | 13.253 | 1.124 | -1.066 |
| 2457612 | 13.222 | 14.279 | 13.219 | 1.057 | -1.060 |
| 2457634 | 13.070 | 14.239 | 13.325 | 1.169 | -0.913 |
| 2457635 | 13.118 | 14.254 | 13.393 | 1.136 | -0.861 |
| 2457639 | 13.089 | 14.206 | 13.500 | 1.117 | -0.706 |
| 2457640 | 13.127 | 14.217 | 13.416 | 1.090 | -0.801 |
| 2457662 | 13.057 | 14.223 | 13.698 | 1.166 | -0.525 |
| 2457714 | 13.063 | 14.377 | 14.222 | 1.315 | -0.156 |
| 2457875 | 12.478 | 13.315 | 12.346 | 0.837 | -0.970 |
| 2457878 | 12.400 | 13.261 | 12.232 | 0.861 | -1.029 |
| 2457905 | 12.366 | 13.113 | 11.971 | 0.746 | -1.140 |
| 2457907 | 12.368 | 13.129 | 11.938 | 0.761 | -1.191 |
| 2457921 | 12.360 | 13.157 | 11.941 | 0.797 | -1.216 |
| 2457930 | 12.368 | 13.178 | 11.962 | 0.810 | -1.216 |
| 2457931 | 12.421 | 13.189 | 11.972 | 0.769 | -1.217 |
| 2457932 | 12.401 | 13.187 | 11.950 | 0.785 | -1.237 |
| 2457934 | 12.389 | 13.185 | 11.989 | 0.796 | -1.197 |
| 2457935 | 12.436 | 13.221 | 11.953 | 0.784 | -1.268 |
| 2457936 | 12.409 | 13.210 | 11.956 | 0.801 | -1.254 |
| 2457950 | 12.573 | 13.391 | 12.145 | 0.818 | -1.246 |
| 2457985 | 12.858 | 13.764 | 12.691 | 0.906 | -1.073 |
| 2457990 | 12.887 | 13.769 | 12.683 | 0.882 | -1.086 |
| 2457994 | 12.917 | 13.844 | 12.771 | 0.927 | -1.073 |
| 2458010 | 13.040 | 13.984 | 13.016 | 0.944 | -0.968 |
| 2458011 | 13.071 | 14.019 | 13.063 | 0.948 | -0.955 |
| 2458013 | 13.065 | 14.011 | 13.068 | 0.946 | -0.942 |
| 2458015 | 13.104 | 14.073 | 13.156 | 0.970 | -0.918 |
| 2458044 | 13.088 | 14.047 | 13.127 | 0.960 | -0.921 |
| 2458253 | 13.163 | 14.616 | 15.115 | 1.453 | 0.498 |
| 2458281 | 13.176 | 14.688 | 15.283 | 1.512 | 0.595 |
| 2458290 | 13.152 | 14.657 | 15.104 | 1.505 | 0.448 |
| 2458309 | 13.104 | 14.496 | 14.744 | 1.391 | 0.249 |
| 2458311 | 13.129 | 14.539 | 14.677 | 1.411 | 0.137 |
| 2458337 | 13.150 | 14.548 | 14.618 | 1.398 | 0.070 |
| 2458338 | 13.075 | 14.494 | 14.706 | 1.418 | 0.212 |
| 2458339 | 13.122 | 14.535 | 14.714 | 1.414 | 0.178 |
| 2458342 | 13.121 | 14.521 | 14.696 | 1.400 | 0.175 |
| 2458344 | 13.099 | 14.493 | 14.671 | 1.394 | 0.177 |
| 2458351 | 13.090 | 14.493 | 14.693 | 1.403 | 0.200 |
| 2458366 | 13.101 | 14.435 | 14.344 | 1.333 | -0.091 |
| 2458374 | 13.074 | 14.404 | 14.196 | 1.330 | -0.207 |
| 2458401 | 13.045 | 14.381 | 13.979 | 1.336 | -0.402 |
Analysis of our photometry
Light and color curves
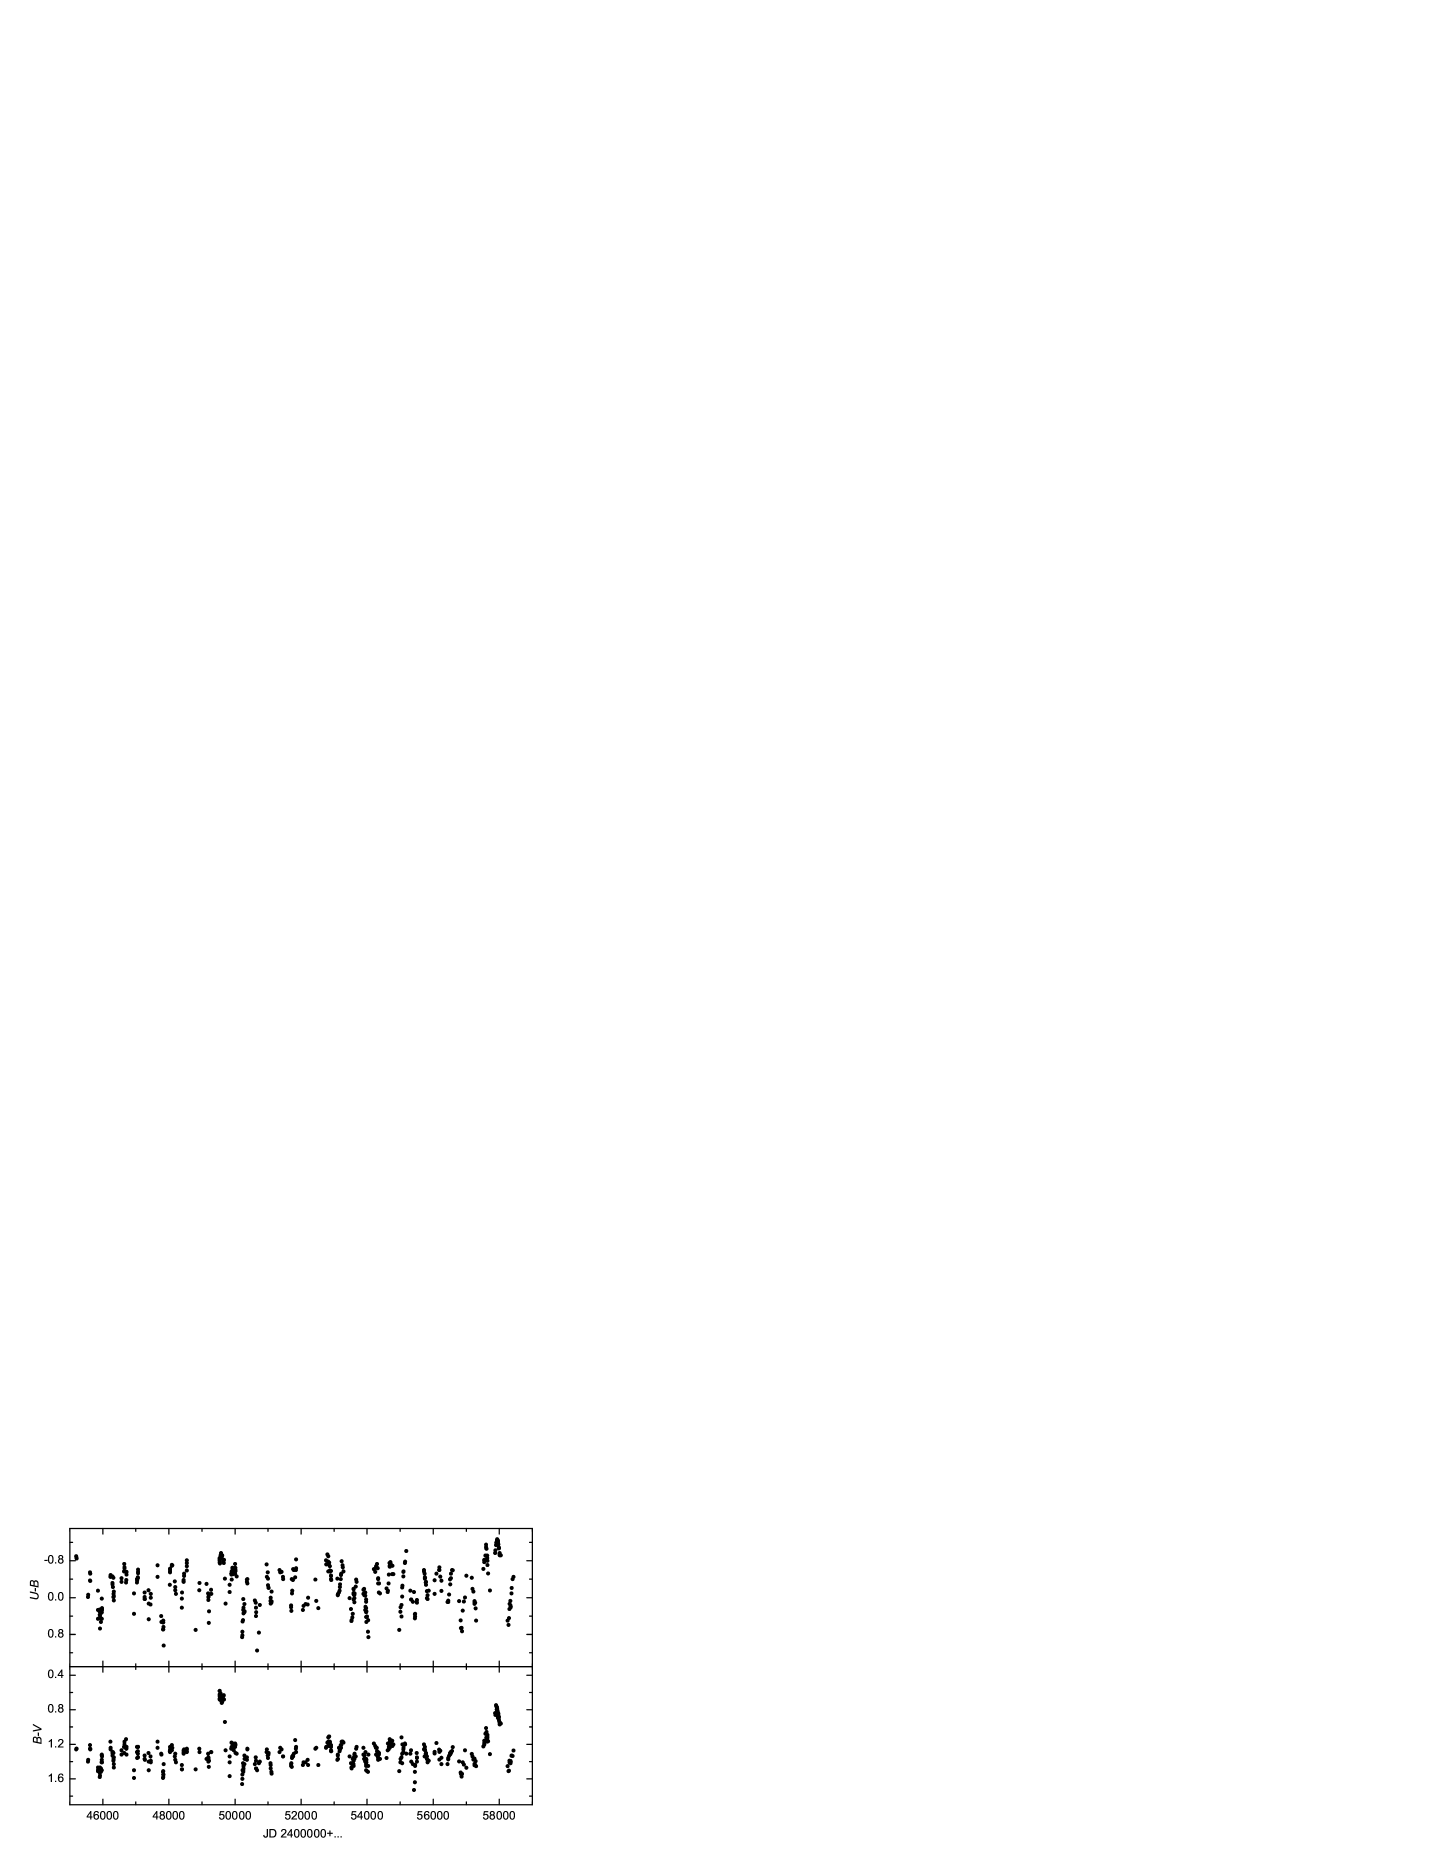
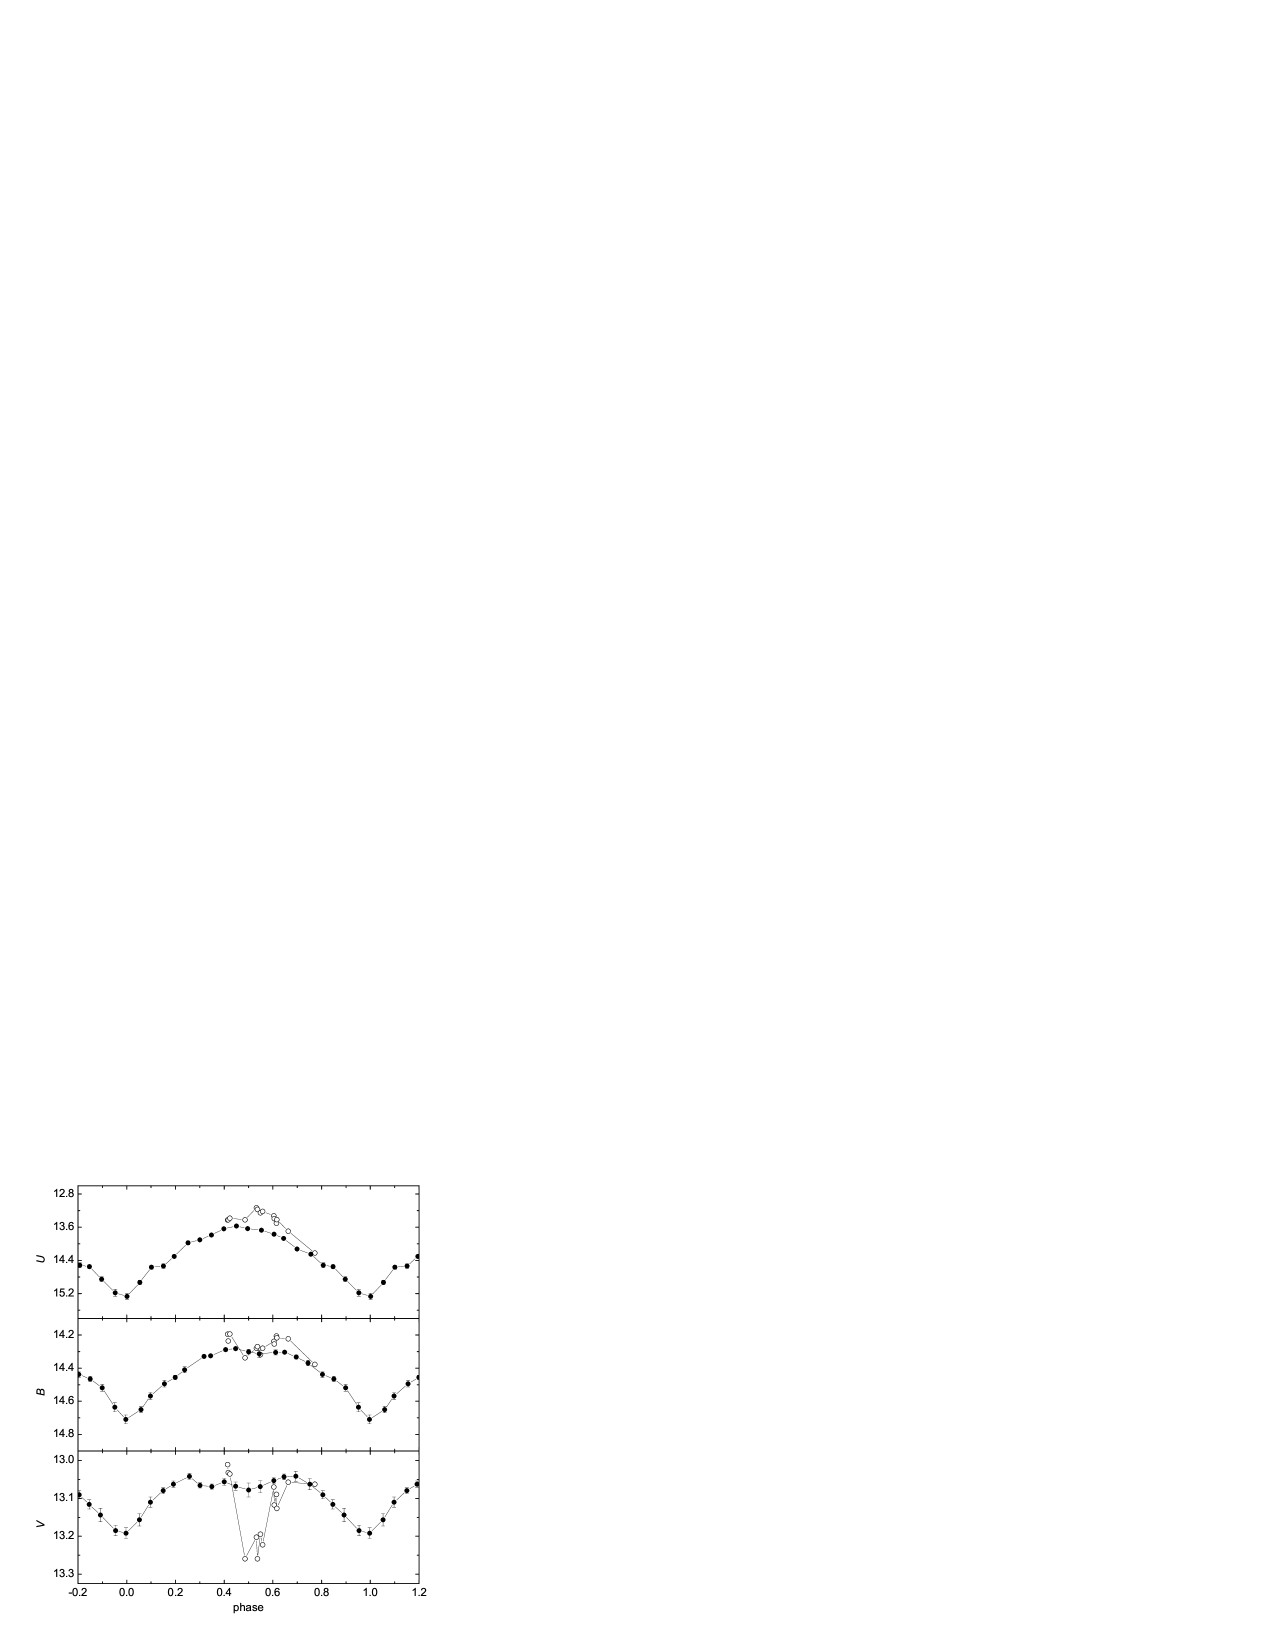
Figures 1 and 2 show, respectively, the light and color curves of LT Del over the entire period of its photoelectric observations in Crimea from 1982 to 2018. In this time the star experienced two low amplitude outbursts. Outside the outbursts the photometric variability is related to the changes in the visibility conditions of the ionization region during the orbital motion. The amplitude of the brightness variations increases with decreasing wavelength and is: , , . The mean magnitudes of the variable in quiescence are: , , . Figure 3 presents the phase light curves averaged with a phase step of 0.05 over the period of observations from 1982 to 2015, except for the 1994 event. They were computed with the linear elements: JD(Min) = 2445930 + 476.d0 from Arkhipova et al. (2011). The phase of minimum light 0.0 corresponds to the position when the cool component is in front of the hot one.
The shape of the orbital and light curves for LT Del is nearly sinusoidal, whereas a fairly broad maximum and a slight fading at phase 0.5 are observed in the band. To describe the shape of the light curve, Skopal (2001) proposed to use the parameter
, (1)
where , , and are the magnitudes at minimum light, at phase 0.25, and at maximum light, respectively. For LT Del we obtained , , . A value of points to the presence of a secondary minimum in the light curve. Skopal (2001) discussed in detail the reflection effect as a possible cause of the observed periodic variability of a number of symbiotic stars. The reflection effect was shown to produce a strictly periodic modulation of the light with orbital phase at ; the amplitude of the brightness variations should not exceed in this case. It was concluded that the observational characteristics of the light curves for individual symbiotic binaries (including LT Del) cannot be reproduced by the reflection effect, but are caused by a variation in the emission measure () of the gas component with orbital phase.

In 1994 the star experienced the first outburst in the history of its observations with amplitudes , , , during which and became, respectively, noticeably and slightly bluer. The outburst was observed at orbital phases 0.57–0.90 and lasted 160 days.
A second such event occurred 23 years later (in 2017). At the very beginning of the observing season (May 2, 2017) we caught the star in a bright state. A report on the outburst of LT Del appeared several days later (Munari et al. 2017). According to Munari et al. (2017), on May 6, 2017, the star had magnitudes , , , , and and was almost as bright as in the 1994 outburst. All its colors became bluer.
Over the entire 2017 season we observed the star in some detail and traced its photometric behavior from May 2 to October 15. The amplitudes of the new outburst were: , , and . The and colors became noticeably bluer. The star stayed in the brightest state for 60 days, whereupon it began to fade with a rate of per day in the band. By the end of the 2017 observing season the brightness of LT Del dropped to its mean values for the corresponding phases, whereas in the and bands the star remained brighter.
Table 2 gives some characteristics of the two outbursts of LT Del: the duration (), the orbital phases at which the outburst occurred, the maximum brightness, colors, and amplitudes of the outbursts. Some difference in the photometric behavior of the star in the two outbursts should be noted. The 1994 outburst was more prolonged. At an approximately equal amplitude of the outbursts in the band the color differed. The 1994 outburst was bluer in and redder in .
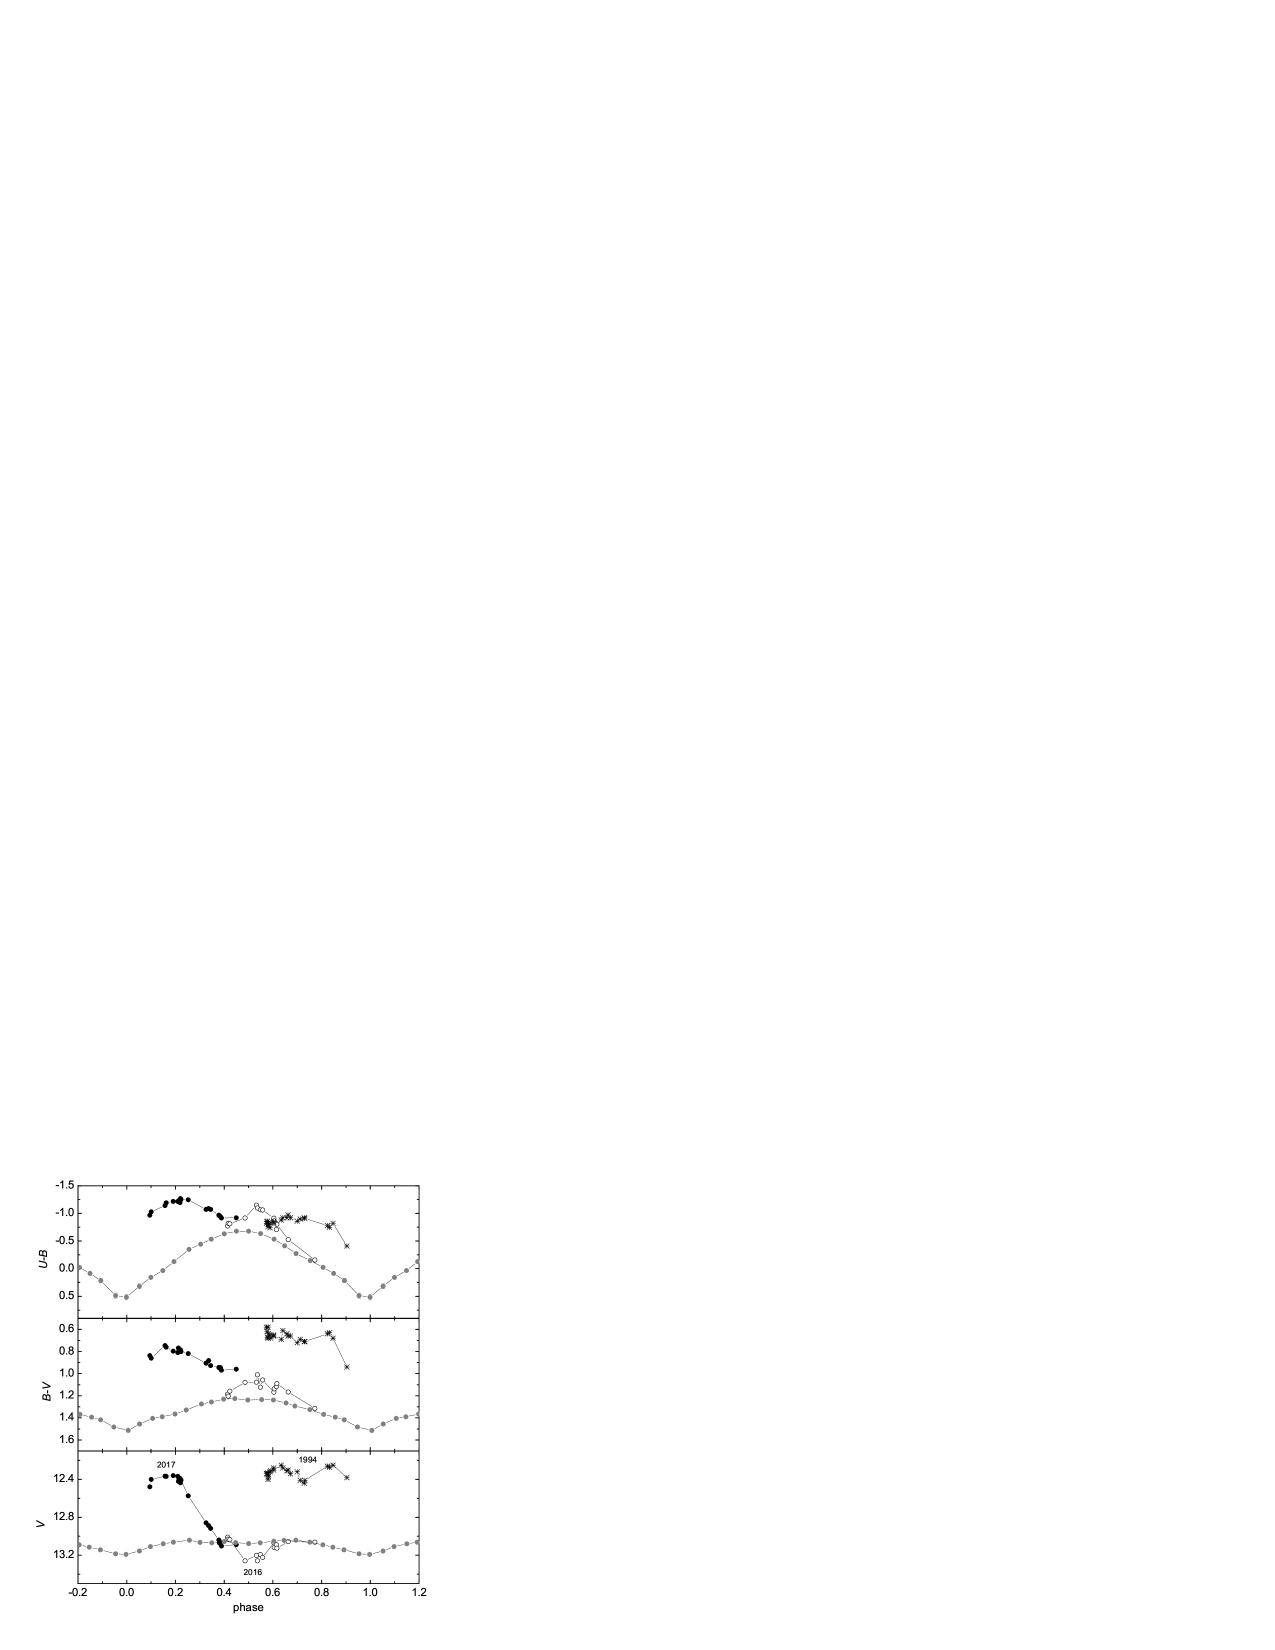
Figure 4 show the average phase light and color curves for quiescence and the position of the star in the 1994 and 2017 outbursts as well as in the preoutburst state in 2016, which should be discussed in more detail.
In 2016 we carried out the observations from May 7 to November 21 at orbital phases 0.4–0.8. The open circles in the phase curves (Figs. 3 and 4) indicate the 2016 observations. In 2016 the star is seen to have deviated noticeably from the average state. In the band the star became brighter by , depending on the phase; in the band a minor (about ) fading was observed against the background of a general slight brightening at phases 0.4–0.6. A deep secondary minimum compared to the average level appeared at these phases in the band. In 2016 the depth of the secondary minimum in the band was and exceeded the depth of the primary minimum. The and colors in 2016 became bluer than those in quiescence at the same orbital phases.
| Year | , d | Phases | ||||||||
|---|---|---|---|---|---|---|---|---|---|---|
| 1994 | 157 | 0.57-0.90 | 12.25 | 12.90 | 11.98 | 0.61 | –0.92 | |||
| 2017 | 60 | 0.10-0.20 | 12.35 | 13.12 | 11.94 | 0.76 | –1.25 |
color–color diagram
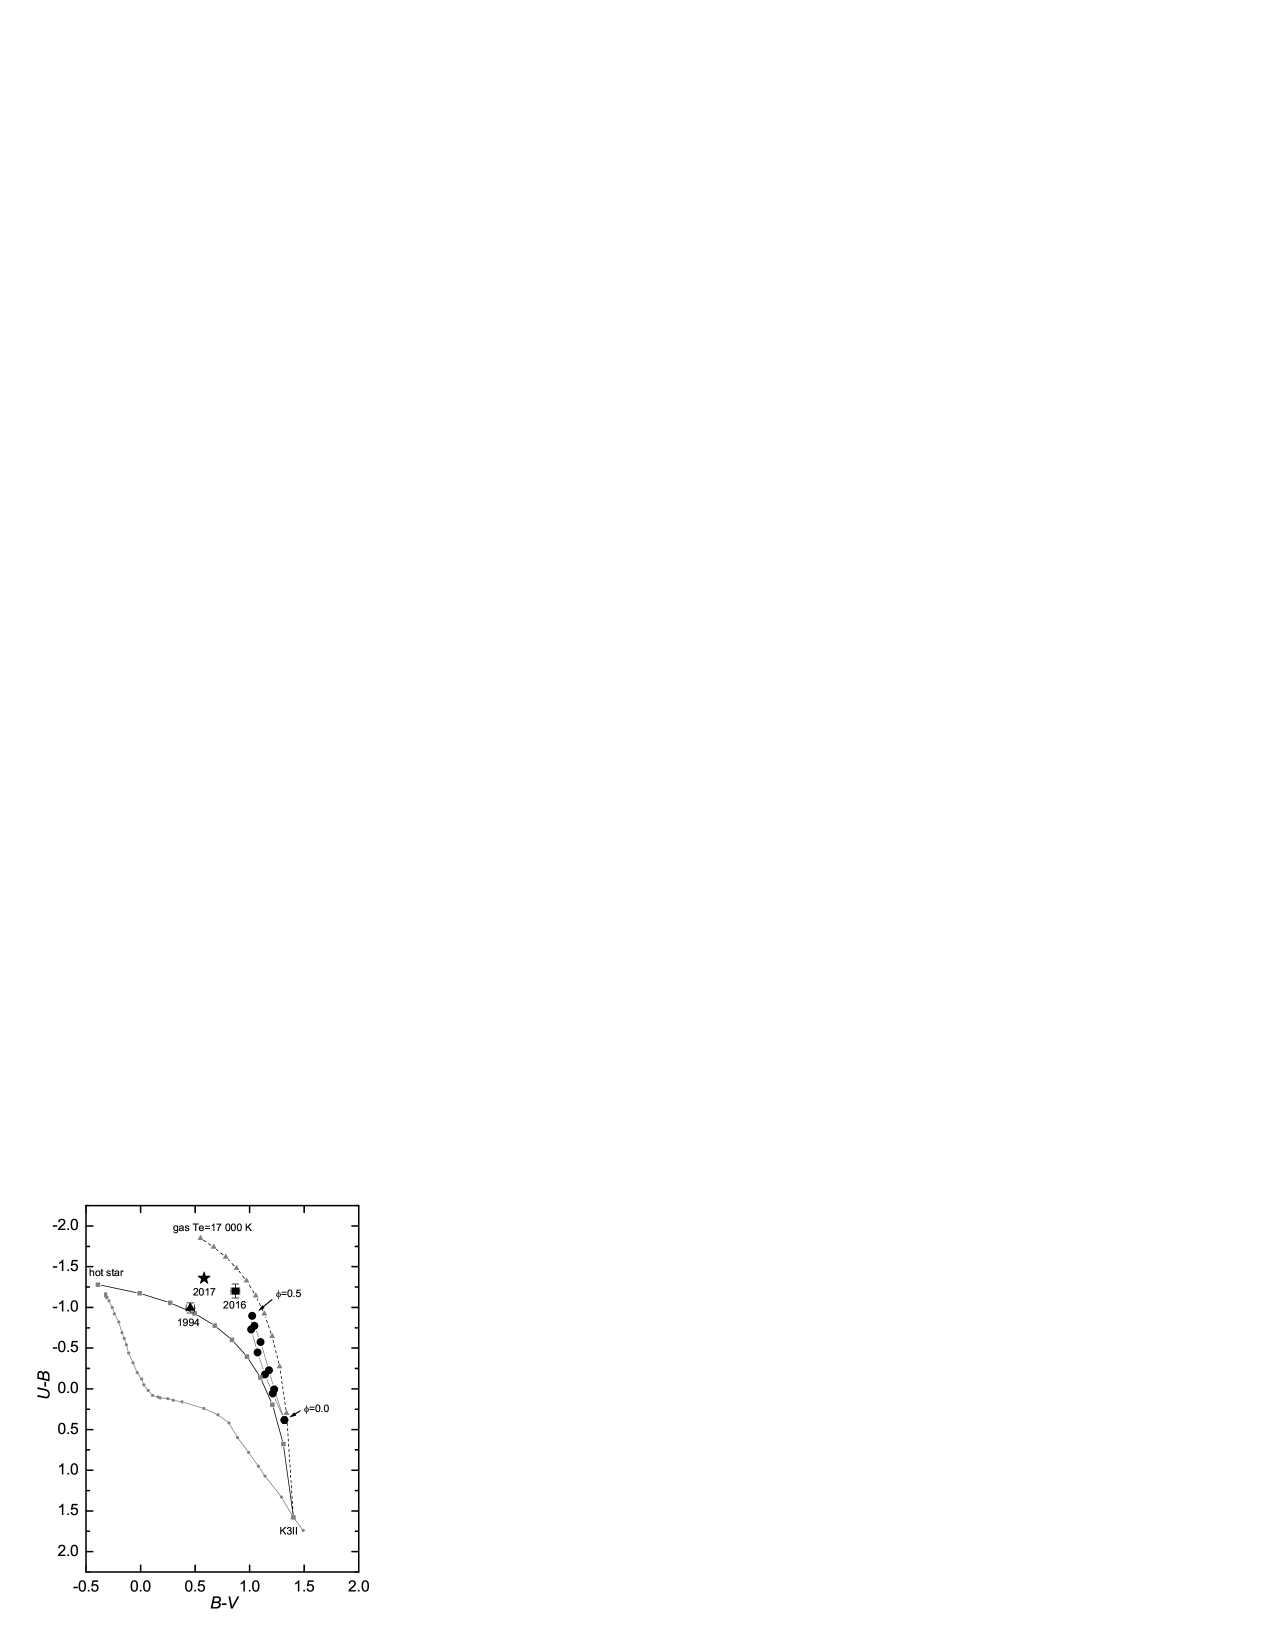
Consider the pattern of color variations in LT Del on the color–color diagram. We corrected the observed colors for reddening with (Skopal 2005) and plotted the observations in quiescence averaged over the phase with a 0.1 step and the data referring to the 1994 and 2017 outbursts and the pre-outburst state in 2016 on this diagram (Fig. 5). The positions of the hot star (a blackbody with a temperature above 50 000 K), the gas continuum with an electron temperature K (Skopal 2005), and the sequence of bright giants (luminosity class II) (Schmidt-Kaler 1982) are also shown on the graph. For the cool component we adopted the spectral type K3 II in accordance with the results of Arkhipova et al. (2011). The figure also plots the colors of the total emission with a variable fraction of the contribution: (1) the cool component and the gas continuum; (2) the cool component and the hot star.
The position of LT Del in the color–color diagram changes significantly with orbital phase. In quiescence the variable moves upward and leftward from phase 0.0 to 0.5 approximately along the line that represents the total emission from a bright K3 II giant and a variable gas continuum. The range is about when changes by . Arkhipova and Noskova (1988) and Arkhipova et al. (1995a) interpreted this motion as the result of a change in the visibility of the gas component during the orbital motion of the binary components.
At minimum light, when the contribution of the hot component (subdwarf+gas continuum) to the total emission from the system is no more than 10 %, the mean observed magnitudes and colors are: , , , , and . Assuming that the cool star contributes about 90 % in the band to the total emission from the system, we obtained the following magnitudes for it: , , and . In the band the red giant accounts for about 97 % of the emission, while in the band its contribution is 30 %.
In the pre-outburst state in 2016 during its deep secondary minimum LT Del on the color–color diagram shifted relative to the average position at phases 0.5–0.6 upward and leftward, which can be explained by a reduction in the contribution of the cool component due to the ellipticity effect (discussed below) and an enhancement of the emission-line spectrum of the ionized region.
In the outbursts the variable on the color–color diagram deviated noticeably from the track of its quiescent state. In 1994 it moved toward hot stars, which points to a noticeable increase in the contribution of the hot star to the total emission from the system. In 1994 the main contributors to the emission were the erupted subdwarf and the cool star with a flux ratio of 2:1 in the band. According to Arkhipova et al. (1995b), the shape of the emission-line spectrum for LT Del in 1994 underwent no significant changes compared to its quiescent state and the contribution of the emission lines to the system’s bands was minor.
In the 2017 outburst the ratio of the components in the system’s emission changed differently than in 1994. The influence of the gas component grew together with a possible increase in the contribution of the hot star. According to Ikonnikova et al. (2019), the emission-line fluxes in the optical spectrum of LT Del increased noticeably (by a factor of 5–10). In the band the contribution of the strongest HeII 4686 and H lines to the total emission grew by 13 %, which led to a bluing of the color. Munari et al. (2017) reported the appearance of the high excitation OIII 3444 and 3429, OIV 3411, [Ne V] 3345 and 3427, lines in the outburst, whose contribution to the band can be noticeable. Furthermore, the contribution of the nebular continuum increased. In its brightest state in 2017 LT Del had magnitudes , , and . After the subtraction of the cool star with the above magnitudes, the observed magnitudes of the hot component (star + gas component and emission lines) in the 2017 outburst were , , and . Estimating the contribution of the hot star causes difficulties without additional data on the ultraviolet (UV) emission from the system.
Secondary minimum in 2016
We found that in the orbital cycle before the 2017 outburst a secondary minimum, which was barely visible in previous years, clearly manifested itself in the and light curves. Both the ellipticity of the cool component and its eclipse by the hot star can be responsible for this phenomenon.
Consider the possibility of an eclipse of the cool component by the hot subdwarf that increased its size. In the band the main contributor to the system’s emission is the cool star. The depth of the secondary minimum in 2016, , corresponds to a decrease in the flux and, accordingly, the area of the disk of the cool star by a factor of =1.2. In the case of a central eclipse, when the minimum possible increase in the size of the hot star is required, from the relation for =1.2 we obtain , i.e., the giant and the hot subdwarf must have comparable sizes. As will be shown below, , and then . According to spectroscopic observations, the temperature of the hot star in 2016 did not decrease; consequently, such a significant increase in the radius compared to the system s quiescent state, when the subdwarf has a radius , would entail a manifold increase in the system’s luminosity, which was not observed. It remains to recognize that the secondary minimum was caused by a manifestation of the giant’s ellipticity before the 2017 outburst. However, this interpretation is also questioned, as shown in the Section ”Distance and Estimation of Component Parameters” .
The phenomenon detected by us together with the model calculations of light curves will be discussed later.
Distance and estimation of component parameters
Using the color–color diagram and the results of Skopal (2005), we estimated the magnitudes of the components of the binary system LT Del.
At the phase of maximum light () only one UV spectrum of LT Del was obtained from the IUE satellite on June 14, 1990. These data together with the photometric observations in a wide wavelength range, from 0.36 () to 5.5 () m, from Munari and Buson (1992) allowed Skopal (2005) to construct the spectral energy distribution for LT Del at this orbital phase and to represent it by three components: a hot star with K, a gas continuum with K, and a cool component with K. Using Fig. 12 from Skopal (2005), we estimated the magnitudes of the hot star corrected for reddening with to be , , and . The accuracy of these estimates is .
At minimum light, when the cool star contributes about 90 % to the total emission from the system in , we obtained the following observed magnitudes for it: , , . The magnitude of the cool star corrected for reddening with is .
One cannot but note the distance determination for LT Del based on the latestGaia data. A simple passage from theGaia DR2 parallax mas (Gaia Collaboration, 2018) to the distance led to an unrealistic value. Using a more complex procedure allowed Bailer-Jones et al. (2018) to get the distance pc with the confidence interval 4612–7533 pc. LT Del has the following Galactic coordinates and . With its new distance estimate the z coordinate for the star is pc.
Given the distance and adopting the dereddened magnitude of the cool component , we obtained its absolute magnitude by taking into account the distance errors: . With this the cool star occupies an intermediate position between a giant of spectral type K3 with and a bright K3 giant with (Straižys 1982). Taking the bolometric correction as a mean between and (Straižys 1982), we obtained the bolometric absolute magnitude of the cool star and its luminosity or . For a star with K (Pereira et al. 1998) the radius is . With the deduced parameters and given the chemical composition [Fe/H]=–1.1 (Pereira et al. 1998), the position of the cool giant on the Hertzsprung–Russell diagram is consistent with the evolutionary track of a star with metallicity =0.001 and mass 0.93 at the red giant stage (Charbonnel et al. 1996).
We also estimated the luminosity of the hot star in the system LT Del. As has been shown above, the subdwarf in quiescence has a magnitude corrected for reddening with of , implying for a distance pc. We calculated the bolometric correction using the equation from Vacca et al. (1996). For K (Skopal 2005) we obtained . With this the hot star has a bolometric absolute magnitude and a luminosity or . The radius of the subdwarf is estimated to be . According to the present-day evolutionary model at late stages of intermediate-mass stars by Miller Bertolami (2016), the hot subdwarf in the system LT Del with the above parameters K, , and =0.001 has a mass of 0.57.
With the new mass estimates for the components of the binary system with an orbital period under the assumption of a circular orbit, we estimated the separation between the components to be 294, and the Roche lobe size for the cool giant to be 85. Consequently, the star with a radius in the system LT Del does not fill its Roche lobe and its shape is not distorted by the tidal interaction with the hot component. This casts doubt on the conclusion about a possible ellipticity of the cool component as the cause of the secondary minimum in the light curve in 2016.
Conclusions
In 2010–2018 we obtained new photoelectric observations of the yellow symbiotic star LT Del. Based on our data and the results of other authors, in particular, the latest distance determination, we reached the following conclusions:
(1) An outburst with amplitudes , , and . was shown to have occurred in the binary system in 2017. The outburst duration was 60 days. In the outburst the star had considerably bluer colors than in quiescence.
(2) A comparison of the 1994 and 2017 outbursts showed their difference. The 1994 event was more prolonged. At an approximately equal amplitude in the band, the 1994 outburst was bluer in and redder in than the 2017 event. This points to a larger contribution of the gas component in 2017. Given the 2017 spectroscopic data, which showed a noticeable strengthening of high-excitation lines, it can be hypothesized that in 2017 the temperature of the hot star rose, while in the 1994 outburst the compact object became cooler, as shown in Arkhipova et al. (1995b).
(3) In the pre-outburst state in 2016 secondary minima were observed in the and light curves at orbital phases 0.4–0.6, a reasonable interpretation of which requires additional knowledge of the binary system.
(4) We estimated the parameters of the cool and hot components of the system by taking into account the direct distance determination for the binary system fromGaia data. The cool star was found to be a yellow giant with and , while the hot subdwarf has and . A comparison of the deduced binary component parameters with theoretical evolutionary tracks allowed the component masses to be estimated: and .
REFERENCES
-
1.
Allen D.A. , Proc. Astron. Soc. Austral. 5, 369 (1984).
-
2.
Arkhipova V.P., Esipov V.F., and Ikonnikova N.P., Astron. Lett. 21, 439 (1995b).
-
3.
Arkhipova V.P., Esipov V.F., Ikonnikova N.P., Komissarova G.V., and Noskova R.I., Astron. Lett. 37, 377 (2011).
-
4.
Arkhipova V.P., Ikonnikova N.P., and Noskova R.I., Astron. Lett. 21, 379 (1995a).
-
5.
Arkhipova V.P. and Noskova R.I., Astron. Lett. 11, 706 (1985).
-
6.
Arkhipova V.P. and Noskova R.I., Astron. Lett. 14, 445 (1988).
-
7.
Bailer-Jones C.A.L., Rybizki J., Fouesneau M., Mantelet G., and Andrae R., Astron. J., 156:58 (2018).
-
8.
Brown, A. G. A., Vallenari, A., Prusti, T. et al. (Gaia Collab.), Astron. Astrophys., 616, 10 (2018).
-
9.
Charbonnel C., Meynet G., Maeder A., and Schaerer D., Astron. Astrophys. Suppl. Ser. 115, 339 (1996).
-
10.
Henize K.G., Astrophys. J., Suppl. Ser. 14, 125 (1967).
-
11.
Ikonnikova N.P., Burlak M.A., Arkhipova V.P., and Esipov V.F., Astron. Lett. 45, 217 (2019).
-
12.
Kaler J.B. and Lutz J.H., PASP 92, 81 (1980).
-
13.
Lyutyi V.M., Soobshch. GAISh 172, 30 (1971).
-
14.
Miller Bertolami M.M., Astron. Astrophys. 588, A25 (2016).
-
15.
Munari U. and Buson L.M., Astron. Astrophys. 255, 158 (1992).
-
16.
Munari U., Ochner P., Dallaporta S., and Belligoli R., Astronomer’s Telegram, 10361 (2017).
-
17.
Passuello R. et al., IAUC 6065 (1994).
-
18.
Pereira C.B., Smith V.V., and Cunha K., Astron. J. 116, 1997, (1998).
-
19.
Samus’ N.N., Kazarovets E.V., Durlevich O.V., Kireeva N.N., and Pastukhova E.N., Astron. Rep. 61, 80 (2017).
-
20.
Schmidt-Kaler Th. 1982, in: K. Schaifers and H.H. Voigt (eds.), Landolt-Bornstein, Numerical Data and Functional Relationships in Science and Technology (New Series, Group VI, Vol. 2b), Springer Verlag, Berlin.
-
21.
Skopal A., Astron. and Astrophys. 366, 157 (2001).
-
22.
Skopal A., Astron. and Astrophys. 440, 995 (2005).
-
23.
Straižys V.L., Stars with Metal Deficite (Mokslas, Vil’nyus, 1982) [in Russian].
-
24.
W.D. Vacca, C.D. Garmany, and J.M. Shull, Astrophys. J. 460, 914 (1996).