The Dependence of AGN Activity on Environment in SDSS
Abstract
Environment is one of the key external drivers of the galaxies, while active galactic nucleus (AGN) is one of the key internal drivers. Both of them play fundamental roles in regulating the formation and evolution of galaxies. We explore the interrelationship between environment and AGN in SDSS. At a given stellar mass, the specific star formation rate distribution of the AGN host galaxies remains unchanged with over-density, with the peak of the distribution around the Green Valley. We show that, at a given stellar mass, the AGN fraction that has been commonly used in previous studies (defined as the number of AGNs relative to all galaxies including passive and star forming ones) does decrease with increasing over-density for satellites. This is largely due to the fact that the fraction of passive galaxies strongly depends on environment. In order to investigate the intrinsic correlation between AGN and environment, especially under the assumption that AGN feedback is responsible for star formation quenching, the AGN fraction should be defined as the number of AGNs relative to the star-forming galaxies only. With the new definition, we find little dependence of AGN fraction on over-density, central/satellite, and group halo mass. There is only marginal evidence that AGN may prefer denser regions, which is possibly due to more frequent interaction of galaxies or higher merger rate in groups. Our results support the scenario that internal secular evolution is the predominant mechanism of triggering AGN activity, while external environment related processes only play a minor role.
keywords:
galaxies: active — galaxies: evolution — galaxies: nuclei — galaxies: general1 Introduction
It is well established that observationally many galaxy properties, including star formation rate (SFR) and morphology, are strongly correlated with stellar mass and environment of the galaxies in both local Universe (e.g. Kauffmann et al. 2003a, 2004; Baldry et al. 2006; Peng et al. 2010, 2012; Woo et al. 2013; Schawinski et al. 2014), and to higher redshifts (Darvish et al. 2016; Kawinwanichakij et al. 2017). In the past decade, mass and environment have been considered as the most powerful drivers in quenching galaxies, namely, transforming star-forming galaxies into passive state (e.g. Kauffmann et al. 2003b, 2004; Baldry et al. 2006; Peng et al. 2010).
AGN, powered by the growth of the supermassive black holes at the center of massive galaxies, is widely believed to play a fundamental role in regulating the star formation of its host galaxy and co-evolve with it (e.g. Somerville et al. 2008; Kormendy & Ho 2013; Heckman & Best 2014; Choi et al. 2015; Harrison 2017). In fact, most galaxy formation and evolution models, including Semi-Analytic Models (SAMs) and hydro-dynamical simulations, usually require the feedback from AGN to produce many key observed features of the galaxy population, such as the stellar mass function (e.g. Harrison 2017 for a review). Although essentially all massive galaxies host a central supermassive black hole, not all galaxies become visible as AGN at a given epoch. Therefore, understanding the triggering mechanism of the AGN is one of the key issues in galaxy formation and evolution.
AGN could be triggered by internal and/or external processes. It is well known that more massive galaxies are more likely to host AGN than low mass ones (Dunlop et al. 2003; Floyd et al. 2004; Brusa et al. 2009; Pimbblet et al. 2013). Whether there is any dependence of AGN on the environment of its host galaxy is still under debate. A lot of literature suggests significant dependence of AGN on environment (e.g. Kauffmann et al. 2004; Gilmour et al. 2007; Best et al. 2007; Silverman et al. 2009; von der Linden et al. 2010; Bradshaw et al. 2011; Hwang et al. 2012; Sabater et al. 2013; Martini et al. 2013; Khabiboulline et al. 2014; Ehlert et al. 2014; Silverman et al. 2015; Coldwell et al. 2017; Lopes et al. 2017; Gordon et al. 2018; Powell et al. 2018; Magliocchetti et al. 2018; Koulouridis et al. 2018; Argudo-Fernández et al. 2018; Li et al. 2019; Kolwa et al. 2019). For instance, Kauffmann et al. (2004) find that AGN host galaxies with strong [O III] emission are twice as frequent in low density regions than in high density regions. Gilmour et al. (2007) showed that X-ray selected AGNs at z 0 lie predominantly in areas of moderate dense regions. Silverman et al. (2009) investigate X-ray selected AGN fraction as a function of galaxy overdensity using zCOSMOS spectroscopic survey data up to z 1. They find that massive galaxies harboring AGNs preferentially reside in lower-density regions, as is the case with studies of narrow-line AGN in SDSS. This is interpreted as that AGN activity requires a sufficient gas supply, which is likely to be adequate in underdense regions. Bradshaw et al. (2011) investigate both X-ray and radio-loud AGNs within the UKIDSS Ultra-deep Survey in the redshift range from z 1.0 to 1.5 and find that both AGN types live in overdense environments. Ehlert et al. (2014) found the fraction of X-ray bright AGNs increases with clustercentric distance. Lopes et al. (2017) found that AGN favors in environments typical of the field, low mass groups or cluster outskirts, as the result of galaxy interactions. In SDSS DR7, low S/N LINERs are also found more likely to populate low density environments (Coldwell et al., 2017). More recently, Koulouridis et al. (2018) found X-ray selected AGNs in high mass clusters show opposite dependence on environment than in low mass clusters.
Despite that many evidence support the significant environmental dependence of AGN, some studies claim the opposite. Miller et al. (2003) found that, in 4921 SDSS local galaxies, fraction of optical-selected AGN remains unchanged from the cores of galaxy clusters to the rarefied field population. Similarly, no significant difference in AGN fraction was observed between cluster and field galaxies (X-ray selected, Martini et al. 2007), or at different positions within the galaxy clusters (optical-selected, Pimbblet et al. 2013). Natàlia et al. (2018) found the clustering of AGN is equivalent to that of galaxy, implying AGN has no preference for environment. Wang & Li (2018) found the clustering of narrow-line AGN with blue color or massive red galaxies is almost identical with controlled galaxies. In a most recent work, Amiri & Tavasoli (2019) concluded that nuclear activity is weakly affected by local galaxy density using a sample including AGN and star-forming galaxies.
Above apparently contradictory results on the environmental dependence of AGN could be attributed to different AGN selection criterion, the use of different environment tracers (see Muldrew et al. 2012 for a detailed comparison), or even any potential observational bias. We argue a more important factor in exploring the interrelationship between environment and AGN is that the passive dead galaxies should not be included in the analysis, for two reasons. First, many passive dead galaxies were quenched at high redshift (e.g. ), especially massive ones. These galaxies could be quenched by AGN and/or stellar feedback (or by any other physical mechanisms) at high redshift. They are not helpful for us to understand the interrelationship between AGN and environment at current epoch (i.e. at ). Second, many passive galaxies were quenched due to environmental effect such as strangulation (e.g. Larson et al. 1980; Feldmann et al. 2010; Peng et al. 2015). These galaxies were not quenched by AGN feedback and hence are not useful to explore the environmental dependence of AGN. Therefore, AGN fraction should be defined only with AGNs and star-forming galaxies to better reveal the intrinsic correlation between AGN and environment. Through this, we can eliminate the known strong correlation between passive fraction and environment (e.g. Dressler 1980; Kauffmann et al. 2004; Baldry et al. 2006; Peng et al. 2010, 2012).
In this paper, we mainly focus on a local galaxy sample () in SDSS Data Release 7 (DR7, Abazajian et al. 2009) to study the environment-dependence of AGN activity. Details of our sample selection is given in section 2. The main results are in section 3, where we investigate the interrelationship between environment and AGN activity by introducing a modified definition of AGN fraction. We further discuss our results in section 4 and summary the main conclusions in section 5. We use a concordance CDM cosmology model with = 70 km s-1 Mpc-1 , = 0.75, and = 0.25 in this work. All magnitudes are quoted in the AB normalization.
2 Data Set
2.1 The SDSS sample
Our sample for analysis is based on the parent sample of Peng et al. (2010) drawn from SDSS DR7 (Abazajian et al., 2009) catalog. The sample includes 238,474 objects with reliable spectroscopic redshift measurements in (see Peng et al. 2010 for details). Further, we retained galaxies only with well defined and reliable measurements of physical properties (e.g. stellar mass, SFR, metallicity), resulting in a sample containing 214,091 objects. These finally comprise the SDSS sample in this paper.
Due to the SDSS spectroscopic selection , the sample is incomplete below a stellar mass limit (e.g. 10 at ). We therefore weight each galaxy below this limit by a factor of to correct the volume incompleteness within a given redshift bin ( for galaxies above this limit). The values are derived from the k-correction program v4 1 1 (Blanton & Roweis, 2007). The use of weighting allows us to include representatives of the galaxy population down to a stellar mass of about . Besides, on average about 10% of all SDSS targets are missed from the spectroscopy sample due to the minimum fiber spacing of 55 arcsec. To correct this, for each object, a spatial target sampling rate (TSR) is determined by using the fraction of objects that have spectra in the parent photometric sample within the minimum SDSS fiber spacing of 55 arcsec. In constructing the final population of SDSS galaxies used in our analysis, each galaxy is weighted by 1/TSR to correct both the volume incompleteness and local sampling rate.
Rest-frame absolute magnitudes are derived from the five SDSS bands using the k-correction program (Blanton & Roweis, 2007) and further corrected onto the AB magnitude system. The stellar masses are determined from the same k-correction code with Bruzual & Charlot (2003) population synthesis models and a Chabrier IMF, which is consistent with that of Kauffmann et al. (2003a) and Gallazzi et al. (2005) within 0.1 dex.
2.2 Overdensity
We take overdensity , the dimensionless density contrast, as an estimator of environment of individual SDSS galaxy: . is the number density of galaxies within the projected radius to the 5th nearest neighbor (hereafter 5NN); is the (volume) mean density at a given redshift. Local density field of 5NN is calculated over a cylindrical volume with length of 1000 km s-1 to exclude the galaxy proper motion effect. We use a volume-limited population of density tracers. In practice, the spectroscopic sample with are selected as density tracers. To avoid edge effects in local density measurement, we consider objects with , where is the fraction of the aperture adopted within the SDSS region (Kovač et al., 2010).
| Subsample | Number | Percentage |
|---|---|---|
| Star-forming | 85528 | 39.95% |
| Low S/N Star-forming | 39853 | 18.61% |
| Composite | 16428 | 7.67% |
| AGN | 8005 | 3.74% |
| Low S/N LINER | 19277 | 9.00% |
| Unclassifiable | 44701 | 20.88 % |
2.3 Group Catalog and Halo Mass
Our galaxy group catalog is an updated version of Yang et al. (2007) catalog. It contains galaxies in the Main Galaxy Sample of NYU Value-Added Galaxy Catalog (NYU-VAGC, Blanton et al. 2005; Adelman-McCarthy et al. 2008; Padmanabhan et al. 2008) within . By implementing their group finder, Yang et al. (2007) divide galaxies into groups in which each galaxy is marked as central or satellite. The dark matter halo mass of each group is estimated based on the intergrated stellar mass or luminosity of all group members above a certain luminosity limit. In principle, the group with highest total stellar mass (or luminosity) is assigned the highest halo mass following a given halo mass function (HMF). In this work, we will use the halo mass derived from total stellar mass because it is less affected by ongoing star formation.
2.4 SFR Estimates and Classifications
The SFR and types of galaxies are directly retrieved from the MPA-JHU DR7 release 111https://wwwmpa.mpa-garching.mpg.de/SDSS/DR7/, where galaxies are further classified into star-forming, composites and AGNs (Brinchman et al., 2004) based on the BPT diagram (Baldwin, Phillips & Terlevich, 1981). The star-forming population here refer to those with S/N in all four BPT lines, excluding the low S/N star-forming galaxies with only S/N 2 in Hα. Composites are defined as galaxies somewhat in between AGN and star-forming on the BPT diagram. Low signal-to-noise ratio (S/N) LINERs refer to galaxies with [N II]/H and S/N ¿0.3 in both lines, but too low S/N for [O III] and Hβ. Unclassifiable galaxies have no or very weak emission lines hence unable to be classified by BPT. The number and percentage of each category is listed in Table 1.
The SFR of star-forming galaxies are derived based on their H emission line luminosities, corrected for extinction using the H/H ratio; the SFR of composites, low S/N LINERs and AGN host galaxies are estimated based on a likelihood distribution for specific star formation rate () as a function of D4000 constructed using the star-forming sample (Brinchman et al., 2004). Aperture effects are further corrected for all galaxies. The SFR is converted from Kroupa to Chabrier IMF using log SFR (Chabrier) = log SFR (Kroupa) 0.04.
3 Results
3.1 Environment
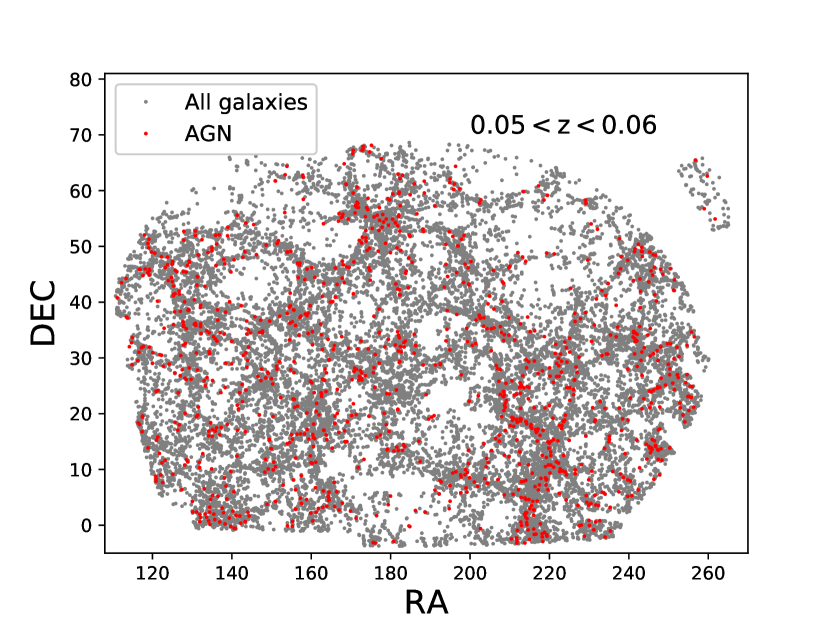
The most direct way to study the local environment of galaxies is to see how they are distributed in space. Here, we simply cut a redshift slice at (for no particular reason) to provide a 2D view of the spatial distribution of AGNs and galaxies. In Figure 1, all galaxies are plotted in grey dots, while AGN host galaxies are plotted in red dots. One can see the prominent features of large-scale structures: filaments, nodes, voids and several large clusters. AGNs seem to distribute following all galaxies. Although a large number of AGNs are relatively concentrated in galaxy clusters, there are still some AGNs in filaments or even in field. AGN distribution basically follows the large-scale structure of all galaxies and it is hard to find significant environmental dependence of AGN by a rough visual inspection. This motivates us to investigate the interrelationship between AGN and environment in more details.
There are various approaches to define local environment e.g. by distance to cluster center, group identity (central or satellite), location (cluster/filament/field), overdensity, dark matter halo mass and so forth. Overdensity , for example, has been used as an efficient indicator of local environment which can be easily defined in observation (e.g. Bolzonella et al. 2010; Moresco et al. 2010; Peng et al. 2012; Jian et al. 2012; Kovač et al. 2014; Darvish et al. 2016). As argued in Muldrew et al. (2012), the local environment which corresponds to scales internal to a halo is best probed using the nearest-neighbour methods. We hence use the overdensity defined by the 5NN as discussed in section 2.2.
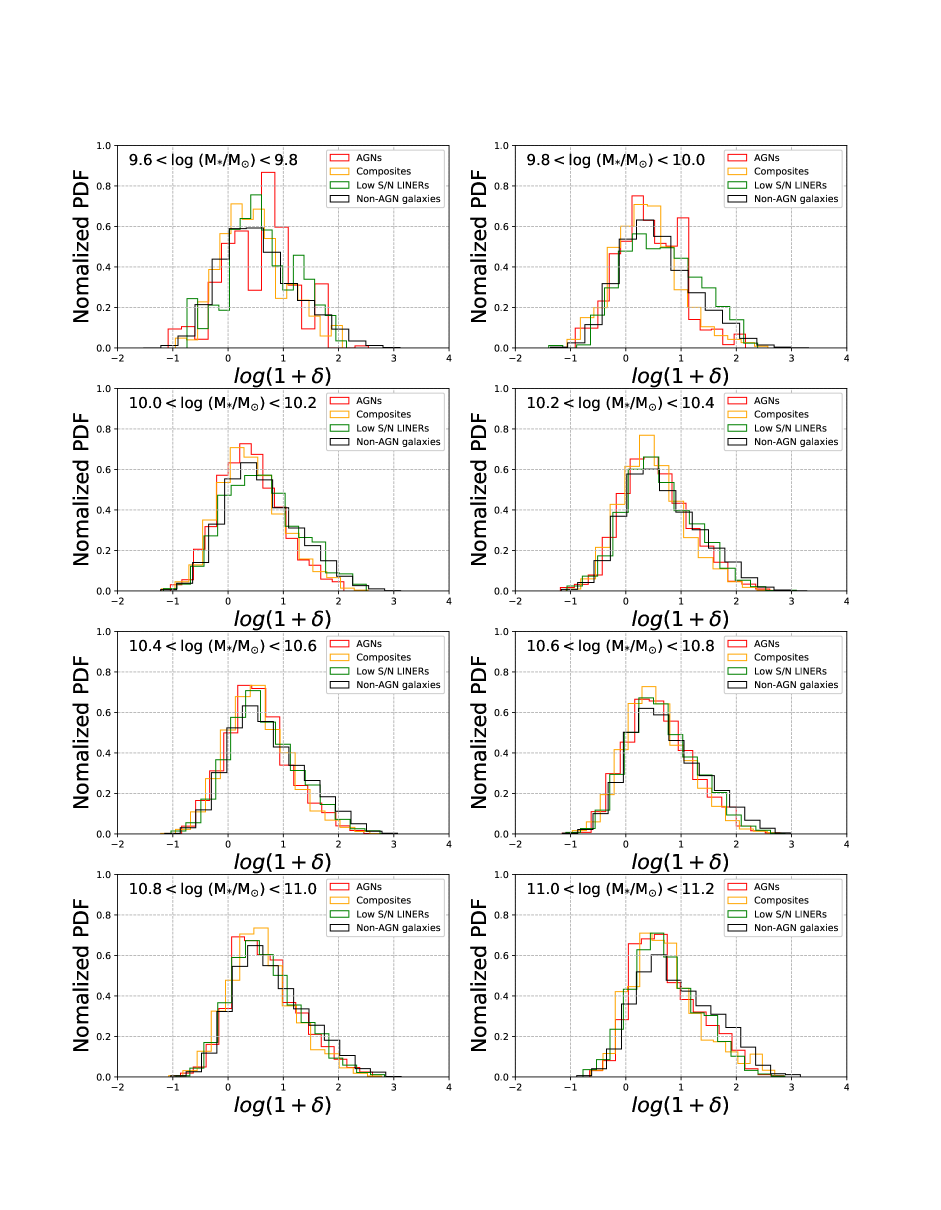
In Figure 2, we present the normalized probability distribution function (PDF) of overdensity for different types of galaxies. As we know, AGNs are tightly related to the stellar mass of their host galaxies: more massive galaxies are more likely to host AGNs (Dunlop et al. 2003; Floyd et al. 2004). We therefore bin galaxies in stellar mass to exclude the mass-related effect. In general, AGNs, composites, low S/N LINERs and non-AGN galaxies basically share the same overdensity distribution. The only difference may be that in , AGNs and composites tend to have smaller high-density tails than low S/N LINERs and non-AGN galaxies. This could be due to an excess of passive galaxies in low S/N LINERs and non-AGN host galaxies as a result of environmental quenching.
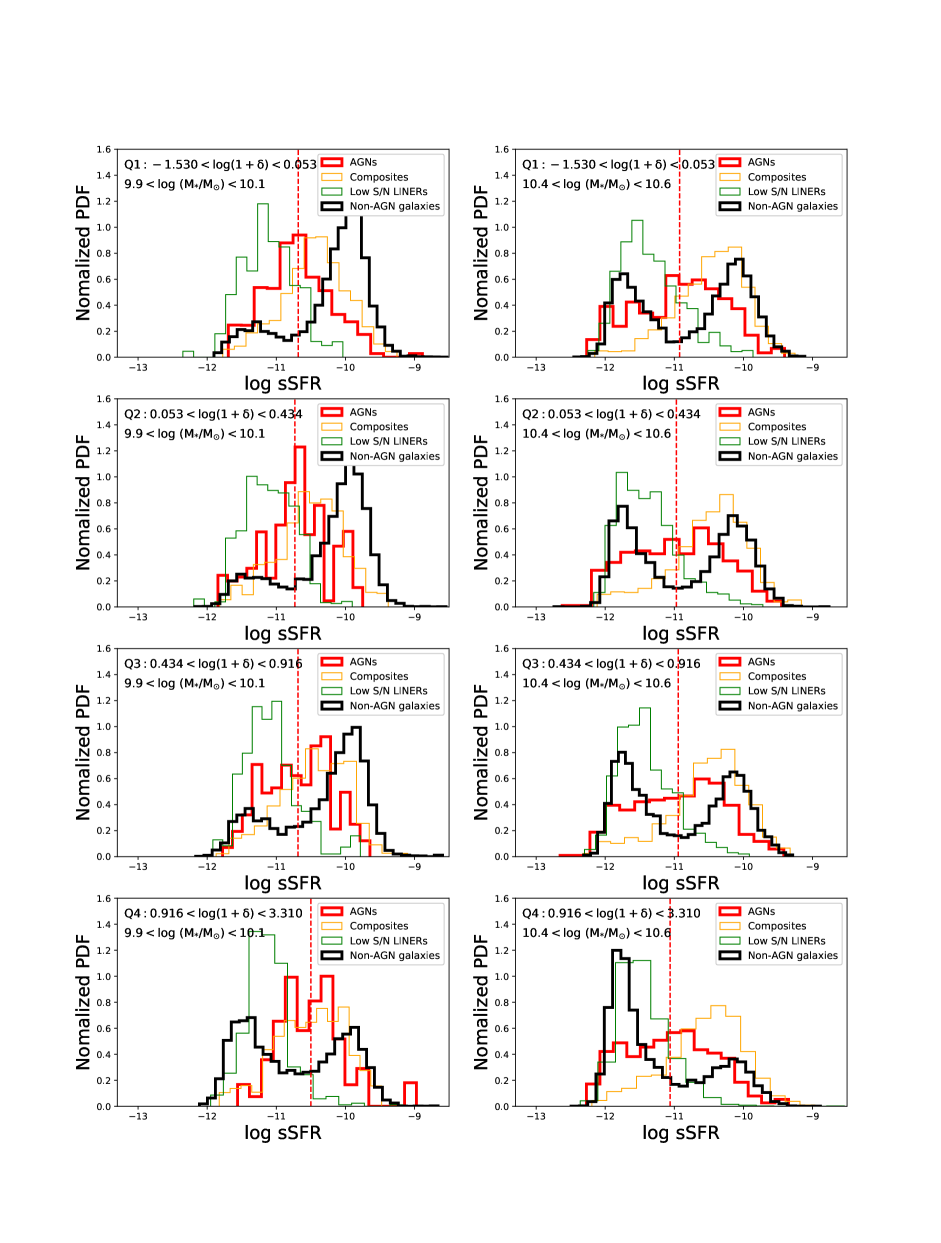
AGN is believed to play an important role in regulating the star formation of its host galaxy, it would be hence helpful to examine the sSFR distribution of AGN hosts at different environments. In Figure 3, we compare the normalized PDF of sSFR among AGN hosts, composites and non-AGN galaxies by quartering them in terms of overdensity at two fixed stellar mass and , respectively. The distributions of AGNs and non-AGN galaxies are highlighted in bold. It is clear that the distribution of non-AGN host galaxies varies with overdensity: as overdensity increases, the star-forming peak drops while the passive peak rises, which is a result of the more violent environmental quenching in higher density regions. AGN hosts and composites are found mostly located in the “green valley”, the transition area between the star-forming and passive populations. This indicates AGN activities may be associated with the quenching process of their host galaxies, which has been demonstrated in a number of studies (e.g. Salim et al. 2007; Mullaney et al. 2012; Hardcastle et al. 2013; Gürkan et al. 2015; Leslie et al. 2016). Moreover, one would expect the sSFR distribution of AGN hosts changes with density, if a strong environment dependence of AGN activity is assumed. However, it is shown that the distribution of AGN hosts and composites change little with environment, providing no evidence for a tight correlation between AGN and environment. Yet there is a caveat here that the SFR of AGN hosts and non-AGN host galaxies are derived in different ways, which might lead to some systematic difference.
3.2 AGN Fraction
A practical way to investigate the environmental dependence of AGN activity is to directly measure how frequently AGN activity is triggered in galaxies with different environments. Usually, the occurrence of AGN is quantified by AGN fraction defined as the number of AGNs relative to all galaxies including passive and star forming ones (e.g. Silverman et al. 2009; Hwang et al. 2012; Martini et al. 2013):
| (1) |
where is the number of AGN host galaxies, is the number of all galaxies
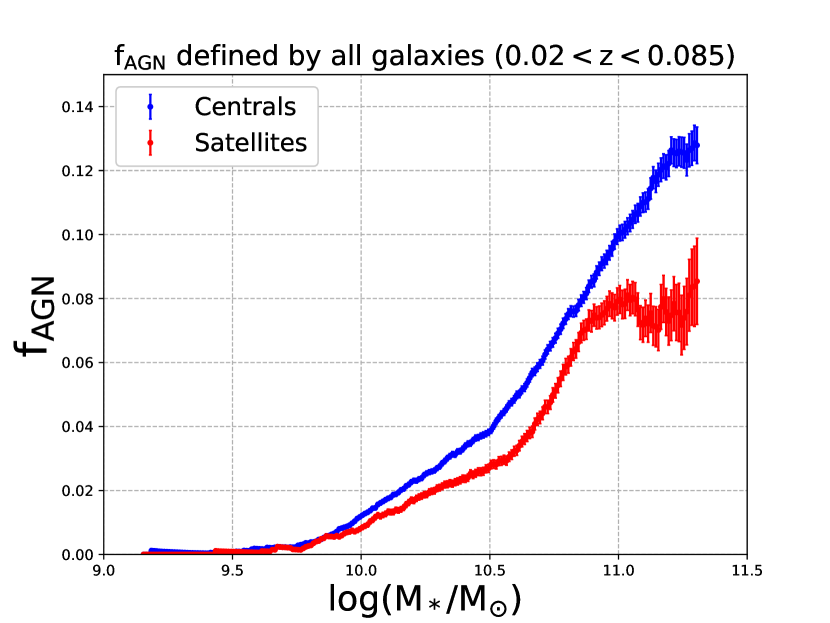
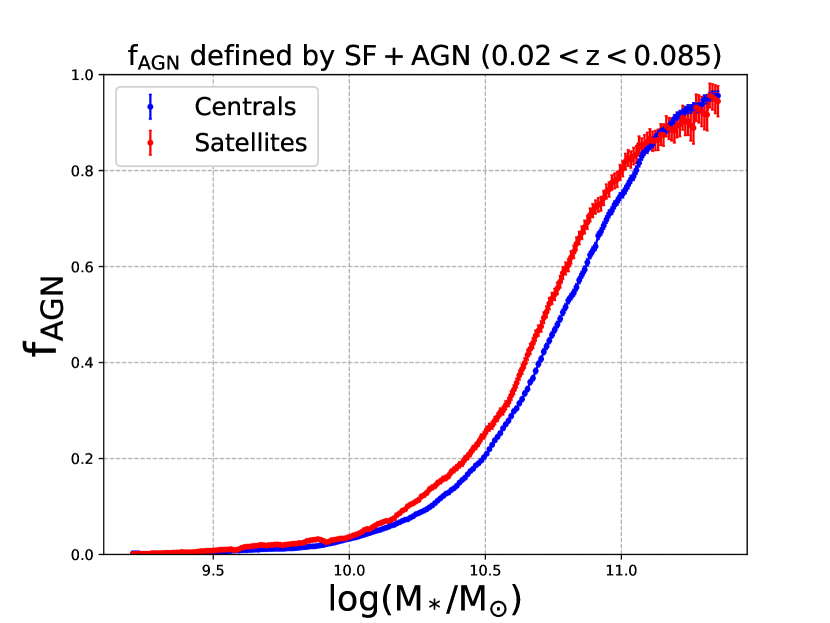
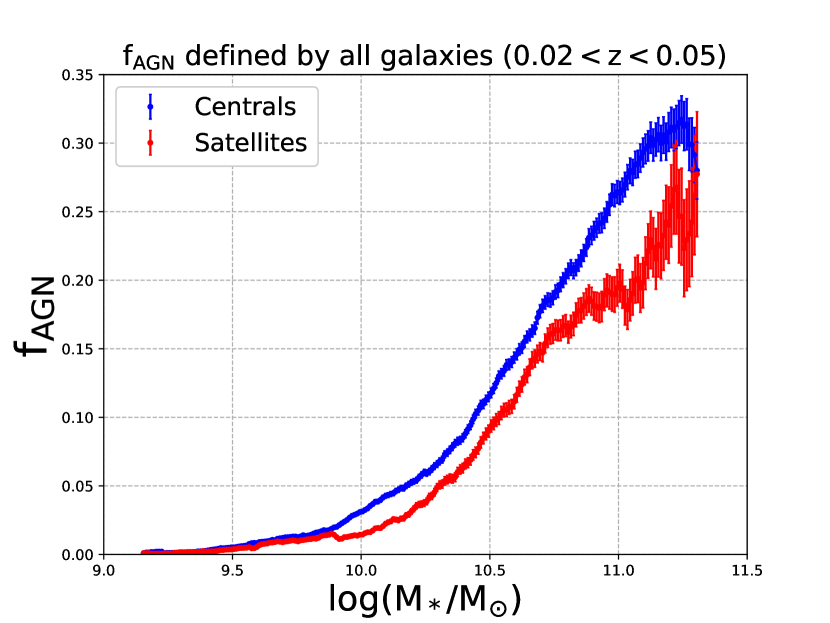
By using this definition, we examined the AGN fraction as a function of stellar mass for central and satellite galaxies, respectively. As shown in the top-left panel of Figure 4, AGN fraction increases with stellar mass with a significant dichotomy between central and satellite: central galaxies are more likely to host AGN than satellite galaxies at a fixed stellar mass, especially for massive galaxies with .
To better investigate the intrinsic correlation between AGN and environment, we propose a modified version of AGN fraction defined as the number of AGNs relatively to the star-forming galaxies only (which we will discuss in detail in section 4):
| (2) |
where is the number of AGN host galaxies, is the number of star-forming galaxies
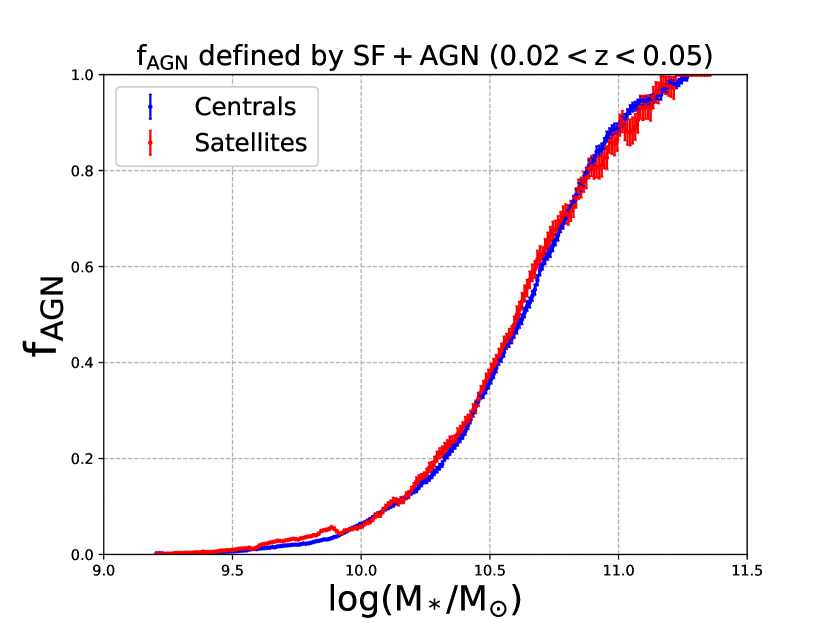
The top-right panel of Figure 4 shows the AGN fraction as a function of stellar mass by using our new definition. The difference between centrals and satellites is largely reduced, and even disappears at low mass () and high mass () ends. In particular, if we narrow the redshift range down to where the stellar mass are more complete, we will find basically little difference between centrals and satellites (see the bottom panels of Figure 4), while the dichotomy remains still distinct by using the previous AGN fraction defined by all galaxies. We can hence say that by using the new AGN fraction, AGN activity manifests no significant dependence on the local environment of its host galaxy in terms of central/satellite dichotomy.
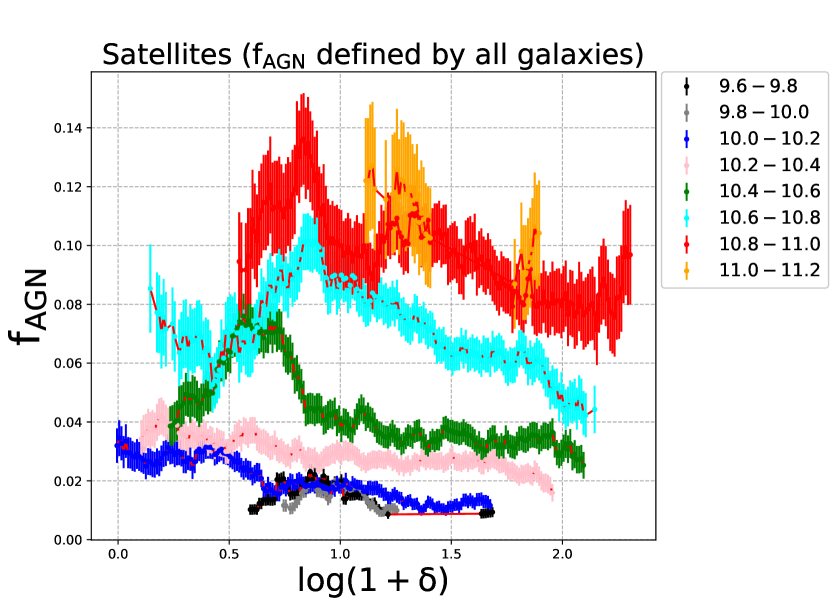
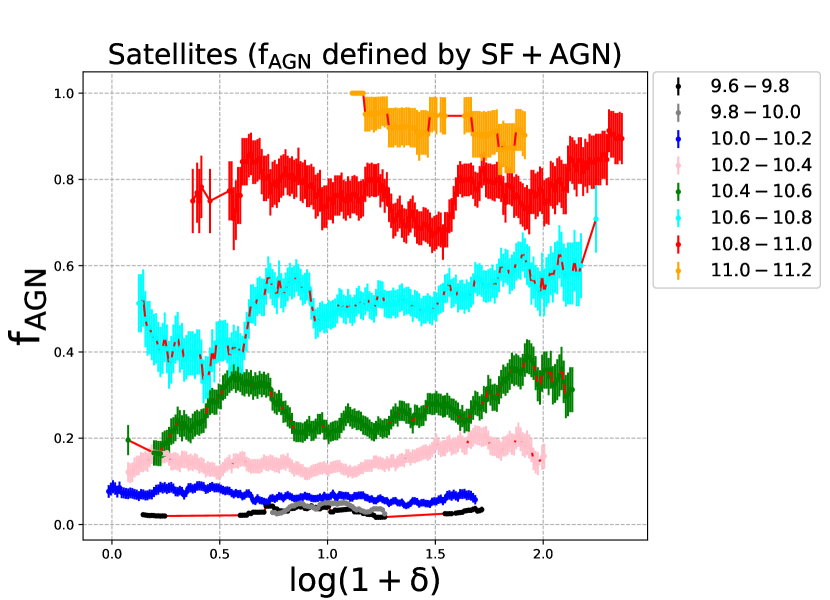
The group identity alone could only provide limited evidence for our scenario, it is necessary to examine the environmental dependence by using more indicators such as overdensity. To do this, we first start from satellite galaxies which are known to be susceptible to local environment. In the top-left panel of Figure 6, we could see clearly that the AGN fraction defined by all galaxies decreases with increasing overdensity at , which even goes down to a half in satellites above . This result, together with the dichotomy in Figure 4, may suggest that AGNs prefer underdense regions, especially for those with massive host galaxies. In fact, similar argument has been addressed by many work (e.g. Kauffmann et al. 2004; Silverman et al. 2009; Sabater et al. 2013; Coldwell et al. 2017). However, by using our new AGN fraction defined as the number of AGNs relative to the star-forming galaxies only, we find there is no significant dependence of AGN fraction on overdensity. There might only be a hint that AGN fraction slightly increases with overdensity at some given stellar mass (the top-right panel of Figure 6). This demonstrates that AGN activity does not strongly depend on the environment of its host galaxy, which is apparently at odds with most of the results in literature.
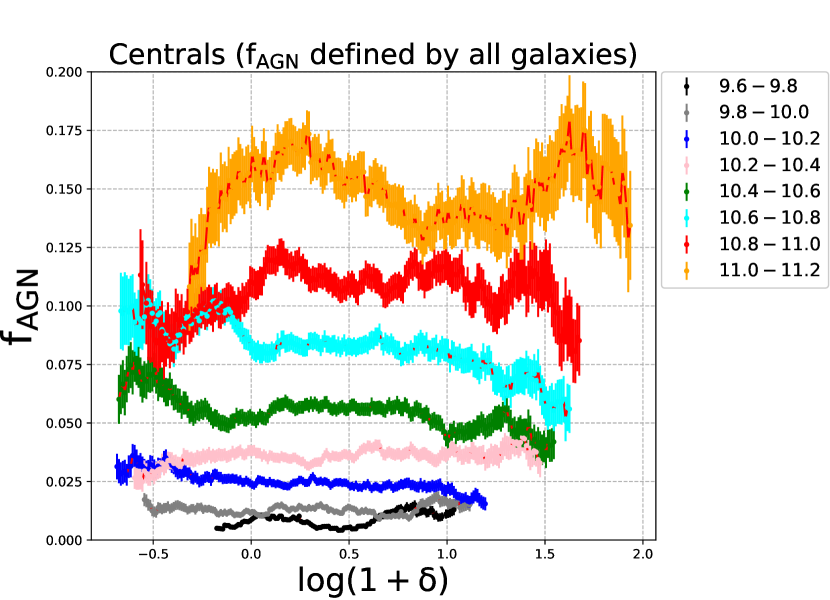
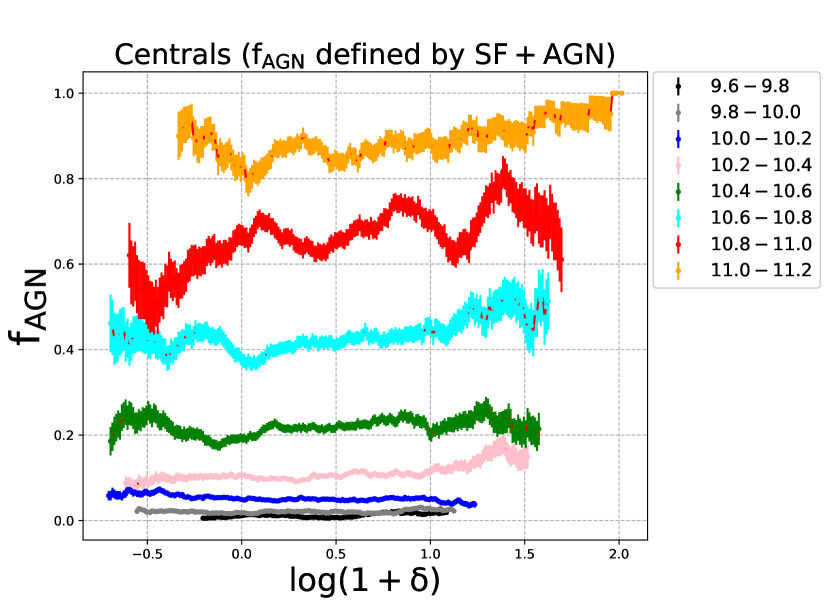
Bottom panels of Figure 6 show the AGN fraction of central galaxies as a function of overdensity. Unlike satellites, the AGN fraction of centrals show little dependence on environment by using either definition. We will interpret the discrepancy between centrals and satellites in section 4. Therefore, the basic conclusion is that AGNs in general (no matter in central or satellite galaxies) have no significant preference on environment.
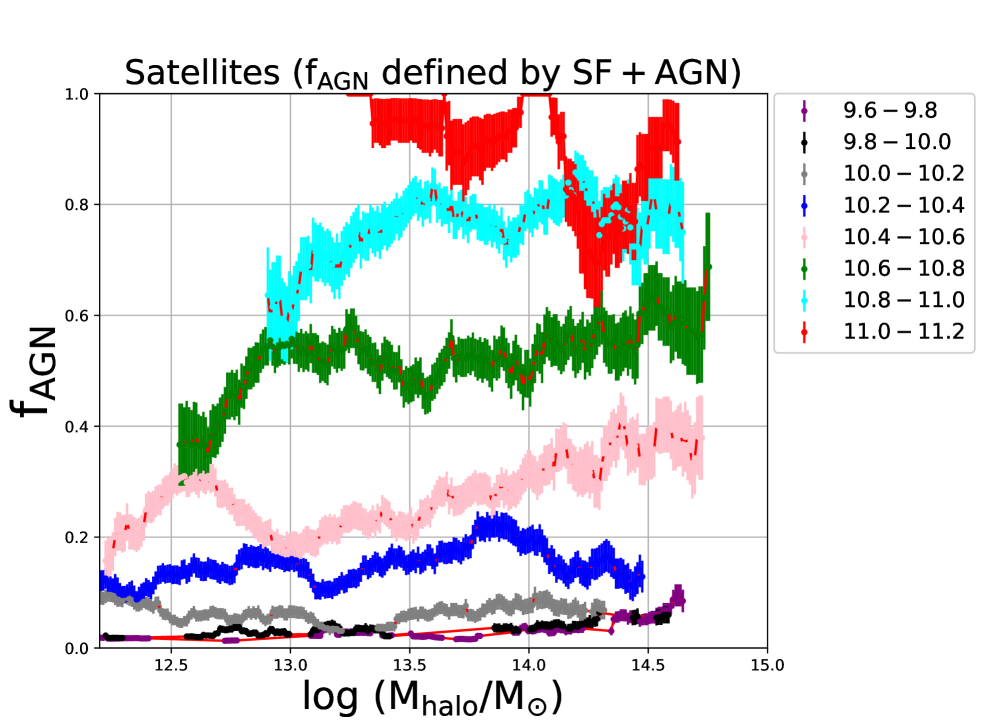
Furthermore, we investigate the dependence of AGN fraction on group halo mass. In Figure 6, there is no significant dependence of AGN fraction on halo mass with only a slight preference in more massive halos. This again supports our scenario that AGN activity does not strongly depend on environment. Here we only consider satellites rather than centrals mainly for two particular reasons. First, satellites are presumably more susceptible to environmental effects (e.g. van den Bosch et al. 2008; Peng et al. 2012; Wetzel et al. 2012; Kovač et al. 2014; Lin et al. 2014a; Knobel et al. 2015; Darvish et al. 2016; Henriques et al. 2017; Strazzullo et al. 2019). Second, the stellar mass of centrals are tightly correlated with its parent halo mass (Peng et al., 2012), which may lead to some entanglement between mass and environment.
4 Discussions
In the investigation of environmental dependence of AGN activity, the different definitions of AGN fraction can lead to inconsistent conclusions. It is hence important to evaluate which definition can better represent the occurrence of AGN activities. The major difference between the two definitions (see equation 1 and 2) is whether the passive population is incorporated in the denominator: if we only use AGN and star-forming galaxies as the denominator instead of all galaxies, the significant dependence of AGN fraction on environment will disappear. We believe our new definition of AGN fraction defined as the number of AGNs relative to the number of star-forming galaxies can better reflect the intrinsic correlation between AGN and environment, which is supported by the following two reasons.
The first reason is that a vast number of passive galaxies were quenched at high redshift (e.g. ), especially massive galaxies. They could have been quenched by AGN and/or stellar feedback (or by any other physical mechanisms) in the high redshift Universe. For instance, some of the massive red galaxies are elliptical galaxies that have been already “red nuggets” before (Huang et al., 2013a, b). These galaxies cannot help us understand the interrelationship between AGN and environment at . We should hence exclude these fossil passive galaxies when describing the prevalence of AGNs in the local Universe.
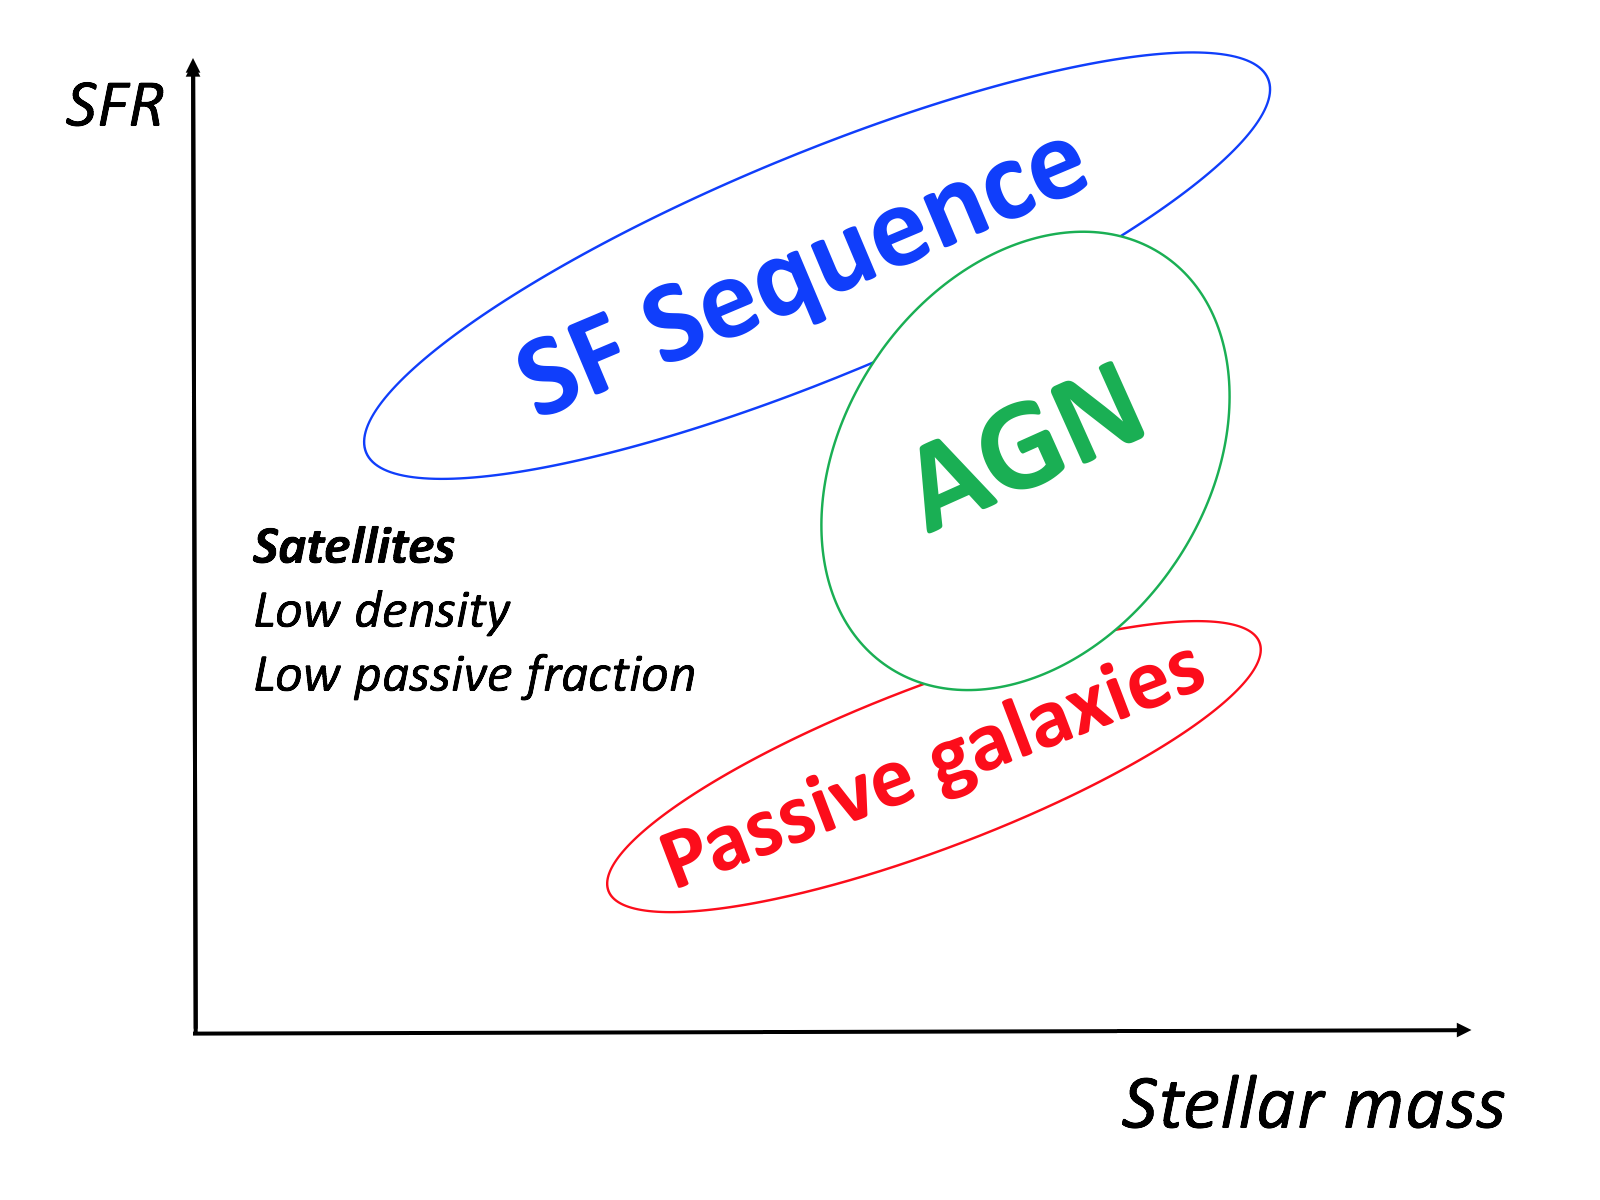
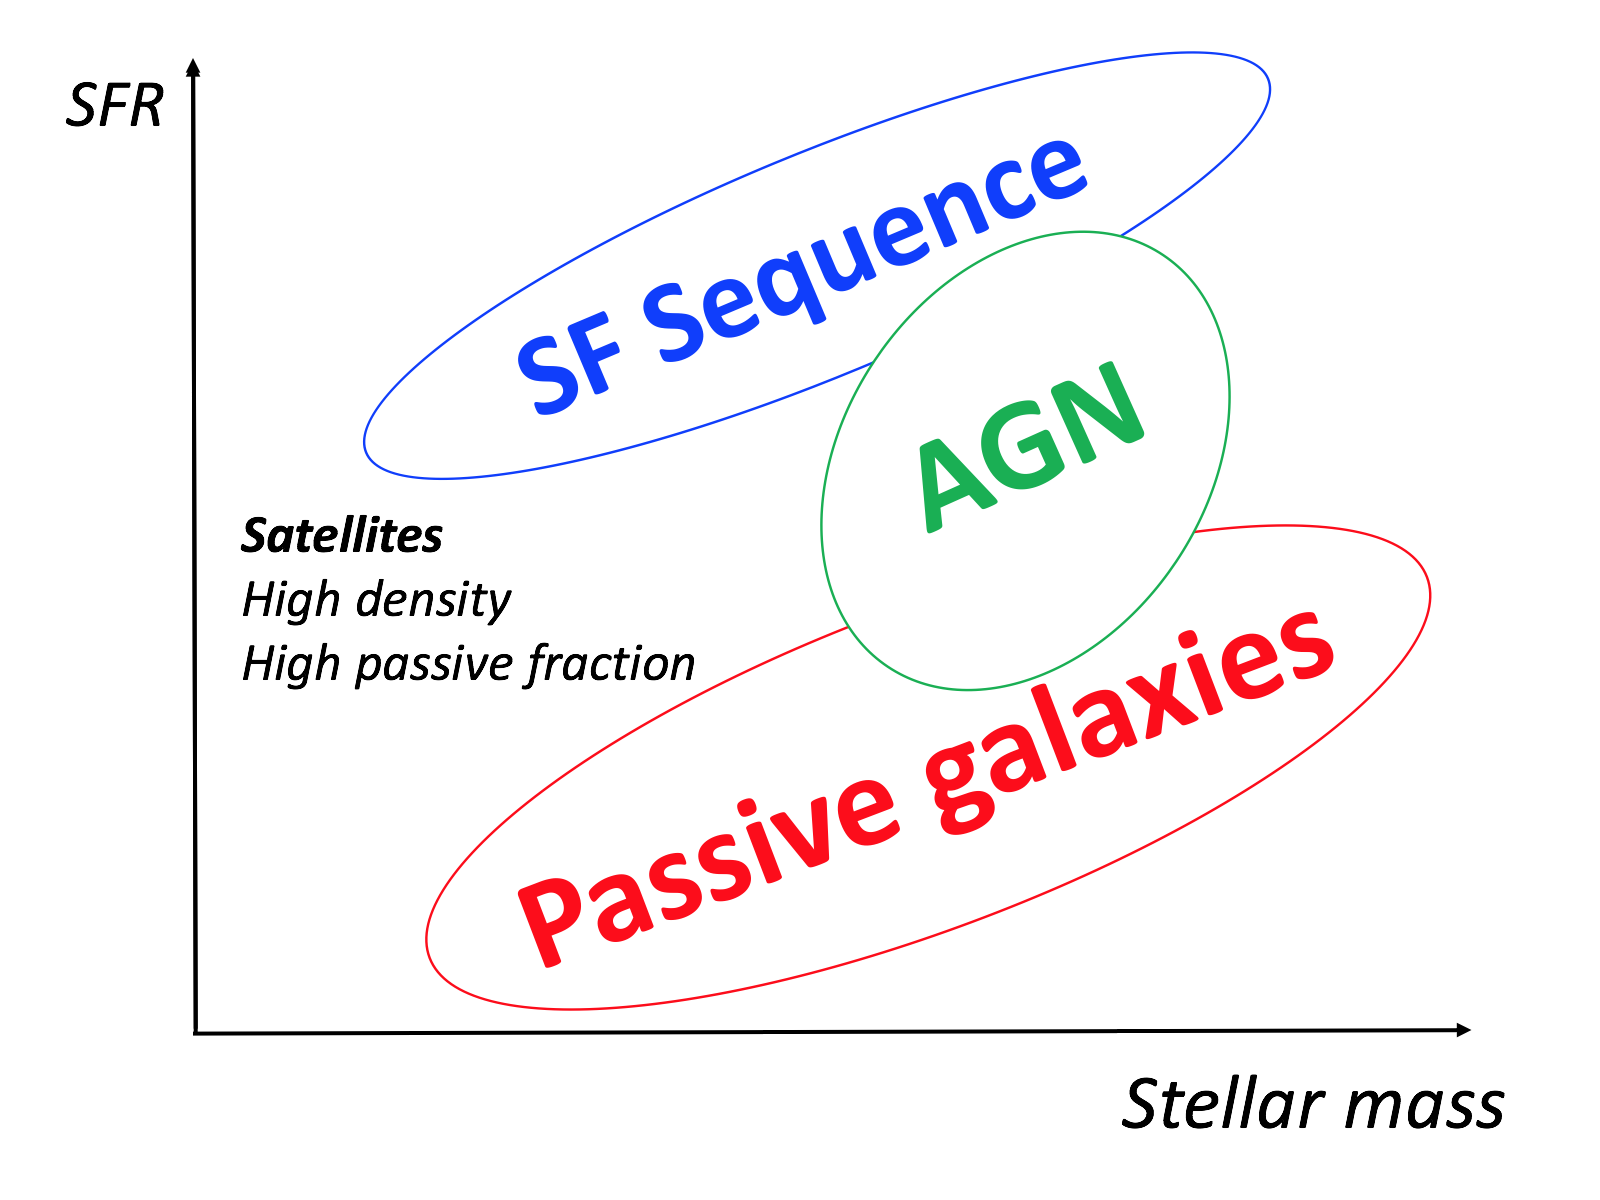
The second reason is the strong correlation between passive fraction and environment i.e. both the fraction of the passive galaxies and different morphological types of galaxies have been found strongly correlated with the local environment (e.g. Dressler 1980; Kauffmann et al. 2004; Baldry et al. 2006; Peng et al. 2010, 2012). The correlation can be illustrated by the cartoons in Figure 7: some fraction (depending on density) of passive satellite galaxies were quenched by external environmental effects including tidal stripping (e.g. Read et al. 2006), ram-pressure stripping (e.g. Gunn & Gott 1972; Abadi et al. 1999; Quilis et al. 2000), harassment (e.g. Farouki et al. 1981; Moore et al. 1998) and strangulation (e.g. Larson et al. 1980; Feldmann et al. 2010; Peng et al. 2015), instead of internal effects which AGN feedback is assumed to be responsible for. For satellite galaxies, there is a higher passive fraction in higher density regions than lower density regions. The strong correlation between passive fraction and environment could lead to significant bias in the AGN fraction defined relative to all galaxies i.e. more passive galaxies in dense environment will dilute the frequency of AGN activity.
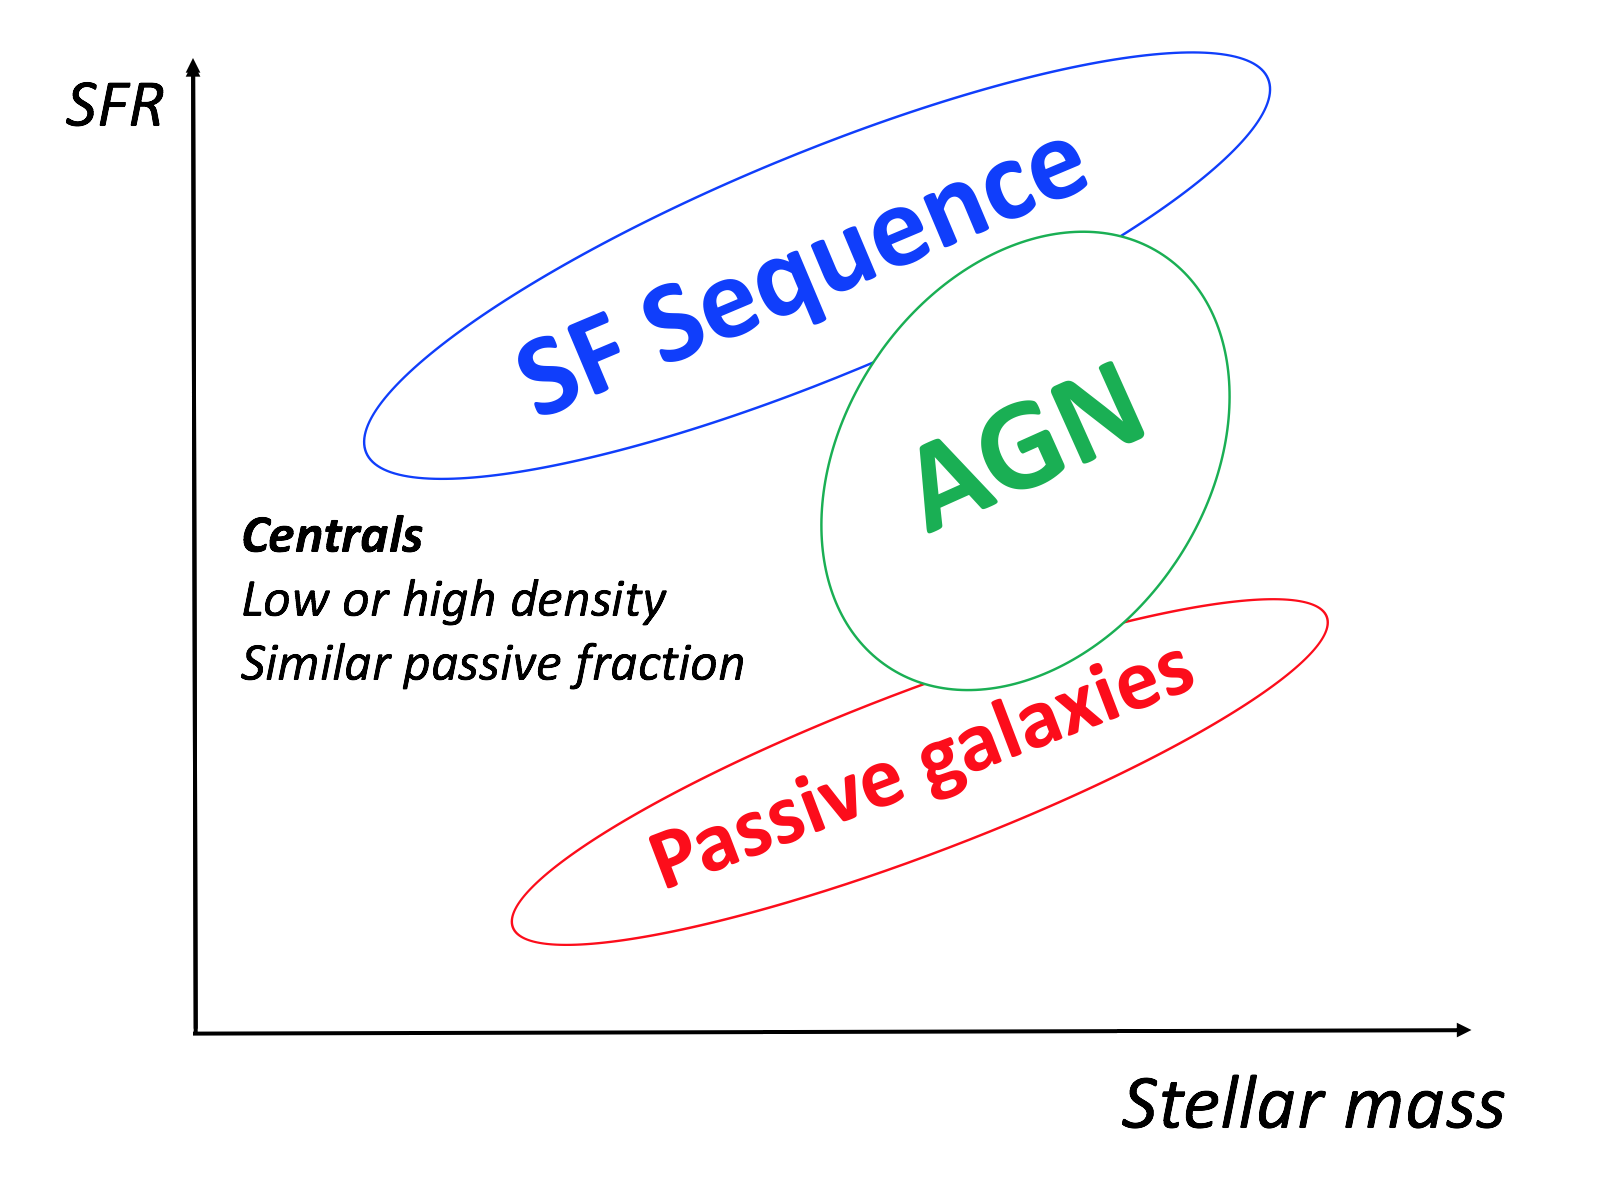
For central galaxies, however, the AGN fraction show little dependence on environment at fixed stellar mass by using both definitions (Figure 6). According to Peng et al. (2012), centrals cannot be environmentally quenched, in other words, centrals can only be quenched by internal mass-related processes. Therefore, it is reasonable to expect that the passive fraction of centrals does not change with overdensity, in which case the choice of definitions make no difference (see Figure 7 for an illustration).
Our AGN fraction defined as the number of AGNs relative to the star-forming galaxies can eliminate the strong correlation between passive fraction and environment, thus manifesting the intrinsic correlation between environment and the occurrence of AGN activity. This is a rather novel definition of AGN fraction compared with the previous AGN fraction defined as the number of AGNs relative to all galaxies including passive and star forming ones. Coincidentally, we notice that in a most recent work, Amiri & Tavasoli (2019) constructed two separate samples, AGN and star-forming galaxies (SFG), and found the AGN fraction (with respect to SFG) weakly depends on the distance from the brightest cluster member. This is consistent with our results and also supports our definition of AGN fraction.
5 Conclusions
In summary, we use the SDSS DR 7 sample from Peng et al. (2010), which contains 214,091 galaxies with reliable measurements of galaxy properties including stellar mass, SFR, over-density, in the redshift range of . Group properties including central satellite classification and halo masses are taken from Yang et al. (2007) group catalog. Through the emission-line selection on BPT diagram, galaxies are classified as star-forming, AGN, composite, low S/N LINER, etc. (Brinchman et al., 2004). Our goal is to investigate the environmental dependence of AGN activity in local Universe, and the results are as follows:
(1) AGNs, composites, low S/N LINERs and non-AGN galaxies that have a similar stellar mass all have similar spatial distributions.
(2) At a given stellar mass, the sSFR distribution of AGN hosts does not depend on environment, while that of the normal non-AGN galaxies strongly depends on environment. AGNs are predominantly located in the transition area (green valley) between passive and star-forming populations, indicating that AGN may be associated with galaxy quenching process, as in previous studies.
(3) In previous similar studies, the AGN fraction is commonly defined as the number of AGNs relative to all galaxies (including passive and star forming ones). With this definition, the AGN fraction does decrease with increasing over-density for satellite galaxies, and satellite galaxies have a lower AGN fraction than the centrals. As illustrated in Figure 7, this apparent dependence of AGN fraction on environment is largely due to the fact that the fraction of passive galaxies strongly depends on environment. Therefore, in order to investigate the intrinsic correlation between AGN and environment, especially under the assumption that AGN feedback is responsible for star formation quenching, the AGN fraction should be defined as the number of AGNs relatively to the star-forming galaxies only. With this new definition of AGN fraction, we find little dependence of AGN activity on environment in terms of overdensity, central/satellite dichotomy and group halo mass.
(4) There is only marginal evidence that the optical-selected AGNs might prefer denser regions (Figure 6 and 6), which may be due to more frequent interaction of galaxies or higher merger rate in groups. Many theoretical models believe that AGNs are largely triggered through the process of galaxy mergers or strong tidal interactions (e.g. Kauffmann & Haehnelt 2000; Hopkins et al. 2006, 2008). Mergers can drive gas inflows to the galaxy nucleus, fueling starbursts and may trigger AGN activity (e.g. Ramos Almeida et al. 2012; Jian et al. 2012; Kampczyk et al. 2013; Kaviraj et al. 2015; Chiaberge et al. 2015). However, the connection between nuclear activity and galaxy mergers and interactions is not yet clear (see Heckman & Best 2014 for a review).
Our new findings support the scenario that internal secular evolution is the predominant mechanism of triggering AGN activity. The weak positive correlation between AGN fraction and environment for both centrals and satellites suggests that external environment related processes only play a minor role. One possible mechanism being responsible for fueling AGNs whose host galaxies are not paired could be a slow inflow of gas driven by non-axisymmetric perturbations (Kawakatu et al., 2006; Ellison et al., 2011; Villforth et al., 2012; Hopkins et al., 2014; Koulouridis et al., 2014). Such perturbations in the underlying mass distribution of a disk can be caused by bars, oval distortions and even spiral arms (e.g., Kormendy & Kennicutt 2004; Athanassoula 2008). In particular, bars may fuel AGNs by driving radial gas inflows, and some previous studies have shown that the incidence of bar formation may not depend significantly on the local environment (van den Bergh, 2002; Li et al., 2009; Martinez et al., 2011; Lee et al., 2012; Lin et al., 2014b). Other studies found a higher bar fraction in dense environment like clusters (Barazza et al., 2009; Barway et al., 2011), which seems to reconcile with our conclusion (4). Nevertheless, the relationship between bars and environment has been controversial, and it is also unclear whether bars can trigger AGNs in the center of the host galaxies. We should be therefore cautious with the interpretations of the results.
In addition, the AGNs in our sample are optical-selected in the local Universe. It would be interesting to apply our approach to other AGN populations, such as the X-ray selected AGNs and radio selected AGNs, to test whether our conclusion still holds. With upcoming major facilities such as MOONS on VLT and PFS on Subaru, it will become possible to carry out SDSS-like surveys at higher redshifts. This will allow further investigation of the dependence of AGN activity on environment as a function of cosmic time, shedding light on the AGN triggering mechanism at different epochs.
6 Acknowledgement
We are grateful to Simon Lilly and Luis Ho for the productive discussions and useful comments. We thank the anonymous referee for useful comments. This work is supported by the NSFC Grant No. 11773001 and National Key R&D Program of China Grant 2016YFA0400702. K.G. acknowledges the support from the Beijing Natural Science Foundation (Youth program) under grant No.1184015. X.K. acknowledges the support by the National Key R&D Program of China Grant 2015CB857004 and 2017YFA0402600, and the National Natural Science Foundation of China Grant No. 11320101002, No. 11421303, and No. 11433005.
References
- Abadi et al. (1999) Abadi, M. G., Moore, B., & Bower, R. G. 1999, MNRAS, 308, 947
- Abazajian et al. (2009) Abazajian, K. N., Adelman-McCarthy, J. K., Agüeros, M. A., et al. 2009, ApJS, 182, 543
- Adelman-McCarthy et al. (2008) Adelman-McCarthy, J.K. et al. 2008, ApJS, 175, 297
- Amiri & Tavasoli (2019) Amiri A. & Tavasoli S. 2019, ApJ, 874, 140
- Argudo-Fernández et al. (2018) Argudo-Fernández, M. et al. 2018, A&A, 620, 113
- Athanassoula (2008) Athanassoula E., 2008, MNRAS, 390, L69
- Baldwin, Phillips & Terlevich (1981) Baldwin J. A., Phillips M. M.,& Terlevich R., 1981, PASP, 93, 5
- Baldry et al. (2006) Baldry, I. K., Balogh, M. L., Bower, R. G., et al. 2006, MNRAS, 373, 469
- Barazza et al. (2009) Barazza, F. D. et al. 2009, A&A, 497, 713B
- Barway et al. (2011) Barway, S. et al. 2011, MNRAS, 410L, 18B
- Best et al. (2007) Best, P. N., von der Linden, A., Kauffmann, G., et al. 2007, MNRAS, 379, 894
- Blanton et al. (2005) Blanton, M. R., Schlegel, D. J., Strauss, M. A., et al. 2005, AJ, 129, 2562
- Blanton & Roweis (2007) Blanton, M. R., & Roweis, S. 2007, AJ, 133, 734
- Bradshaw et al. (2011) Bradshaw, E. J., Almaini, O., Hartley, W. G., et al. 2011, MNRAS, 415, 2626
- Brinchman et al. (2004) Brinchmann, J., Charlot, S., White, S. D. M., et al. 2004, MNRAS, 351, 1151
- Brusa et al. (2009) Brusa, M., Fiore, F., Santini, P., et al. 2009, A&A, 507, 1277
- Bruzual & Charlot (2003) Bruzual, G., & Charlot, S. 2003, MNRAS, 344, 1000
- Bolzonella et al. (2010) Bolzonella, M., et al. A&A, 2010, 524, A76
- Bower et al. (2006) Bower, R. G., Benson, A. J., Malbon, R., et al. 2006, MNRAS, 370, 645
- Chiaberge et al. (2015) Chiaberge, M., Gilli, R., Lotz, J. M., & Norman, C. 2015, ApJ, 806, 147
- Choi et al. (2015) Choi, E., Ostriker, J. P., Naab, T., Oser, L. & Moster, B. P. 2015, MNRAS, 449, 4105
- Coldwell et al. (2017) Coldwell, G. V., Pereyra, L., Alonso, S. 2017, MNRAS, 467,3338
- Darvish et al. (2016) Darvish, B., Mobasher, B., Sobral, D., et al. 2016, 825, 113
- De Propris et al. (2014) De Propris, R., et al. 2014, MNRAS, 444, 2200
- Dressler (1980) Dressler, A., 1980, ApJ, 246, 351
- Dunlop et al. (2003) Dunlop J. S., McLure R. J., Kukula M. J., et al. 2003, MNRAS, 340, 1095
- Ehlert et al. (2014) Ehlert, S.; von der Linden, A.; Allen, S. W. et al. 2014, 437, 1942
- Ellison et al. (2011) Ellison, S. L., Patton, D. R., Mendel, J. T., & Scudder, J. M. 2011, MNRAS, 418, 2043
- Farouki et al. (1981) Farouki, R., & Shapiro, S. L. 1981, ApJ, 243, 32
- Feldmann et al. (2010) Feldmann, R., Carollo, C. M., Mayer, L., et al. 2010, ApJ, 709, 218
- Floyd et al. (2004) Floyd D. J. E., Kukula M. J., Dunlop J. S., et al. 2004, MNRAS, 355, 196
- Gallazzi et al. (2005) Gallazzi, A., Charlot, S., Brinchmann, J., White, S. D. M., & Tremonti, C. A. 2005, MNRAS, 362, 41
- Gilmour et al. (2007) Gilmour R., Gray M. E., Almaini O., et al. 2007, MNRAS, 380, 1467
- Gordon et al. (2018) Gordon, Y. A. et al. 2018, MNRAS, 475, 4223
- Gunn & Gott (1972) Gunn, J.E., & Gott, J.R. 1972, ApJ, 176, 1
- Gürkan et al. (2015) Gürkan G. et al., 2015, MNRAS, 452, 3776
- Haggard et al. (2010) Haggard D., Green P. J., Anderson S. F., et al. 2010, ApJ, 723, 1447
- Hardcastle et al. (2013) Hardcastle M. J. et al., 2013, MNRAS, 429, 2407
- Harrison (2017) Harrison, C. M. 2017, Nature Astronomy, 1, 0165
- Heckman & Best (2014) Heckman T. M., & Best P. N., 2014, ARA&A, 52, 589
- Henriques et al. (2017) Henriques, B., et al. 2017, MNRAS, 469, 2626
- Hopkins et al. (2006) Hopkins, P. F., Hernquist, L., Cox, T. J., et al. 2006, ApJS, 163, 1
- Hopkins et al. (2008) Hopkins, P. F., et al. 2008, ApJS, 175, 356
- Hopkins et al. (2014) Hopkins, P. F., Kocevski, D. D., & Bundy, K. 2014, MNRAS, 445, 823
- Hwang et al. (2012) Hwang, H. S., Park, C., Elbaz, D., Choi, Y. Y., 2012, A&A, 538, A15
- Huang et al. (2013a) Huang, S., Ho, L. C., Peng, C. Y. et al. 2013, ApJ, 766, 47
- Huang et al. (2013b) Huang, S., Ho, L. C., Peng, C. Y. et al. 2013, ApJL, 768, 28
- Jian et al. (2012) Jian, H., et al. 2012, ApJ, 754, 26
- Kampczyk et al. (2013) Kampczyk, P., Lilly, S. J., de Ravel, L., 2013, ApJ, 762, 43
- Kawinwanichakij et al. (2017) Kawinwanichakij, P., et al. 2017, ApJ, 847, 134
- Kauffmann & Haehnelt (2000) Kauffmann, G. & Haehnelt, M. 2000, MNRAS, 312, 576
- Kauffmann et al. (2003a) Kauffmann, G., Heckman, T. M., Tremonti, C., et al. 2003, MNRAS, 346, 1055
- Kauffmann et al. (2003b) Kauffmann, G., et al. 2003a, MNRAS, 341, 33
- Kauffmann et al. (2004) Kauffmann, G., White, S. D. M., Heckman, T. M., et al. 2004, MNRAS, 353, 713
- Kawakatu et al. (2006) Kawakatu, N., Anabuki, N., Nagao, T., Umemura, M., & Nakagawa, T. 2006, ApJ, 637, 104
- Kaviraj et al. (2015) Kaviraj, S., Shabala, S. S., Deller, A. T., & Middelberg, E. 2015, MNRAS, 452, 774
- Khabiboulline et al. (2014) Khabiboulline, E. T., Steinhardt, C. L., Silverman, J. D., et al. 2014, ApJ, 795, 62
- Knobel et al. (2015) Knobel, C. et al. 2015, ApJ, 800, 24
- Kolwa et al. (2019) Kolwa, S. et al. 2019, MNRAS, 482, 5156
- Kormendy & Kennicutt (2004) Kormendy J., & Kennicutt R. C. 2004, ARA&A, 42, 603
- Kormendy & Ho (2013) Kormendy J., & Ho L. C. 2013, ARA&A, 51, 511
- Koulouridis et al. (2014) Koulouridis, E., Plionis, M., Melnyk, O., et al. 2014, A&A, 567, A83
- Koulouridis et al. (2018) Koulouridis, E. et al. 2018, A&A, 620, A20
- Kovač et al. (2010) Kovač, K., et al. 2010, ApJ, 708, 505
- Kovač et al. (2014) Kovač, K., Lilly, S. J., Knobel, C., et al. 2014, MNRAS, 438, 717
- Larson et al. (1980) Larson, R. B., Tinsley, B. M., & Caldwell, C. N. 1980, ApJ, 237, 692
- Lee et al. (2012) Lee, Gwang-Ho et al. 2012, ApJ, 745, 125L
- Leslie et al. (2016) Leslie, S. K., Kewley, L. J.; Sanders, D. B., Lee, N., 2016, MNRAS, 455, 82
- Li et al. (2019) Li, F. et al. 2019, MNRAS, 484, 3806
- Li et al. (2009) Li, C. et al. 2009, MNRAS, 397, 726L
- Lin et al. (2014a) Lin, Lihwai, et al., 2014, ApJ, 782, 33
- Lin et al. (2014b) Lin, Y. et al. 2014, ApJ, 796, 98
- Lopes et al. (2017) Lopes, P. A. A., Ribeiro, A. L. B., Rembold, S. B., 2017, MNRAS, 472, 409
- Magliocchetti et al. (2018) Magliocchetti, M. et al. 2018, MNRAS, 478, 3848
- Martinez et al. (2011) Martínez, H. J. & Muriel, H. 2011, MNRAS, 418L, 148M
- Martini et al. (2007) Martini, P., Mulchaey, J. S., & Kelson, D. D. 2007, ApJ, 664, 761
- Martini et al. (2013) Martini, P., Miller, E. D., Brodwin, M., et al. 2013, ApJ, 768, 1
- Muldrew et al. (2012) Muldrew, S. I. et al., 2012, MNRAS, 419, 2670
- Miller et al. (2003) Miller C. J., Nichol R. C., Gómez P. L., Hopkins A. M., Bernardi M., 2003, ApJ, 597, 142
- Moore et al. (1998) Moore B., Lake G., Katz N., 1998, ApJ, 495, 139
- Moresco et al. (2010) Moresco, M., et al. 2010, A&A, 524, A67
- Mullaney et al. (2012) Mullaney J. R. et al., 2012, ApJ, 419, 95
- Natàlia et al. (2018) Natàlia P. et al. 2018, A&A, 612, A31
- Padmanabhan et al. (2008) Padmanabhan, N. et al. 2008, ApJ, 674, 1217
- Pimbblet et al. (2013) Pimbblet K. A., Shabala, S. S., Haines, C. P., et al. 2013, MNRAS, 429, 1827
- Peng et al. (2010) Peng, Y., Lilly, S. J., Kovač, K., et al. 2010, ApJ, 721, 193
- Peng et al. (2012) Peng, Y., Lilly, S. J., Renzini, A., et al. 2012, ApJ, 757, 4
- Peng et al. (2015) Peng, Y., Maiolino, R., & Cochrane, R. 2015, Nature, 521, 192
- Powell et al. (2018) Powell, M. C. et al. 2018, ApJ, 858, 110
- Quilis et al. (2000) Quilis, V., Moore, B., & Bower, R. 2000, Science, 288, 1617
- Ramos Almeida et al. (2012) Ramos Almeida, C., Bessiere, P. S., Tadhunter, C. N., et al. 2012, MNRAS, 419, 687
- Read et al. (2006) Read J. I., Wilkinson M. I., Evans N. W., Gilmore G., Kleyna J. T., 2006, MNRAS, 366, 429
- Sabater et al. (2013) Sabater, J., Best, P. N., & Argudo-Fernández, M., 2013, MNRAS, 430, 638
- Salim et al. (2007) Salim S. et al., 2007, ApJS, 173, 267
- Schawinski et al. (2014) Schawinski, K., Urry, C. M., Simmons, B. D. et al. 2014, MNRAS, 440, 889
- Silverman et al. (2009) Silverman, J. D., Kovač, K., Knobel, C., et al. 2009, ApJ, 695, 171
- Silverman et al. (2015) Silverman, J. D., Miniati, F., Finoguenov, A., et al. 2014, ApJ, 780, 67
- Somerville et al. (2008) Somerville, R. S., Hopkins, P. F., Cox, T. J., Robertson, B. E. & Hernquist, L. 2008, MNRAS, 391, 481
- Strazzullo et al. (2019) Strazzullo, V.; Pannella, M.; Mohr, J. J., et al. 2019, A&A, 622, A117
- Wang & Li (2018) Wang, Lixin & Li, Cheng 2018, MNRAS, 483, 1452
- Wetzel et al. (2012) Wetzel A. R., Tinker J. L., Conroy C., 2012, MNRAS, 424, 232
- Woo et al. (2013) Woo, J., Dekel, A., Faber, S. M., et al. 2013, MNRAS, 428, 3306
- van den Bergh (2002) van den Bergh S. 2002, ApJ, 124, 782
- van den Bosch et al. (2008) van den Bosch F. C., Aquino D., Yang X., et al. 2008, MNRAS, 387, 79
- Villforth et al. (2012) Villforth, C., Sarajedini, V., & Koekemoer, A. 2012, MNRAS, 426, 360
- von der Linden et al. (2010) von der Linden A., Wild V., Kauffmann G., White S. D. M., Weinmann S., 2010, MNRAS, 404, 1231
- Yang et al. (2007) Yang, X., Mo, H. J., van den Bosch, F. C., et al. 2007, ApJ, 671, 153
- York et al. (2000) York D. G. et al., 2000, AJ, 120, 1579