Viscous resuspension of non-Brownian particles: determination of the concentration profiles and particle normal stresses.
Abstract
We perform local measurements of both the shear rate and the particle fraction to study viscous resuspension in non-Brownian suspensions. A suspension of PMMA spherical particles dispersed in a lighter Newtonian fluid (Triton X100) is sheared in a vertical Couette cell. The vertical profiles of the particle volume fraction are measured for Shields numbers ranging from to , and the variation in the particle normal stress in the vorticity direction of the particle fraction is deduced.
keywords:
non-Brownian suspensions, viscous resuspension, particle normal stresses1 Introduction
Understanding the flow properties of concentrated suspensions is a real challenge in the development of many industrial products (e.g., solid propellant rocket motors and fresh concrete) and in the description of various environmental flows (e.g., torrential lava, mud flows, and submarine slides). Among other transport properties, shear-induced particle migration has received increasing attention in recent decades. Particle migration can be due to inertial effects (Segre & Silberberg, 1962) but also occurs at low Reynolds numbers, for instance, in a Poiseuille flow in which the particles tend to migrate towards the centre of the channel (Koh et al., 1994; Hampton et al., 1997; Butler & Bonnecaze, 1999; Snook et al., 2016), in wide-gap Couette flow towards the outer cylinder (Graham et al., 1991; Abbott et al., 1991; Chow et al., 1994; Sarabian et al., 2019) and outward in cone-and-plate geometry (Chow et al., 1995). Another typical example of shear-induced migration is viscous resuspension whereby an initially settled layer of negatively buoyant particles expands vertically when a shear flow is applied. Viscous resuspension has been observed for the first time by Gadala-Maria (1980) and later explained by Leighton & Acrivos (1986) and Acrivos et al. (1993), who demonstrated that the height of the resuspended particle layer results from the balance between a downward gravitational flux and an upward shear-induced diffusion flux. The authors studied the resuspension of various particles (different sizes and densities) in two different liquids (different viscosities and densities) sheared in a cylindrical Couette device. They measured the height of the resuspended layer of particles, , as a function of the shear rate and showed that the difference between and (i.e., the initial sediment height) normalized by was a function of only the Shields number defined as the ratio between viscous and buoyancy forces:
| (1) |
Their experimental results were found to be in very good agreement with the diffusive flux model developed by Leighton & Acrivos (1986). Later, Zarraga et al. (2000) revisited the results of Acrivos et al. (1993) to determine the particle normal stress in the vorticity direction, , from the height of the resuspended layer of particles by writing the Cauchy momentum balance in the vertical direction:
| (2) |
Then, a relation between and the particle volume fraction at the bottom, , is obtained by the integration of Eq. 2 from the interface between the suspended layer and the clear liquid at the bottom together with the equation of particle number conservation. The relationship between particle normal stress and shear-induced migration (or resuspension) has been the subject of several studies and is still an active area of investigation (Nott & Brady, 1994; Mills & Snabre, 1995; Morris & Brady, 1998; Morris & Boulay, 1999; Deboeuf et al., 2009; Lhuillier, 2009; Nott et al., 2011; Ovarlez & Guazzelli, 2013). The suspension balance model proposed by Morris & Boulay (1999) and refined by Lhuillier (2009) and Nott et al. (2011) offers a promising framework for modelling shear-induced particle migration, but it suffers from a relative lack of experimental data on particle normal stresses. In addition to the above-cited work of Zarraga et al. (2000), who used the viscous resuspension experiment of Acrivos et al. (1993) to deduce for particle volume fractions ranging from to , Deboeuf et al. (2009) determined for particle volume fractions ranging from to through the measurement of the pore pressure in a cylindrical Couette flow. Boyer et al. (2011) used a pressure-imposed shear cell to measure in the range , and Dbouk et al. (2013) determined in the range through the measurement of both the total stress and the pore pressure. See (Guazzelli & Pouliquen, 2018) for a review. All of these studies show a linear relationship between the particle normal stress components and the shear rate, but recently, Saint-Michel et al. (2019) performed X-ray radiography experiments on viscous resuspension that revealed a non-linear relationship with the shear rate.
In this paper, we present the experimental results of viscous resuspension in a Couette device in which the local particle volume fraction and the local shear rate are measured by optical imaging. is obtained by integrating Eq.2 from the interface between the clear fluid and the resuspended layer to any height below the interface. These experiments present the dual advantage that can be determined for a wide range of particle fractions and that the local shear rate can be measured to accurately test the scaling of particle normal stresses with shear rate.
2 Materials and Methods
2.1 Suspension and device
PMMA spheres (Arkema BS572), in diameter and in density, are used. The particles are dispersed in Triton X 100 to which a small amount of a fluorescent dye (Nile Blue A, REF) is added. This mixture is Newtonian with a viscosity of and of density at . The characteristic settling velocity of the particles is then . The liquid and the particles are chosen to have roughly the same refractive index, , and accurate index matching is achieved by tuning the temperature of the chamber that contains the rheometer.
The resuspension experiments are conducted in a Couette cell made of PMMA mounted on a controlled-stress rheometer (Mars II, Thermofisher) (see figure 1(a)). The rotor has a radius , and the stator has a radius . Thus, the gap is much larger than the particle diameter () but is small enough for the shear stress variation to be weak: . Thus, radial shear-induced particle migration is expected to be weak.
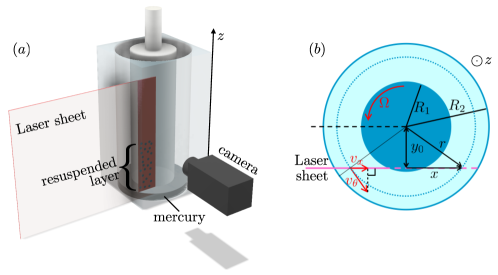
The bottom of the Couette cell is filled with mercury to prevent the particles from migrating out of the gap (under the cup) and to maximize slip at the suspension/bottom interface to have a shear rate as homogeneous as possible inside the gap. The suspension is poured into the rheometer cell and illuminated by a thin vertical laser sheet (thickness ) offset by from the radial plane (see figure 1(b)). A camera (IDS, nominal frequency 33 Hz, full resolution ) is placed at to the enlightened plane. The accurate matching of the refractive index, the thinness of the laser sheet and the resolution of the camera allow the recording of high-quality images with a resolution of per particle.
2.1.1 Experimental procedure
In this paper, we will focus on the steady state of resuspension obtained for various angular velocities of the rotor, : and rounds per minute (). For all these angular velocity values, the Reynolds number () is less than , and the Péclet number () is very large ().
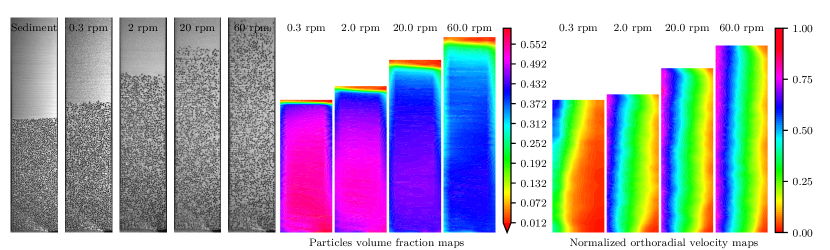
To reach the steady state, the suspension is first sheared with an angular velocity of the rotor equal to for one hour. Then, the speed is set to the desired value for a period until the steady state is reached; the steady stated is considered attained when the torque applied by the rheometer becomes constant. The time duration necessary to achieve the steady state is approximately a few hours. Figure 2 shows the viscous resuspension observed for a few rotor angular velocity values. As increases, the resuspended height increases and the bulk particle concentration decreases. For the slowest rotation speeds (see figure 2), particle layering appears near the walls. This structuring of the suspension is clearly observed by averaging images (see figure 3(b)).
2.2 Velocity and concentration fields
2.2.1 Settled layer
Figure 2 shows an image of the suspension in the settled state. The sediment height is . The volume fraction of the sediment was measured in a graduated cylinder approximately in diameter. A given mass of particles is poured into the vessel containing the suspending liquid (Triton X100), and the sediment height is carefully measured. We took three measurements and obtained .
2.2.2 Concentration fields
To determine the concentration field in the vertical laser plane, each image is binarized with a local threshold. The particles are detected through a watershed segmentation process (Vincent & Soille, 1991). The position of the barycentre of each segmented zone gives the position of each particle centre in the plane sampled with rectangular cells of size and . In each cell, the number of particle centres, , is measured. The particle density is reconstructed in the plane, making the change of variable . Due to the non-zero thickness of the laser sheet and of the slight polydispersity of the particles, is not the absolute particle density, and to compute the true particle volume fraction, we use the particle volume conservation from the sediment to the resuspended state:
| (3) |
To compute the mean particle volume fraction, this procedure is repeated over decorrelated images. Note that the acquisition time can be as long as for the lowest rotation speed of the rotor. Examples of the concentration field are given in figure 2, which deserves a few comments:
- •
-
•
Outside of the structured zones, no or very weak radial particle migration is observed: the maximum difference in the particle volume fraction is evaluated to be less than .
-
•
Along the vertical direction, a concentration gradient is observed as expected in the case of resuspension flows with a sharp interface separating the suspension and the pure fluid (Acrivos et al., 1994).
2.2.3 Velocity fields
The aim of the present study is to investigate resuspension and to link it to particle normal stresses. Because is a function of the shear rate, it is essential that the shear rate is known as precisely as possible. For this purpose, we measured the velocity field in the gap. The shift in the laser sheet out of the radial plane allows particle image velocimetry (PIV) measurements (Manneville et al., 2004) in the plane. Under the assumption that the radial component of the velocity is zero or much smaller than the orthoradial component, can be deduced from a simple projection of along the orthoradial direction (see figure 1(b)):
| (4) |
The velocity field is computed using the open source software DPIVSOFT111Available on the web (https://www.irphe.fr/meunier/) (Meunier & Leweke, 2003). Each image is divided into correlation windows of size . Each correlation window contains approximately particles that are the PIV tracers. The cross correlation of the corresponding windows from two successive images yields the mean velocity of the particles in the window. The in-plane loss of pairs error is decreased by translating the correlation windows in a second run (Westerweel, 1997), thus reducing the correlation windows size to . The same procedure performed on all the windows gives the velocity field, which is averaged over images.
The mapping of the -component of the velocity field in the plane is then obtained and used to reconstruct the velocity field in the plane. Velocity maps are shown in figure 2, in which the velocity normalized by the velocity of the rotor is represented for several values of . Note that the PIV measurements also enable estimation of the z-component of the velocity, particularly to check that there is no significant secondary flow. For all the experiments, we checked that the vertical velocity was less than of and did not present any peculiar spatial correlation. It is clear from figure 2 that there is a significant apparent wall slip, especially for the low angular velocities, i.e., the large particle volume fractions. The wall slip phenomenon in concentrated non-Brownian suspensions is well known (Jana et al., 1995; Ahuja & Singh, 2009; Blanc et al., 2011; Korhonen et al., 2015) and can be at the origin of the very large discrepancy between the macroscopic expected shear rate, , and the true local shear rate that can be deduced from the PIV measurements:
| (5) |
Figure 3 displays the ratio of the measured shear rate to the nominal shear rate calculated at the middle of the gap, , as a function of for all the values of . A few comments on this figure are needed. First, it is observed that all the data collapse on a unique curve regardless of the angular velocity of the rotor. This finding is consistent with the results of Jana et al. (1995) and the fact that the difference between and is mainly due to apparent wall slip that arises from particle layering near the cylinders (Blanc et al., 2013). Particle layering is clearly seen in figure 3(inset), which is an averaged image obtained for . Second, wall slip becomes negligible when the particle volume fraction is small enough . In contrast, for higher concentrations, the local shear rate can substantially deviate from ; for the smallest values of (the largest values of ), the true shear rate can be as small as one-fourth of the apparent macroscopic shear rate, making it necessary to measure the velocity field in the gap.

2.3 Results
2.3.1 Concentration profiles
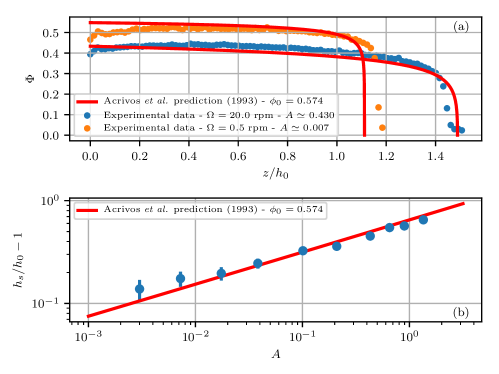
Figure 4(a) shows two concentration profiles averaged over the central third of the gap at low () and high () angular velocities. It is observed that the concentration is almost constant in the resuspended layer and drops to zero quite sharply, even for the highest angular velocity. This sharp interface between the resuspended layer and the clear fluid was already predicted by Acrivos et al. (1993) when interpreting their experiments in light of a diffusive flux model. Figure 4(a) also shows the profiles predicted by Acrivos et al. (1993). The agreement is quite good even though the resuspension height that we measured at low angular velocity is slightly larger than that obtained by Acrivos et al. (1993) and marginally smaller at high angular velocity. This trend is seen in figure 4, where, as in Acrivos et al. (1993), we observe a power-law dependence of the sediment expansion with the Shields number (1) but with an exponent slightly lower than (Zarraga et al., 2000).
Finally, it should be noted that near the bottom of the Couette cell, the particle concentration tends to decrease. This finding may be related to a problem of particle detection near the interface with mercury, which reflects light and may downgrade the image quality in its vicinity. In the next section, in which the concentration will be used to evaluate , we will not consider this zone in which we are not absolutely confident in the particle concentration measurement.
2.3.2 Determination of
To determine , Eq.2 is integrated from the interface between the resuspended layer and the clear fluid to the height :
| (6) |
Thus, for each point , the third particle normal stress, the local shear rate and the particle volume fraction are computed. Figure 5 shows the variation of normalized by as a function of . To avoid boundary effects, we discarded the measurements taken for and or .
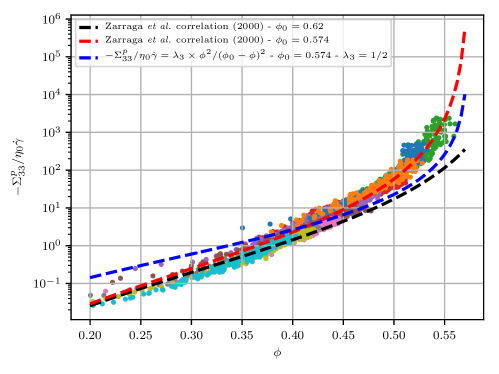
In figure 5, we observe that the data almost collapse on a single curve for a wide range of between and with variation in over more than five decades. We restricted the data to particle volume fractions greater than because, as shown in figure 4, below this value, the concentration profile is very sharp, which makes it difficult to measure the concentration. The data are somewhat scattered, especially for the largest values of . This finding may have different origins. First, it can stem from experimental issues because, as observed in figure 4, for the lowest angular velocity values (i.e., the larger particle volume fractions), the profile is nearly flat, which means that given by the integral of varies greatly with . Thus, even a small error in is likely to cause a large error in the computation of . In addition to these experimental issues, the shear-thinning character displayed by most non-Brownian suspensions (Acrivos et al., 1994; Lobry et al., 2019; Vázquez-Quesada et al., 2016, 2017; Tanner et al., 2018) can also be at the origin of the scattering observed for the largest concentrations. Indeed, it is expected that particle normal stresses vary with the shear stress (and not the shear rate) (Boyer et al., 2011). Thus, as the angular velocity increases, the viscosity, , decreases and the ratio increases for a given , which should improve the collapse of the data.
| (7) |
The black curve is obtained with the original value of proposed by Zarraga et al. (2000) (), while the red curve has been obtained for : the value of the particle volume fraction inside the settled layer that we measured. We observe a very good agreement between the experimental data and the correlation from Zarraga et al. (2000). Furthermore, Zarraga et al. (2000) established the correlation for a particle volume fraction ranging from to , while our results show that this correlation can be expanded to a wider range of concentrations. The blue curve is obtained by using the correlation obtained by Boyer et al. (2011) for (with ):
| (8) |
and assuming that and , as suggested by Morris & Boulay (1999).
The agreement between the blue curve and our data is not satisfactory. In our opinion, this discrepancy does not call into question the results obtained by Boyer et al. (2011) but rather the lack of variability in with . This last result has already been noted by Gallier et al. (2014) and was previously suggested by Morris & Boulay (1999) themselves.
In conclusion, with the aim of studying viscous resuspension, we conducted local measurements of both the shear rate and the particle volume fraction and deduced the variation of with . Our results confirm the correlation proposed by Zarraga et al. (2000) and extend it over a wider range of particle volume fractions.
We are grateful to L. Lobry, F. Peters and B. Saint-Michel for fruitful discussions, and D. Gilbert for the 3D sketch of the experimental device.
References
- Abbott et al. (1991) Abbott, JR, Tetlow, N, Graham, AL, Altobelli, SA, Fukushima, Eiichi, Mondy, LA & Stephens, TS 1991 Experimental observations of particle migration in concentrated suspensions: Couette flow. Journal of rheology 35 (5), 773–795.
- Acrivos et al. (1994) Acrivos, Andreas, Fan, Xiaoxing & Mauri, Roberto 1994 On the measurement of the relative viscosity of suspensions. Journal of Rheology 38 (5), 1285–1296.
- Acrivos et al. (1993) Acrivos, A, Mauri, Roberto & Fan, X 1993 Shear-induced resuspension in a couette device. International journal of multiphase flow 19 (5), 797–802.
- Ahuja & Singh (2009) Ahuja, Amit & Singh, Anugrah 2009 Slip velocity of concentrated suspensions in couette flow. Journal of Rheology 53 (6), 1461–1485.
- Blanc et al. (2013) Blanc, Frédéric, Lemaire, Elisabeth, Meunier, Alain & Peters, François 2013 Microstructure in sheared non-brownian concentrated suspensions. Journal of rheology 57 (1), 273–292.
- Blanc et al. (2011) Blanc, Frédéric, Peters, François & Lemaire, Elisabeth 2011 Local transient rheological behavior of concentrated suspensions. Journal of Rheology 55 (4), 835–854.
- Boyer et al. (2011) Boyer, François, Guazzelli, Élisabeth & Pouliquen, Olivier 2011 Unifying suspension and granular rheology. Physical Review Letters 107 (18), 188301.
- Butler & Bonnecaze (1999) Butler, Jason E & Bonnecaze, Roger T 1999 Imaging of particle shear migration with electrical impedance tomography. Physics of fluids 11 (8), 1982–1994.
- Chow et al. (1995) Chow, Andrea W, Iwayima, JH, Sinton, Steven W & Leighton, DT 1995 Particle migration of non-brownian, concentrated suspensions in a truncated cone-and-plate. In Society of Rheology Meeting, Sacramento, CA, , vol. 103.
- Chow et al. (1994) Chow, Andrea W, Sinton, Steven W, Iwamiya, Joseph H & Stephens, Thomas S 1994 Shear-induced particle migration in couette and parallel-plate viscometers: Nmr imaging and stress measurements. Physics of Fluids 6 (8), 2561–2576.
- Dbouk et al. (2013) Dbouk, Talib, Lobry, Laurent & Lemaire, Elisabeth 2013 Normal stresses in concentrated non-brownian suspensions. Journal of Fluid Mechanics 715, 239–272.
- Deboeuf et al. (2009) Deboeuf, Angélique, Gauthier, Georges, Martin, Jérôme, Yurkovetsky, Yevgeny & Morris, Jeffrey F 2009 Particle pressure in a sheared suspension: A bridge from osmosis to granular dilatancy. Physical review letters 102 (10), 108301.
- Deboeuf et al. (2018) Deboeuf, S, Lenoir, N, Hautemayou, D, Bornert, M, Blanc, F & Ovarlez, G 2018 Imaging non-brownian particle suspensions with x-ray tomography: Application to the microstructure of newtonian and viscoplastic suspensions. Journal of Rheology 62 (2), 643–663.
- Gadala-Maria (1980) Gadala-Maria, Francis A 1980 The rheology of concentrated suspensions. .
- Gallier et al. (2016) Gallier, Stany, Lemaire, Elisabeth, Lobry, Laurent & Peters, Francois 2016 Effect of confinement in wall-bounded non-colloidal suspensions. Journal of Fluid Mechanics 799, 100–127.
- Gallier et al. (2014) Gallier, Stany, Lemaire, Elisabeth, Peters, François & Lobry, Laurent 2014 Rheology of sheared suspensions of rough frictional particles. Journal of Fluid Mechanics 757, 514–549.
- Graham et al. (1991) Graham, AL, Altobelli, SA, Fukushima, Eiichi, Mondy, LA & Stephens, TS 1991 Note: Nmr imaging of shear-induced diffusion and structure in concentrated suspensions undergoing couette flow. Journal of Rheology 35 (1), 191–201.
- Guazzelli & Pouliquen (2018) Guazzelli, Élisabeth & Pouliquen, Olivier 2018 Rheology of dense granular suspensions. Journal of Fluid Mechanics 852.
- Hampton et al. (1997) Hampton, RE, Mammoli, AA, Graham, AL, Tetlow, N & Altobelli, SA 1997 Migration of particles undergoing pressure-driven flow in a circular conduit. Journal of Rheology 41 (3), 621–640.
- Jana et al. (1995) Jana, SC, Kapoor, B & Acrivos, A 1995 Apparent wall slip velocity coefficients in concentrated suspensions of noncolloidal particles. Journal of Rheology 39 (6), 1123–1132.
- Koh et al. (1994) Koh, Christopher J, Hookham, Philip & Leal, L Gary 1994 An experimental investigation of concentrated suspension flows in a rectangular channel. Journal of Fluid Mechanics 266, 1–32.
- Korhonen et al. (2015) Korhonen, Marko, Mohtaschemi, Mikael, Puisto, Antti, Illa, Xavier & Alava, Mikko J 2015 Apparent wall slip in non-brownian hard-sphere suspensions. The European Physical Journal E 38 (5), 46.
- Leighton & Acrivos (1986) Leighton, David & Acrivos, Andreas 1986 Viscous resuspension. Chemical engineering science 41 (6), 1377–1384.
- Lhuillier (2009) Lhuillier, Daniel 2009 Migration of rigid particles in non-brownian viscous suspensions. Physics of Fluids 21 (2), 023302.
- Lobry et al. (2019) Lobry, Laurent, Lemaire, Elisabeth, Blanc, Frederic, Gallier, Stany & Peters, François 2019 Shear thinning in non-brownian suspensions explained by variable friction between particles. Journal of Fluid Mechanics 860, 682–710.
- Manneville et al. (2004) Manneville, Sébastien, Bécu, Lydiane & Colin, Annie 2004 High-frequency ultrasonic speckle velocimetry in sheared complex fluids. The European Physical Journal-Applied Physics 28 (3), 361–373.
- Meunier & Leweke (2003) Meunier, P & Leweke, T 2003 Analysis and optimization of the error caused by high velocity gradients in piv. Exp. Fluids 35, 408–421.
- Mills & Snabre (1995) Mills, P & Snabre, P 1995 Rheology and structure of concentrated suspensions of hard spheres. shear induced particle migration. Journal de Physique II 5 (10), 1597–1608.
- Morris & Brady (1998) Morris, JF & Brady, JF 1998 Pressure-driven flow of a suspension: Buoyancy effects. International journal of multiphase flow 24 (1), 105–130.
- Morris & Boulay (1999) Morris, Jeffrey F & Boulay, Fabienne 1999 Curvilinear flows of noncolloidal suspensions: The role of normal stresses. Journal of rheology 43 (5), 1213–1237.
- Nott & Brady (1994) Nott, Prabhu R & Brady, John F 1994 Pressure-driven flow of suspensions: simulation and theory. Journal of Fluid Mechanics 275, 157–199.
- Nott et al. (2011) Nott, Prabhu R, Guazzelli, Elisabeth & Pouliquen, Olivier 2011 The suspension balance model revisited. Physics of Fluids 23 (4), 043304.
- Ovarlez & Guazzelli (2013) Ovarlez, Guillaume & Guazzelli, Elisabeth 2013 Migration induite par cisaillement dans les suspensions. In Congrès français de mécanique.
- Saint-Michel et al. (2019) Saint-Michel, Brice, Manneville, Sébastien, Meeker, Steven, Ovarlez, Guillaume & Bodiguel, Hugues 2019 X radiography of viscous resuspension. arXiv preprint arXiv:1904.12655 .
- Sarabian et al. (2019) Sarabian, Mohammad, Firouznia, Mohammadhossein, Metzger, Bloen & Hormozi, Sarah 2019 Fully developed and transient concentration profiles of particulate suspensions sheared in a cylindrical couette cell. Journal of Fluid Mechanics 862, 659–671.
- Segre & Silberberg (1962) Segre, G & Silberberg, Alex 1962 Behaviour of macroscopic rigid spheres in poiseuille flow part 2. experimental results and interpretation. Journal of fluid mechanics 14 (1), 136–157.
- Snook et al. (2016) Snook, Braden, Butler, Jason E & Guazzelli, Élisabeth 2016 Dynamics of shear-induced migration of spherical particles in oscillatory pipe flow. Journal of Fluid Mechanics 786, 128–153.
- Suzuki et al. (2008) Suzuki, M, Shinmura, T, Iimura, K & Hirota, M 2008 Study of the wall effect on particle packing structure using x-ray micro computed tomography. Advanced Powder Technology 19 (2), 183–195.
- Tanner et al. (2018) Tanner, Roger I, Ness, Christopher, Mahmud, Arif, Dai, Shaocong & Moon, Jiyoung 2018 A bootstrap mechanism for non-colloidal suspension viscosity. Rheologica Acta 57 (10), 635–643.
- Vázquez-Quesada et al. (2017) Vázquez-Quesada, Adolfo, Mahmud, Arif, Dai, Shaocong, Ellero, Marco & Tanner, Roger I 2017 Investigating the causes of shear-thinning in non-colloidal suspensions: Experiments and simulations. Journal of Non-Newtonian Fluid Mechanics 248, 1–7.
- Vázquez-Quesada et al. (2016) Vázquez-Quesada, Adolfo, Tanner, Roger I & Ellero, Marco 2016 Shear thinning of noncolloidal suspensions. Physical review letters 117 (10), 108001.
- Vincent & Soille (1991) Vincent, Luc & Soille, Pierre 1991 Watersheds in digital spaces: an efficient algorithm based on immersion simulations. IEEE Transactions on Pattern Analysis & Machine Intelligence (6), 583–598.
- Westerweel (1997) Westerweel, Jerry 1997 Fundamentals of digital particle image velocimetry. Measurement science and technology 8 (12), 1379.
- Yeo & Maxey (2010) Yeo, Kyongmin & Maxey, Martin R 2010 Ordering transition of non-brownian suspensions in confined steady shear flow. Physical Review E 81 (5), 051502.
- Zarraga et al. (2000) Zarraga, Isidro E, Hill, Davide A & Leighton Jr, David T 2000 The characterization of the total stress of concentrated suspensions of noncolloidal spheres in newtonian fluids. Journal of Rheology 44 (2), 185–220.