Propagation of star formation at sub-kiloparsec scales
Abstract
We study the propagation of star formation based on the investigation of the separation of young star clusters from H ii regions nearest to them. The relation between the separation and colour index (or age) of a star cluster was found. The average age of star clusters increases with the separation as the 1.0-1.2 power in the separation range from 40 to 200 pc and as the 0.4-0.9 power in the range of 100-500 pc in the galaxies with symmetric morphology. The galaxies with distorted asymmetric disc structure show more complex and steeper (power at separations from 40 to 500 pc) dependence between the age and the separation. Our results confirm the findings of previous studies on the dominant role of turbulence in propagation of the star formation process on spatial scales up to 500 pc and on time scales up to 300 Myr. On a smaller scale ( pc), other physical processes, such as stellar winds and supernova explosions, play an important role along with turbulence. On the scale of stellar associations (100-200 pc and smaller), the velocity of star formation propagation is almost constant and it has a typical value of a few km s-1.
keywords:
H ii regions – galaxies: photometry – galaxies: ISM – galaxies: star clusters – open clusters and associations: general1 Introduction
Physical processes such as gravitational collapse and turbulence compression are believed to play a key role in the evolution of star formation regions over a wide range of scales, from smallest clumps of young stars to star complexes (Scalo, 1985; Elmegreen, 2010). The sequential hierarchical structures of young stellar groups in these regions are explained in terms of triggered star formation, when new stars form as the result of gravitational instabilities in shocked layers initiated by expanding H ii bubbles (Elmegreen & Lada, 1977; Efremov & Elmegreen, 1998; Elmegreen et al., 2000; Elmegreen, 2002, 2006, 2011). The largest coherent star formation regions are star complexes with diameters of the order of pc (Elmegreen & Efremov, 1996; Efremov & Elmegreen, 1998).
Massive star formation complexes in turbulent discs are the result of instabilities in self-gravitating gas discs (Fisher et al., 2017). They are observed in both nearby and distant galaxies. Large star formation regions in galaxies at are seen as star formation clumps in H (Ali et al., 2017; Fisher et al., 2017). Sizes of these complexes/clumps correlate with turbulence and gas fraction in discs (Fisher et al., 2017). Modern methods of analysis of the largest coherent star formation scales such as two-point correlation function give results which are in good agreement with both classic methods (Gaussians, for instance) and theoretical Jeans lengths (Ali et al., 2017).
The turbulence predicts a relation between age and size of star formation regions (Elmegreen & Efremov, 1996; Efremov & Elmegreen, 1998). A diffusion-driven expansion would produce a relation between age and size (Grasha et al., 2017). Elmegreen & Efremov (1996) and Efremov & Elmegreen (1998) originally studied positions and ages of Cepheid variables and star clusters in the Large Magellanic Cloud and found that the average age difference between pairs of star clusters increases with their separation as in the separation range from 8 to 780 pc. Later de la Fuente Marcos & de la Fuente Marcos (2009) found that the Milky Way star cluster pairs also satisfy the relation between age differences and their separation with the power if the effects of incompleteness and cluster dissolution are taken into account. Grasha et al. (2017) studied the connection between the age difference and separation of star cluster pairs in eight local galaxies and found that the age difference increases with the cluster pair separation to the power, with the maximum size, over which star formation is physically correlated, ranging from to pc in different galaxies. Numerical simulations investigating the propagation of star formation in a turbulent medium derive an age-separation relation to the 0.5 power for star groups with separations pc (Nomura & Kamaya, 2001), which is in agreement with the observational data.
The relation between age difference and separation for star clusters is also similar to the correlation between size and line width of giant molecular clouds (GMC) suggesting that the crossing time in a GMC increases as the square root of the size of the star formation region (Larson, 1981; Elmegreen & Efremov, 1996).
In this article, we develop an alternative method for studying processes of triggered star formation. In Gusev et al. (2018) we found, but only noted a dependence between separations of star clusters from the nearest H ii region and colour index of the star cluster for the pairs with non-deprojected angular separation from 1.5 to 7 arcsec. This study is devoted to the analysis of this dependence. As is known, colour index can be used as an age indicator for young stellar systems (Whitmore et al., 2010).
The youngest star formation regions with ages less than 10 Myr are usually associated with H ii regions. They evolves during the first tens Myr of their lives through several evolutionary stages, from the stage when young stars clumps are completely obscured by their dusty gas cocoons to the stage of a young star cluster with no evidence of H ii (Lada & Lada, 2003). Whitmore et al. (2011) developed the evolutionary classification scheme of star clusters based on the Hubble Space Telescope (HST) observations of M83. Star clusters become visible in optical bands since about 1 Myr (’obscured clusters’). Ionized gas stays spatially coincident with cluster stars during Myr (’emerging clusters’). Clusters with ages Myr have a small H ii bubble with radius of pc (’very young clusters’), surrounding the cluster. Star clusters with ages Myr have a larger ionized gas bubble surrounding the cluster (’young clusters’). H ii bubbles are dissolved around star formation regions older than Myr. From the age Myr, we observe blue, but redden ageing star clusters without H emission (’intermediate-age clusters’ by Whitmore et al., 2011). These clusters are free from dust.
Thus, the dependence between separations of star clusters from the nearest H source and colour index (age) of a star cluster can be used to directly measure the velocity of star formation propagation.
2 Search and selection of star formation regions
2.1 Observations and data reduction
The sample of galaxies is based on our photometric survey of 26 galaxies (Gusev et al., 2015). We selected nine of them (NGC 266, NGC 628, NGC 2336, NGC 3184, NGC 3726, NGC 5585, NGC 6217, NGC 6946, and NGC 7331) with observed star formation regions and available H spectrophotometric data.
Our own photometric and H (H+[N ii]) observations were described and published earlier (see Gusev et al., 2018, and references therein).

We did not observe NGC 3184 from our sample in filter. Therefore we used an image of NGC 3184 obtained by Larsen & Richtler (1999) and available in the NED111http://ned.ipac.caltech.edu/ database. The absolute calibration of the image of the galaxy was carried out using parameters of descriptors from original FITS files (images) and their explanations in Larsen & Richtler (1999). Additionally, we checked the calibration using the aperture photometry data for the galaxies from the LEDA222http://leda.univ-lyon1.fr/ database (Paturel at al., 2003). We also compared our images of NGC 3184 with those from Larsen & Richtler (1999). Pixel-to-pixel deviations are within the stated accuracy of measurements and they did not show any systematic errors.
We also used H+[N ii] FITS images of NGC 3726 and NGC 5585 obtained by Knapen et al. (2004) and Dale et al. (2009). Parameters for absolute calibration of H+[N ii] flux to units of erg s-1cm-2 were found in descriptors of the FITS files. Additionally, we checked the calibration using the integrated H+[N ii] fluxes of NGC 5585 measured in James et al. (2004) and Kennicutt et al. (2008).
These data were used for identification and selection of star formation regions.
| Galaxy | Type | Inclination | PA | |||||||
|---|---|---|---|---|---|---|---|---|---|---|
| (mag) | (mag) | (degree) | (degree) | (arcmin) | (kpc) | (Mpc) | (mag) | (mag) | ||
| 1 | 2 | 3 | 4 | 5 | 6 | 7 | 8 | 9 | 10 | 11 |
| NGC 628 | SA(s)c | 9.70 | –20.72 | 7 | 25 | 5.23 | 11.0 | 7.2 | 0.254 | 0.04 |
| NGC 3184 | SAB(rs)cd | 10.31 | –19.98 | 14 | 117 | 3.79 | 11.3 | 10.2 | 0.060 | 0.02 |
| NGC 3726 | SAB(r)c | 10.31 | –20.72 | 49 | 16 | 2.62 | 10.9 | 14.3 | 0.060 | 0.30 |
| NGC 5585 | SAB(s)d | 10.94 | –18.73 | 53 | 34 | 2.13 | 3.5 | 5.7 | 0.057 | 0.38 |
| NGC 6946 | SAB(rs)cd | 9.75 | –20.68 | 31 | 62 | 7.74 | 13.3 | 5.9 | 1.241 | 0.04 |
a Absolute magnitude of a galaxy corrected for Galactic extinction and inclination effects.
b Radius of a galaxy at the isophotal level 25 mag/arcsec2 in the band corrected for Galactic extinction and inclination effects.
2.2 Selection of young star clusters and H ii regions
Procedure of identification and preliminary selection of star formation regions on and H images of galaxies using the SExtractor333http://sextractor.sourceforge.net/ program was described in detail in Gusev et al. (2018).
Coordinates of all objects (star clusters on images and H ii regions on H images) were recalculated for the deprojected positions using position angles and inclinations of the galaxies by standard formulae. In the next step, we determined the separation, , between a star cluster and the nearest H ii region (SC-HiiR pair) for all selected star clusters. Herewith, we suggest that a single H ii region may be paired with up to multiple star clusters.
The relation between colour indices of young star clusters and their separations is given in Fig. 1. Unlike Fig. 3 in Gusev et al. (2018), Fig. 1 shows deprojected angular separations.
Whitmore et al. (2011) showed that the morphology of ionized gas bubbles can be used as an age indicator of star clusters. Unfortunately, we are not able to study the H ii morphology directly on scales of pc, because our angular resolution is 1-1.5 arcsec. However, as was shown in Gusev et al. (2016), the distance between photometric centres of gas emission and star clusters correlates within a single star formation region with the relation between stellar and gas absorption, depending on the age, and can be used as an evolutionary indicator.
The diagrams in Fig. 1 show that clusters with close H emission sources ( 2 arcsec) have a wide range of colours. This is a result of a significant absorption in young dusty star clusters.
Fig. 1 shows a correlation between the separating distance from the nearest H ii region and colour index of a star cluster: clusters with 2 arcsec 8 arcsec become redder with increase of separations. Here we do not observe objects with extremely red colour indices. Apparently, the absorption in these star clusters without nearby H emission is close to zero (Whitmore et al., 2011).
Remark the absence of any dependence between separation and colour index for star clusters with 2 arcsec 8 arcsec (Fig. 1). The reason is that young stellar systems with ages from 10 to 200-300 Myr have an approximately constant colour index unlike . It is clearly illustrated in Fig. 2 where simple stellar population (SSP) models with Salpeter IMF and the interval of masses, ranging from to , are shown. Here we used the grid of isochrones provided by the Padova group (Marigo et al., 2008) (version 2.3) and obtained via the online server CMD444http://stev.oapd.inaf.it/cgi-bin/cmd.
We did not find a visual correlation between separation from H ii regions and colours of star clusters for objects with SC-HiiR deprojected separation larger than 8 arcsec.
Efremov & Elmegreen (1998) estimated a duration of star formation in star complexes at large spatial scales (500-1000 pc) to be about 30 Myr. Among star clusters within a complex, both very young ( Myr) and intermediate-age objects ( Myr) are encountered. The colour indices of star clusters in Fig. 1 correspond to the range from several Myr to a few hundred Myr (see Fig. 2).

Our angular resolution does not allow us to study stellar groups at the scale of star clusters in distant galaxies. For larger star formation regions, SSP model is not correct (Efremov & Elmegreen, 1998) and the colours of these stellar groups depend on both the age and the star formation history. For this reason we eliminated three distant ( 20 Mpc) galaxies NGC 266, NGC 2336, and NGC 6217 from further consideration. We also excluded the high inclination galaxy NGC 7331 (), because of large uncertainty of projection effects.

The sample of remaining five galaxies is presented in Table 1, where the Galactic absorption, , is taken from the NED database, and other parameters are taken from the LEDA database. The morphological type of a galaxy is shown in column (2), the apparent and absolute magnitudes are given in columns (3) and (4), the inclination and position angles are listed in columns (5) and (6), and the isophotal radii in arcmin and kpc are presented in columns (7) and (8). The adopted distances are given in column (9). The Galactic absorption and the dust absorption due to the inclination of a galaxy are presented in columns (10) and (11). The adopted value of the Hubble constant is equal to H km s-1Mpc-1.
Fig. 3 shows dependences between the colour indexof star clusters and the linear separation of SC-HiiR pairs for five studied galaxies. Here we excluded star clusters in close SC-HiiR pairs with undefined absorption ( pc, green dots in Fig. 3) and clusters with large measured photometric errors ( mag and/or mag). The remaining star clusters have no H emission and therefore they are older than 10 Myr. As seen from the figure, a correlation between and separation is observed on distances up to 300 pc and more. Below we will consider the star clusters in the range of separation where the linear correlation between colour and separation is observed.
After preliminary selection, the sample included 741 pair candidates in NGC 628, 116 pairs in NGC 3184, 297 pairs in NGC 3726, 126 pairs in NGC 5585, and 808 pairs in NGC 6946.
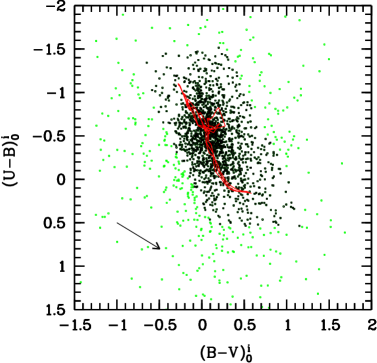

A native source extractor selection is known to include a significant number of non-cluster contaminants after generating the star clusters data base (Grasha et al., 2015). A good test for estimation of the contamination of our star cluster catalogue and its clearing from non-cluster objects, such as background stars and galaxies, and cosmic rays, are colours (Grasha et al., 2019). We checked the disposition of our star cluster candidates on the colour-colour diagram (Fig. 4).
We left for further consideration star cluster candidates whose colours, within maximum allowable errors, are consistent with the colours of SSP CMD evolutionary tracks for stellar systems younger than 1 Gyr (black dots in Fig. 4). The red limit in mag is also the boundary which separates young star clusters with mag from the background Main Sequence yellow stars (Whitmore et al., 2010).
A direct unambiguous relation between age and colour index of a stellar system is possible only in terms of continuously populated IMF. Stochastic effects in the discrete randomly populated IMF begin to play a key role for SSP stellar systems (star clusters) with masses less than (Whitmore et al., 2010; Piskunov at al., 2011). This effect is clearly illustrated in Fig. 19 in Gusev et al. (2016). Due to the impossibility of finding an age by colour for low-massive clusters, we excluded star clusters with masses from further consideration (green dots in Fig. 5).
The final sample includes 503 SC-HiiR pairs in NGC 628, 70 pairs in NGC 3184, 254 pairs in NGC 3726, 40 pairs in NGC 5585, and 577 pairs in NGC 6946. To illustrate the selected objects, we present a couple of postage stamp images of H ii regions and star clusters in the closest (NGC 5585) and the most distant (NGC 3726) galaxies in Fig. 6. Our full sample of identified and finally selected star clusters and H ii regions is shown in Fig. 7 for the NGC 628 galaxy.
3 Results
3.1 Cluster age versus separation relation
Fig. 3 shows a clear linear dependence between the colour index and the separation within a wide range of for all five studied galaxies.
Note here that typical colours differ slightly from galaxy to galaxy (Fig. 3). This may be a result of zero-point calibration errors and/or uncertainty of Galactic or internal extinctions. A special case is NGC 6946 which is located on the low Galactic latitude (see column (10) in Table 1).
Unlike Efremov & Elmegreen (1998) and Grasha et al. (2017), where authors calculated the age difference in star cluster pairs, we can use colour index , corrected for Galactic extinction and inclination effects, as a direct age indicator. The age of H ii bubbles (H sources) is typically equal to a few Myr (Whitmore et al., 2011). The age of star clusters without H emission is tens and hundreds Myr (see Figs. 1 and 2). Thus .


As we noted above, star clusters without H emission are free from dust (Whitmore et al., 2011). Thus, we can estimate age of clusters by their colour indices, corrected for Galactic extinction and inclination effects, using evolutionary models. Variations of colour index for ageing synthetic stellar systems are shown in Fig. 8.
| Galaxy | Range (pc) | ||||||||
| 40-200 | 40-500 | 100-500 | |||||||
| (km s-1) | (km s-1) | (km s-1) | |||||||
| NGC 628 | … | ||||||||
| NGC 3184 | … | ||||||||
| NGC 3726 | … | … | |||||||
| NGC 5585 | … | … | … | ||||||
| NGC 6946 | … | ||||||||
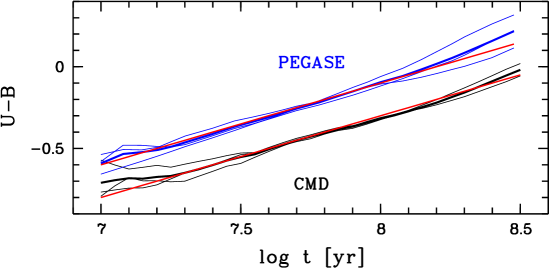
Unfortunately, different modern evolutionary synthesis models do not provide an unambiguous dependence between colour and age. As an example, we present two evolutionary models in Fig. 8. The first of them was described in Section 2.2 (CMD), the second model was calculated using PEGASE.2555http://www2.iap.fr/pegase/ code (Fioc & Rocca-Volmerange, 1997). Both models are based on the Padova stellar library, both have the same parameters of stellar population (SSP, Salpeter IMF with the range of masses from to ). Fig. 8 shows the similar behaviour of evolutionary tracks, however we observe the offset mag between tracks of CMD and PEGASE models.
Given the uncertainties associated with the choice of a model, unknown metallicities of star clusters, and observational errors, we use a linear regression for the colour-age relation (thick grey lines in Fig. 8): . Evolutionary tracks with sub-solar and solar metallicities in both models satisfy this regression in the range of ages from to Myr. Based on more modern CMD model, we calculated ages of star clusters using the relation . The linear regression between age and colour allows us to minimize errors associated with photometric calibration for the slope estimation.
We used several key separation values. Two of them are characteristic scales of hierarchical star formation (100 pc is a typical size of OB-associations and 500 pc is a diameter of star complexes). The other two boundary values of were selected from the observations (40 pc is a minimal linear scale of our observational resolution and 200 pc is a maximal distance where we observe the correlation between the colour and the separation visually in Fig. 3).
As a result, we chose three separation ranges for the further study of the dependence: an inner scale from 40 to 200 pc, an outer scale from 100 to 500 pc, and a general scale from 40 to 500 pc.
Fig. 9 shows the dependence between and for star clusters in five studied galaxies in the used ranges of separation. Coefficients of the equation
| (1) |
for cluster samples in the galaxies are given in Table 2.

Note that three of five studied galaxies (NGC 628, NGC 3184, and NGC 6946) have a regular symmetrical morphology. NGC 5585 has rather the Large Magellanic Cloud type. NGC 3726 has a distorted asymmetric disc. In addition, it is the most distant galaxy of the sample and, therefore, we were unable to identify a sufficient number of close SC-HiiR pairs with pc in it (Fig. 9).
The most reliable results are those obtained for NGC 628 and NGC 6946. On the one hand, these galaxies have a symmetrical regular structure, on the other hand, they provide us with a large statistical material for analysis – more than 500 SC-HiiR pairs.
The graphs in Fig. 9 and the coefficients given in Table 2 show closely resembling slopes for cluster samples in three galaxies (NGC 628, NGC 3184, and NGC 6946) with a regular structure. The calculated slopes lie in the range for separations from 40 to 200 pc. In the outer range of (100-500 pc), the slopes for pair samples in NGC 628 and NGC 6946. This slope turned out to be larger in NGC 3184 (), however, it is calculated with poor accuracy due to insufficient statistics. The mean slope at 40 pc 500 pc is a little less than 1: for SC-HiiR pairs in all three galaxies (Table 2). Coefficients differ from galaxy to galaxy. As we talked above, they are very sensitive to observational errors and model uncertainties.
The dependence in the peculiar galaxy NGC 5585 shows the approximately constant slope at all separation ranges. Unfortunately, the coefficient is determined with a very large error.
SC-HiiR pairs in the asymmetric galaxy NGC 3726 show a rather chaotic distribution on the diagram . This scatter can be caused by various parameters of the medium in the asymmetric disc of the galaxy. Nevertheless, the mean slope at a general range of is equal to 1.22, that is close to the mean slope in NGC 5585.
Plots in Fig. 9 show that the typical age of star clusters in the range, that the power law is calculated over, 40-500 pc, is from 10 to 100-300 Myr. This result is in good agreement with previous studies of dependence between age difference and separation of cluster pairs, which gave correlations for star clusters with ages up to Myr (Efremov & Elmegreen, 1998; Grasha et al., 2017).
3.2 Velocity of propagation of star formation
Data obtained in Section 3.1 enable us to directly determine variations of star formation propagation velocity: . The velocity is
| (2) |
or
| (3) |
where , and , are coefficients from equation (1).
We calculated median velocities, , for SC-HiiR pairs using equations (2), (3). These values are presented in Table 2. We also estimated velocity errors, , based on the coefficients , , and their uncertainties from Table 2. Significant part of SC-HiiR pair samples has extremely large velocity estimation errors, . These estimates are not shown in the table.
The data show the approximately constant or slightly falling velocity of star formation propagation in three regular structure galaxies (NGC 628, NGC 3184, and NGC 6946) with typical velocities km s-1 at separation scales from 40 to 200 pc. The velocity of star formation propagation falls more steeply with time and distance in peculiar galaxies NGC 3726 and NGC 5585 at all studied ranges of . The exception is the inner range 40-200 pc in NGC 3726. As we noted above, this result is unreliable due to a small number of close SC-HiiR pairs in the galaxy. Nevertheless, typical velocities in NGC 3726 and NGC 5585 are also close to a few km s-1 as in three galaxies with regular structure.
Variations of and for different ranges of and different morphology of galaxies will be discussed in the next section.
4 Discussion
Whitmore et al. (2011) studied young star clusters in the grand-design galaxy M83 using the morphology of the surrounding H emission. The relation between the age of a star cluster and radius of H bubble, found in Whitmore et al. (2011), showed a strong age-size correlation for star clusters younger than , with ionized gas bubble growing from a few to pc in size. There is no age-size correlation for star clusters older than and bubble’s radius pc. At this distance, the gas bubble detaches from the star cluster and begins to blur. Its expansion is weakly dependent on the central energy source (explosions of supernovae). The average age of star clusters in M83 at this distance (20 pc) is . Our data obtained from equation (1), and coefficients in Table 2 for clusters in NGC 628 (an example of a galaxy which is similar to M83 by luminosity and morphology) in the range 20-400 pc, give a close age at a distance of 20 pc.

The data for other four galaxies (NGC 3184, NGC 3726, NGC 5585, and NGC 6946) at the ranges of 40-200 pc and 40-500 pc give at the distance 20 pc. Unfortunately, the errors of exceed 0.4 dex for all galaxies except NGC 6946.
We applied the standard technique for studying an extension of hierarchical star formation (Efremov & Elmegreen, 1998; Grasha et al., 2017) to our data. Separation and age difference between all identified cluster pairs based on their coordinates and colour photometric ages were calculated. Our star clusters are randomly distributed in the galactic plane, thus the number of pairs with separation pc is too little to use statistical methods for galaxies NGC 3184 and NGC 5585. Therefore we analyse dependence for cluster pairs only in three galaxies: NGC 628, NGC 3726, and NGC 6946.
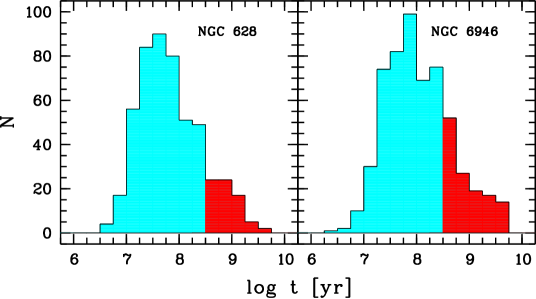
Fig. 10 shows the age distribution of star clusters in NGC 628 and NGC 6946. As seen from the histograms, star clusters are distributed by Gauss law with a little surplus of old clusters ( Gyr). We excluded star clusters older than 300 Myr (they are marked by red colour in Fig. 10) from the study of the dependence of cluster pairs, following Grasha et al. (2017). We do not show here the histogram for star clusters in NGC 3726, because of absence of clusters older than 300 Myr in the galaxy (see Fig. 9).
Obtained dependences for cluster pairs in NGC 628 and NGC 6946 resemble dependences between age difference and separation of cluster pairs found earlier in Efremov & Elmegreen (1998) and Grasha et al. (2017). We observe a growth of with increase in with slopes in NGC 628, in NGC 3726, and in NGC 6946 till the separations pc in the galaxies. These distributions reach a plateau at pc in the galaxies (Fig. 11).
The obtained slopes are in close agreement with those previously found by Grasha et al. (2017). We can compare relation for cluster pairs in NGC 628 as this galaxy is common for both our sample and the sample studied by Grasha et al. (2017). The result of Grasha et al. (2017): for pc is consistent within errors with our fitting (see the thick dashed line, black circles, error bars, and the solid thin line in the top panel of Fig. 11). This is an additional argument in support of our cluster age estimates via colour.
The range of spatial scales for the galaxies in Fig. 11 is larger compared to Fig. 9. This is due to the fact that graphs in Fig. 11 show separations between all star clusters located randomly in the disc, whereas graphs in Fig. 9 show separations of star clusters from H ii regions nearest to them. As a result, the spatial scale of cluster pairs in Fig. 11 corresponds to the spatial scale of a galactic disc, whereas the spatial scale of SC-HiiR pairs corresponds to maximal distances between star clusters and H ii regions nearest to them. This spatial scale corresponds to a typical size of a star complex.
Of course, our estimates of the dependency are only qualitative. They are intended to show an agreement between our estimates and the results of previous researchers (Efremov & Elmegreen, 1998; Grasha et al., 2017), if we use the classical technique to study the hierarchical star formation in turbulent media based on the study of the dependence for cluster pairs. Efremov & Elmegreen (1998) and Grasha et al. (2017) used cluster ages determined directly. Obviously, our ’photometric’ ages, calculated from the colour, are less reliable.
We did not identify close cluster pairs ( pc) in NGC 3726, the most distant galaxy in the sample. Thus, correlation parameters for it were obtained with large errors and are shown in the figure only for a qualitative comparison.
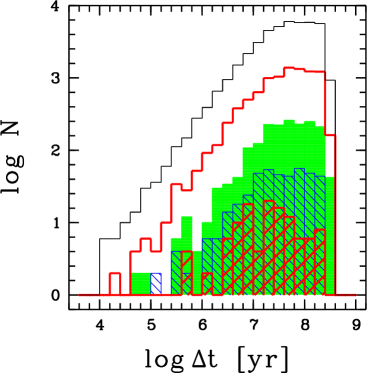
Our results show that the decrease of the mean age difference with the decrease of separation for close cluster pairs with pc is a real physical effect. Age difference distributions for cluster pairs within narrow ranges (0.2 dex), which are presented in Fig. 12, show similar shapes for pairs with . However, the distribution of close cluster pairs () differs significantly from them. A relative deficiency of cluster pairs with a large age difference is observed clearly for pairs with (the red shaded histogram in the figure).
On large spatial scales (), distributions of cluster pairs reach a maximum at and have a flat profile for the pairs with . Note that (Fig. 12). These facts indicate a significant proportion of cluster pairs with Myr, randomly and evenly distributed on spatial scales of a few hundred pc and more. On smaller scales ( pc), the existence of cluster pairs with large age difference is difficult. Starburst at pc scale has a duration of Myr (Efremov & Elmegreen, 1998), it destroys H2 cloud remnants. Star formation here becomes impossible for at least 100 Myr (ISM relaxation time).
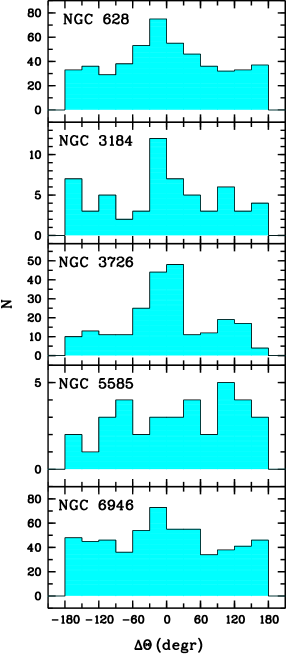
Stationary density wave theory predicts the existence of an age gradient across the spiral arms at least in grand-design galaxies (see survey in Dobbs & Baba, 2014). Observational studies show this gradient in some galaxies (see Shabani et al., 2018, and references therein). We checked if there is an age gradient across arms based on our data. For this purpose, we constructed angle distributions, where is the angle between the position angle of a star cluster and the position angle of the H ii region relative to this cluster (Fig. 13). If SC-HiiR pair is located strictly across a spiral arm, and H ii region is located in the outer part of the arm, is equal to the pitch angle of the spiral arm, typically .
Distributions of SC-HiiR pairs by in studied galaxies show a strong peak near in NGC 3184 and NGC 3726. Both galaxies have grand-design morphology. Weak peaks are observed in NGC 628 and NGC 6946. NGC 5585 does not have a preferred direction of SC-HiiR pairs across spiral arms. This is not surprising for peculiar NGC 5585. Our results support the result of Shabani et al. (2018), who did not find a noticeable age gradient across spiral arms in NGC 628. We identified star clusters from catalogue of Shabani et al. (2018) and compared the obtained ages for common objects. Estimates showed a good agreement between our ages, , and ages found in Shabani et al. (2018), : .
Notice that presence of large star complexes must smooth the effect of age gradient across spiral arms. Star formation begins in central, densest and coldest part of GMC, and it propagates toward outer parts. As a result, we must observe older star formation regions in the central part of a star complex. NGC 628 is just an example of a galaxy with numerous star complexes (Gusev & Efremov, 2013).
The direction of star formation propagation within star complexes are indirectly confirmed by the fact that the maximal distance where we observe the correlation between age of a star cluster and SC-HiiR separation is about 500 pc in all studied galaxies (Fig. 3). This is the typical radius of star complexes (Efremov & Elmegreen, 1998).
The calculated coefficients in equation (1) for the galaxies differ by order of magnitude. As we discussed in Section 3.1, they are very sensitive to observational errors and uncertainties in models. If the colour index is shifted by 0.1 mag, the constant in equation (1) will change by 0.2 dex. Additionally, there are physical reasons for the difference in the coefficient , which is responsible for the value of star formation propagation velocity , caused by difference in integral parameters of galaxies. As is known, in smaller galaxies the star formation length- and time-scales are generally shorter than in large galaxies (Elmegreen et al., 1996). We can only assume that velocities of star formation propagation are equal to a few km s-1 in order of magnitude. This does not contradict results obtained by previous researchers (see Grasha et al., 2017, for instance).
Slopes of the age-separation dependency, obtained in Section 3.1, vary with the range of separations and the galactic morphology. These variations reflect different contributions of different physical processes occurring in the interstellar medium (ISM). On spatial scales of 100-500 pc, slope approaches 0.5 in the galaxies with a regular structure. This result confirms conclusions of previous observational and theoretic studies (Efremov & Elmegreen, 1998; Grasha et al., 2017; Nomura & Kamaya, 2001) on the dominant role of turbulence in propagation of the star formation process on spatial scales up to 500 pc. On a smaller scale, pc, the slope in these galaxies is equal to . It indicates a significant contribution of other physical processes, such as stellar winds and supernova explosions, to propagation of the star formation process. The expansion of the H ii region (Strömgren sphere) satisfies the expression , where is time and is radius. Obtained expansion law may involve, along with turbulence, complications from stellar winds and probably supernovae, which the simple Strömgren formula does not (Elmegreen, 2019).
This complex mechanism seems to work in galaxies with an asymmetric structure at large spatial scales, up to 500 pc. The slope and it is systematically larger than in galaxies with a regular structure (see Table 2). This fact may indicate a smaller contribution of turbulence in the process of star formation propagation in the perturbed interstellar medium of these galaxies.
Observations of resolved stellar populations in nearest galaxies, such as LMC (Sun et al., 2018), allow as to explore in detail a hierarchical star formation and an influence of turbulence in galactic discs on a wide range of spatial scales. Parameters and correlations of young stellar structures in nearby galaxies (fractal dimension, size, density, and mass functions, selected scales of stellar structures) obtained by different authors are in a good agreement with each other. These parameters demonstrate properties which are similar to those of the ISM, which is regulated by supersonic turbulence. Some features are observed only in starburst dwarf galaxies (Elmegreen et al., 2014).
The method for studying the SC-HiiR pairs, presented in this paper, extends our ability to explore the process of hierarchical star formation in turbulent ISM to distant galaxies. The most interesting outcome, in our opinion, is the study of star formation propagation on scales of star associations ( pc), where different physical processes, along with turbulence, seem to play a significant role.
5 Conclusions
We developed a method for investigating the process of star formation propagation in the turbulent interstellar medium based on the study of the separation of young star clusters from the nearest H ii regions. We found a relation between the separation and the age ( colour index) of star clusters on spatial scales from 40 to 500 pc and on time scales from 10 to 300 Myr.
The average age of star clusters in the galaxies with symmetric morphology satisfies the relation in the separation range of 40-200 pc and in the range of 100-500 pc. The galaxies with the asymmetric structure show steeper dependence between the age and the separation with a power for separations from 40 to 500 pc.
Our results confirm the conclusions of previous studies on the dominant role of turbulence in propagation of the hierarchical star formation process on spatial scales from 200 to 500 pc in galaxies with symmetric structure. On spatial scales of pc in the galaxies with regular morphology, as in peculiar galaxies, other physical processes may contribute to the star formation propagation process along with turbulence.
The velocity of star formation propagation is nearly constant or falls weakly on the spatial scales of pc and it has typical values of a few km s-1.
Acknowledgments
We are extremely grateful to the anonymous referee for his/her constructive comments. The authors would like to thank Yu. N. Efremov, A. V. Zasov, O. K. Silchenko, O. V. Egorov, I. Yu. Katkov, S. B. Popov (SAI MSU), and B. G. Elmegreen (IBM Research Division, T. J. Watson Research Center) for helpful discussions. AG acknowledges the support from the Program of development of Lomonosov Moscow State University (Leading Scientific School ’Physics of stars, relativistic objects and galaxies’).
References
- Ali et al. (2017) Ali K., Obreschkow D., Fisher D.B., Glazebrook K., Damjanov I., Abraham R.G., Bassett R. 2017, ApJ, 845, id. 37
- Dale et al. (2009) Dale D. A. et al. 2009, ApJ, 703, 517
- de la Fuente Marcos & de la Fuente Marcos (2009) de la Fuente Marcos R., de la Fuente Marcos C. 2009, ApJ, 700, 436
- Dobbs & Baba (2014) Dobbs C., Baba J. 2014, Publ. Astr. Soc. Australia, 31, id. e035
- Efremov & Elmegreen (1998) Efremov Y. N., Elmegreen B. 1998, MNRAS, 299, 588
- Elmegreen (2002) Elmegreen B. G. 2002, ApJ, 564, 773
- Elmegreen (2006) Elmegreen B. G. 2006, in Del Toro Iniesta J. C., Alfaro E. J., Gorgas J. G., Salvador-Sole E., Butcher H., eds, The Many Scales in the Universe: JENAM 2004 Astrophysics Reviews. Springer, Dordrecht, p. 99
- Elmegreen (2010) Elmegreen B. G. 2010, in R. de Grijs & J. Lépine, eds, Proc. IAU Symp. 266, Star Clusters: Basic Galactic Building Blocks Throughout Time and Space. Cambridge Univ. Press, Cambridge, p. 3
- Elmegreen (2011) Elmegreen B. G. 2011, in Charbonnel C., Montmerle T., eds, in EAS Publications Series 51, Ecole Evry Schatzman 2010: Star Formation in the Local Universe. Cambridge Univ. Press, Cambridge, p. 31
- Elmegreen (2019) Elmegreen B. G. 2019, private commun.
- Elmegreen & Efremov (1996) Elmegreen B. G., Efremov Y. N. 1996, ApJ, 466, 802
- Elmegreen & Lada (1977) Elmegreen B. G., Lada C. J. 1977, ApJ, 214, 725
- Elmegreen et al. (1996) Elmegreen B. G, Elmegreen D. M., Salzer J., Mann H. 1996, ApJ, 467, 579
- Elmegreen et al. (2000) Elmegreen B. G., Efremov Y., Pudritz R. E., Zinnecker H. 2000, in Mannings V., Boss A. P., Russell S. S., eds, Protostars and Planets IV. Univ. of Arizona Press, Tucson, p. 179
- Elmegreen et al. (2014) Elmegreen D. M. et al. 2014, ApJL, 787, id. L15
- Fisher et al. (2017) Fisher D.B. et al. 2017, ApJL, 839, id. L5
- Fioc & Rocca-Volmerange (1997) Fioc M., Rocca-Volmerange B. 1997, A&A, 326, 950
- Grasha et al. (2015) Grasha K. et al. 2015, ApJ, 815, id. 93
- Grasha et al. (2017) Grasha K. et al. 2017, ApJ, 842, id. 25
- Grasha et al. (2019) Grasha K. et al. 2019, MNRAS, 483, 4707
- Gusev & Efremov (2013) Gusev A. S., Efremov Yu. N. 2013, MNRAS, 434, 313
- Gusev et al. (2015) Gusev A. S., Guslyakova S. A., Novikova A. P., Khramtsova M. S., Bruevich V. V., Ezhkova O. V. 2015, Astron. Rep., 59, 899
- Gusev et al. (2016) Gusev A. S. et al. 2016, MNRAS, 457, 3334
- Gusev et al. (2018) Gusev A. S., Shimanovskaya E. V., Shatsky N. I., Sakhibov F., Piskunov A. E., Kharchenko N. V. 2018, Open Astronomy, 27, 98
- James et al. (2004) James P. A. et al. 2004, A&A, 414, 23
- Kennicutt et al. (2008) Kennicutt R. C. Jr, Lee J. C., Funes J. G. J. S., Sakai S., Akiyama S. 2008, ApJS, 178, 247
- Knapen et al. (2004) Knapen J. H., Stedman S., Bramich D. M., Folkes S. L., Bradley T. R. 2004, A&A, 426, 1135
- Lada & Lada (2003) Lada C. J., Lada, E. A. 2003, ARA&A, 41, 57
- Larsen & Richtler (1999) Larsen S. S., Richtler T. 1999, A&A, 345, 59
- Larson (1981) Larson R. B. 1981, MNRAS, 194, 809
- Marigo et al. (2008) Marigo P., Girardi L., Bressan A., Groenewegen M. A. T., Silva L., Granato G. L. 2008, A&A, 482, 883
- Nomura & Kamaya (2001) Nomura H., Kamaya H. 2001, AJ, 121, 1024
- Paturel at al. (2003) Paturel G., Petit C., Prugniel Ph., Theureau G., Rousseau J., Brouty M., Dubois P., Cambresy L. 2003, A&A, 412, 45
- Piskunov at al. (2011) Piskunov A. E., Kharchenko N. V., Schilbach E., Röser S., Scholz R.-D., Zinnecker H. 2011, A&A, 525, 122
- Scalo (1985) Scalo J. M. 1985, in D. C. Black & M. S. Mathews, eds, Protostars and Planets II. Univ. Arizona Press, Tucson, p. 201
- Shabani et al. (2018) Shabani F. et al. 2018, MNRAS, 478, 3590
- Sun et al. (2018) Sun N.-C. et al. 2018, ApJ, 858, id. 31
- Whitmore et al. (2010) Whitmore B. C. et al. 2010, AJ, 140, 75
- Whitmore et al. (2011) Whitmore B. C. et al. 2011, ApJ, 729, 78