Dynamical Properties of Molecular-forming Gas Clumps in Galaxies at the Epoch of Reionization
Abstract
We study the properties of molecular-forming gas clumps (MGCs) at the epoch of reionization using cosmological zoom-in simulations. We identify MGCs in a prototypical galaxy (“Althæa”) using an H2 density-based clump finder. We compare their mass, size, velocity dispersion, gas surface density, and virial parameter () to observations. In Althæa, the typical MGC mass and size are and pc, which are comparable to those found in nearby spirals and starburst galaxies. MGCs are highly supersonic and supported by turbulence, with r.m.s velocity dispersions of 20 – 100 km s-1 and pressure of (i.e., with respect to the Milky Way), similar to those found in nearby and 2 gas-rich starburst galaxies. In addition, we perform stability analysis to understand the origin and dynamical properties of MGCs. We find that MGCs are globally stable in the main disk of Althæa. Densest regions where star formation is expected to take place in clouds and cores on even smaller scales instead have lower and Toomre- values. Detailed studies of the star-forming gas dynamics at the epoch of reionization thus require a spatial resolution of 40 pc ( 001), which is within reach with the Atacama Large (sub-)Millimeter Array and the Next Generation Very Large Array.
Subject headings:
methods: data analysis – galaxies: high-redshift – galaxies: ISM – galaxies: evolution – galaxies: formation – galaxies: starburst – stars: formation1. Introduction
The growth of galaxies and their subsequent evolution are governed by the baryon cycle—galaxies accrete gas from the intergalactic medium (IGM) either directly from the cosmic web, or through mergers with other galaxies. This gas fuels star formation and feeds central supermassive black holes. Subsequent feedback replenishes and enriches the circumgalactic medium by expelling some part of this material. Existing studies indicate that early galaxies are more gas-rich with molecular fractions higher than those of present-day galaxies (e.g., van de Voort et al. 2011; Decarli et al. 2016, 2017). Massive gas inflows from the IGM trigger gravitational instabilities that lead to the formation of dense gas clumps in which molecules form quickly (hereafter molecular-forming gas clumps111Note that by clumps, we refer to kiloparsec-scale gas concentrations in galaxies, rather than molecular gas concentrations small than molecular clouds and containing cores.; MGCs) that are typically more massive ( ) and extended ( sub-kpc) than those observed in nearby galaxies (e.g., Gabor & Bournaud 2013; Hopkins et al. 2014; Inoue et al. 2016). Some theoretical works argue that the migration of such giant massive clumps through disks is largely responsible for the buildup of the bulges of massive galaxies at redshift 0 (e.g., Ceverino et al. 2010).
Early galaxies have higher star formation rates (SFR; Behroozi et al. 2013; Sparre et al. 2015; Maiolino et al. 2015; Dunlop et al. 2017) and smaller sizes (e.g., Bouwens et al. 2011; Ono et al. 2013) compared to the local population (see also a review by Stark 2016). As a consequence, we expect them to be significantly more ionized, and have intense and hard interstellar radiation fields (ISRF). Since their metallicity and dust content are also expected to be lower in these early evolutionary stages, shielding of UV photons—responsible for the photoheating of the gas— is strongly reduced. Such differences in turn affect the regulation of the thermal and chemical state of the multi-phase interstellar medium (ISM).
Studying ISM properties of early galaxies is essential for understanding how star formation proceeds under more extreme conditions. Even in the local Universe, where detailed observations can be made, variations in molecular cloud properties have been observed between different galaxy populations (see e.g., Hughes et al. 2010, 2013). Given that high- galaxies statistically represent the early evolutionary stages of present-day galaxies, it is thus reasonable to pose the question: what are the physical properties of MGCs in early galaxies, and how do they differ from those found in local galaxy populations?
FIR fine-structure lines (e.g., [CII], [NII], and [OIII]), and CO and [C i] lines are key diagnostics for constraining the ISM conditions of galaxies. They also provide highly complementary information on different ISM phases (ionized, atomic, molecular; e.g., Scoville & Solomon 1974; Rubin 1985; Malhotra et al. 2001). Global measurements of these diagnostics in high- galaxies have provided preliminary information on their global properties (e.g., gas masses, gas temperature, and radiation field intensity). However, spatially resolving their ISM is necessary to fully understand many aspects of galaxy evolution and the physics behind their intense star formation (SFR 1003000 yr-1; see e.g., the review by Carilli & Walter 2013). To date, spatially resolved ISM properties of high- galaxies have only been mapped in a handful of galaxies at high redshift using tracers such as dust continuum, CO, and [CII] lines (e.g., Swinbank et al. 2011; Hodge et al. 2015; Ferkinhoff et al. 2015; Hodge et al. 2016; Leung et al. 2019). These studies find that galaxies close to the peak of cosmic star formation ( 2) are more molecular gas-rich, turbulent, and clumpy than nearby galaxies, although luminous compact blue galaxies may represent local analogs of these gas-rich, clumpy systems (Garland et al. 2015).
Earlier epochs still represent an essentially uncharted territory for ISM investigations. At present, it remains unclear how star formation proceeds in the (sub-) galaxy population at 6 which is responsible for producing the bulk of the UV photons that reionized the Universe. High resolution hydrodynamics simulations have been carried out to investigate the global properties, structures, and morphologies of galaxies out to the epoch of reionization (EoR) and their importance for providing the ionizing photons (see e.g., Ceverino et al. 2017; Katz et al. 2017; Ma et al. 2018; Trebitsch et al. 2018; Rosdahl et al. 2018). Compared to the zoom-in galaxies presented in these works, the simulation used here focuses on a Lyman-break galaxy (Pallottini et al. 2017b) from the serra simulation suite (see Pallottini et al. 2019 for a comparison between these zoom-in simulations). Most notably, we include a non-equilibrium thermo-chemical network to follow the formation of H2, which is crucial to examining the properties of MGCs.
While ALMA has enabled the detection of [CII] 158 and CO line emission in normal (SFR 100 yr-1) galaxies at 6 over the past few years (e.g., Carniani et al. 2018; D’Odorico et al. 2018), the first spatially resolved observations are just starting to become available (e.g., Jones et al. 2017). On the theoretical side, a schematic investigation by Behrendt et al. (2016a) revealed that kiloparsec-scale clumps likely consist of many smaller clouds formed by gravitational instability, a hierarchical structure that persists in an idealized disk model by Behrendt et al. (2019).
To understand the physical properties of MGCs in early galaxies, we have undertaken a detailed numerical study whose aim is to characterize the dynamical properties of the star-forming MGCs in prototypical (i.e., ) galaxies in the EoR.
The paper is structured as follows222Throughout this paper, we adopt a concordance cosmology, with total matter, vacuum and baryonic densities in units of the critical density = 0.692, = 0.308, = 0.0481, Hubble constant = 100 km s-1 Mpc-1 with = 0.678, spectral index = 0.967 and = 0.826 (Planck Collaboration et al. 2014).. We start by providing some physical background in §2. In §3, we describe the setup of our simulation and properties of our main galaxy (Althæa). In §4, we describe the method used to identify MGCs, and present the formalism within which we interpret the results. In §5, we present the results and characteristic properties of the MGCs. We then interpret the results and discuss the implications of our findings in §6, and give our conclusions in §7.
2. Physical Background
We begin by introducing some empirical relations commonly mentioned in observational studies of molecular clouds in the literature, as well as describing the gravitational instability of galactic disks, which might be driving MGC formation. These concepts will be used in the subsequent analysis of our simulations.
2.1. Larson’s Relations
Larson (1981) discussed a number of relations among Galactic molecular cloud properties, namely the linewidth-size, density-size, and mass-size relations. Larson relations are routinely used for comparing properties of molecular structures in different galactic environments. They also represent a useful framework to analyze our results as they have been argued to arise from the interplay between gravity and velocity dispersion given by virial theorem (note, however, the alternative interpretation involving gravitational collapse by e.g., Ballesteros-Paredes et al. 2011a).
The virial theorem for a distribution of unmagnetized gas can be written as (McKee & Zweibel 1992)
| (1) |
where is the second time derivative of the Lagrangian moment of inertia, is the internal energy of the gas (including thermal, turbulent, and bulk motions), is external pressure support, and is the gravitational energy. Let us specialize to the case of a spherical self-gravitating molecular cloud of mass , radius , and root-mean-square velocity dispersion , accounting for both thermal and turbulent contributions. Defining as the external pressure, Equation 1 can be written as
| (2) |
where is a geometrical factor that is equal to 3/5 for a uniform sphere; in Equation 2 the terms on the right-hand side represent the kinetic energy, external pressure, and gravitational potential energy terms.
Motivated by Larson’s linewidth-size relation (Larson 1981) and the work by Heyer et al. (2009), we assume equilibrium (i.e., ), define the cloud surface density as = , and rewrite the previous equation as
| (3) |
which further reduces to
| (4) |
if the external pressure . For this case (often referred to as simple virial equilibrium) from the balance between kinetic and gravity terms we can define the virial parameter as
| (5) |
Based on Equation 4, a one-to-one mapping between and is therefore expected for a virialized cloud, since . (Heyer et al. 2009) pointed out that the original size-linewidth relation implies constant surface density in this interpretation. The limited dynamic range in column density of CO observations appears to account for this (see also Ballesteros-Paredes et al. 2011a). Deviations from this relation are often attributed to a significant contribution from external pressure as per Equation 3 (see e.g., Heyer et al. 2009; Hughes et al. 2010, 2013; Meidt et al. 2013). Similar conclusions are also reached from the analysis of clouds forming in a Milky-Way like galaxy simulated with a resolution (i.e., Grisdale et al. 2018).
Summarizing, the virial parameter can be used to quantify the stability/boundedness of a molecular cloud. Accounting for the external pressure, a virial parameter of would be unstable (Bertoldi & McKee 1992). Such a criterion is often used in observations (see e.g., Kauffmann et al. 2017b).
In cases where a stellar component plays an important role in the dynamics, the virial parameter becomes
| (6) |
where is the stellar mass enclosed within the MGC volume.
2.2. Toomre Stability
The onset of gravitational instability is tightly connected to star formation (e.g., Kennicutt 1989; Martin & Kennicutt 2001; Wang & Silk 1994; Li et al. 2005, 2006). For axisymmetric modes, the dispersion relation for the growth of density perturbations in a rotating, turbulent disk of finite thickness is described by
| (7) |
where is the wavenumber and is the epicyclic frequency, defined as:
| (8) |
(Romeo 1992), where is the galactic radius. In Equation 7 the terms on the right hand side are related to rotation, self-gravity and internal pressure, respectively. Heuristically, the instability can be understood by considering the scale at which gravitational potential overcomes the internal energy. Gravity dominates at scales , where is the Jeans length. However, differential rotation in disk galaxies can stabilize perturbations that might otherwise collapse for , where is set by . As a result, disks are unstable to gravitational collapse on scales between .
From the dispersion relation, a parameter can be derived such that when instability occurs, that reproduces this inequality to order unity. For a collisionless fluid—such as an ensemble of stars— this parameter is (Toomre 1964)
| (9) |
The equivalent parameter for a collisional gas was derived by Goldreich & Lynden-Bell (1965)
| (10) |
In the thin disk approximation (), instability occurs on scales such that (or equivalently in Equation 7). A frequently used observable proxy for is the ratio of disk circular velocity to root-mean-square velocity dispersion (e.g., García-Burillo et al. 2003; Genzel et al. 2011; Kassin et al. 2012; Leung et al. 2019).
In our stability analysis, we account for the combined effect of gas and stars (derived exactly by Rafikov 2001), and for the non-negligible disk thickness. This is done by adopting an approximation for an effective two-component parameter (i.e., Romeo & Wiegert 2011; Romeo & Falstad 2013, see also Inoue et al. 2016). The effect of disk thickness modifies the parameter for gas and stars by accounting for the vertical velocity dispersion
| (11) |
and
| (12) |
with indicating either gas or stars. The combined effect of gas and stars can then be accounted for by writing
| (13) |
where the relative weight is defined as
| (14) |
Conceptually, the finite disk thickness reduces the gravity in the vertical direction, thereby making it easier for a system to maintain stability, and thus lowering the critical Toomre from 1 to 0.67 (Goldreich & Lynden-Bell 1965). On the other hand, including the contribution of the stellar component promotes gravitational instability, and thus increases , more-so if the stars have low velocity dispersion. As a rule of thumb, for = .
3. Numerical Simulations
The simulations used in this work are described by Pallottini et al. (2017b, a) and are briefly summarized here. Serra333Greenhouse in Italian. is a suite of cosmological zoom-in simulations performed using Eulerian hydrodynamics and adaptive mesh refinement (AMR) techniques to achieve high spatial resolution in regions of interest (e.g., regions of high density). In particular, it uses a modified version of ramses (Teyssier 2002) as the AMR backend. The simulation used here covers a comoving box of 20 Mpc -1 in size. The simulation zooms in on a target halo of mass at = 6. The Lagrangian region of the halo (2.1 Mpc -1) has a dark matter mass resolution of , equivalent at initial density to a baryonic mass resolution of . This region is spatially refined with a quasi-Lagrangian criterion based on a mass threshold, so that a cell is refined if its total (dark+baryonic) mass exceeds the mass resolution by a factor of eight. The finest refined cell allowed in the zoom in region has size 30 pc (at ), i.e., sizes are comparable to the sizes of local giant molecular clouds (e.g., Sanders et al. 1985; Federrath & Klessen 2013; Goodman et al. 2014),
The models include a non-equilibrium chemical network (Krome) following e-, H+, H-, He, He+, He++, H2, and H (Grassi et al. 2014; Bovino et al. 2016). Of particular importance here is that the abundances are calculated using an on-the-fly non-equilibrium formation of molecular hydrogen scheme described by Pallottini et al. (2017b). In the simulation, the UV radiation field is assumed to be uniform spatially. Self-shielding of H2 from photo-dissociation is accounted for using the Richings et al. (2014) prescription, while the formation rate on dust grain is computed following Jura (1975). Photo-dissociation via Lyman-Werner photons is included as part of the Krome network. We do not assume a clumping factor in the chemistry solver (i.e., = 1, cf. Lupi & Bovino 2020). In the simulation, star formation follows an H2-based Schmidt-Kennicutt relation.
Star formation is modeled using an H2-based prescription of the Schmidt-Kennicutt relation (Krumholz et al. 2009). We adopt stellar tracks from starburst99 and include stellar feedback from supernovae (SNe) as well as winds from OB and asymptotic giant branch stars. Coupling to the gas is implemented via a sub-grid model for blastwaves, which accounts for radiative energy losses inside the cell. The remaining energy is injected into the ISM in both thermal and non-thermal form (Agertz et al. 2013); the latter is a term that mimics unresolved turbulence. The non-thermal energy is not affected by radiative cooling but rather is dissipated on the eddy turn-over time scale (Mac Low 1999). See Pallottini et al. (2017a) for further details. Radiation pressure on dust and gas is also included. Photoionization from local sources is neglected in this simulation (see Pallottini et al. 2019; Decataldo et al. 2019, for its effect).
The simulation zooms in on a galaxy named after the flower Althæa, whose properties are given in Pallottini et al. (2017b) and are briefly summarized in the following. Althæa is a Lyman-break galaxy that at is hosted by a dark matter halo of mass = 3.5 1011 at the center of a cosmic web knot, and accretes mass from the IGM mainly via three filaments of length 100 kpc. Althæa has a stellar mass of 2.6 , a metallicity of 0.5 , a molecular gas mass of 5 , and a SFR of 30 – 80 yr-1. The specific SFR of Althæa is 4–40 Gyr-1, compatible with the sSFR vs. relation observed at high redshift (Jiang et al. 2016). The effective stellar radius of Althæa is 0.5 kpc and the dark matter virial radius is 15 kpc. The stellar-to-halo mass ratio of Althæa is 0.07. This is a factor of about three higher than the typical value inferred by abundance matching models, which typically give values of . But studies show that this ratio varies as the halo mass becomes much larger or smaller than from 1012 (see Moster et al. 2013; Behroozi et al. 2013; Behroozi & Silk 2015; Moster et al. 2018)444 This ratio from abundance matching can vary; for instance, Behroozi et al. (2013) (main method) finds a ratio of 0.015 – 0.025 for a halo mass between 1010.5– , whereas in the same paper the authors find 0.01–0.05 in the same mass range from direct abundance matching (see the Appendix therein). As another example, from an earlier abundance matching study, Moster et al. (2013) find a ratio 0.005, also differing by a factor three from Behroozi et al. (2013), though in opposite direction.. The ratio of Althæa is higher than e.g., Katz et al. (2017) and Ceverino et al. (2017) which could be a result of different feedback implementation.
3.1. Star Formation History
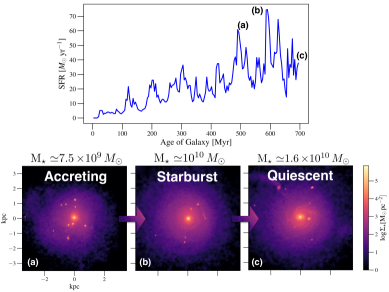
One of the main advantages of studying galaxies in simulations is that we can examine how their dynamical properties evolve with time, which is interesting in order to understand the physical processes that determine the morphology and dynamical properties of galaxies, which in turn affect their star formation. This is advantageous especially at early cosmic epochs, when the densest structures are beginning to form; gas is constantly being accreted onto the central galaxy from the cosmic web and satellite galaxies, thereby leading to bursts of star formation. Meanwhile, tidal forces resulting from interactions with these surrounding galaxies can disrupt the main disk and arms, likely leading to different dynamical states for the molecular structures compared to more evolved galaxies found at a later cosmic time (e.g., some molecular structures may disperse while others may agglomerate into more massive ones). The star formation history555Note that here the SFR is calculated based on the stellar mass formed in the last 4 Myr within 3.5 kpc from the galaxy center of mass. The SFR plotted in Figure 2 of Pallottini et al. (2017a) is a factor of two higher since there the SFR accounts for the contribution from massive satellite galaxies within the virial radius (15 kpc). of Althæa is shown in Figure 1. The SFR of Althæa varies between 30–80 yr-1 as it evolves from an actively accreting phase to a starburst phase after a merger, and then back to a relatively quiescent phase, over the simulated Myr.
In §5.1, we show the importance of rotation support from large-scale motions in the MGC dynamics by comparing their properties in the disturbed phase of Althæa and in the disk-like ordered phase. Given the stochastic nature of Althæa in its star formation history, we mostly focus on few of its most extreme evolutionary stages in this work (see §5.2). These phases correspond to (a) an intensely accreting phase and (b) a starburst phase (Figure 1). We are interested in determining whether MGC properties are sensitive to these different dynamical conditions. For completeness, we also show relationships of MGC properties examined for other evolutionary stages traced in the simulation (see §5.3).
4. Molecular-forming Gas Clumps
4.1. Identification
To identify the molecular complexes, we use a customized version of the clump-finding algorithm available in the python package yt (Turk et al. 2011), which was initially described in Smith et al. (2009) and modified since. The latest version of the default yt clump finder decomposes the zones of the simulation into non-overlapping tiles, which are stored in a three-dimensional tree that can be processed using -dimensional tree algorithms. It then identifies the contours of a variable field (here, the density field) within a tile and connects them across the tiles. In the customized version used for this study, we enhanced the stability of the code. Due to the nature of our AMR simulation, we regrid the simulation data into uniform grids. The grid size is defined based on the highest resolution of the simulation data, i.e., the less refined regions are supersampled in the resulting uniform grids.
In the clump-finding process (in position-position-position space; PPP), we employ a set of different density thresholds defined based on the molecular hydrogen density of Althæa at different evolutionary stages (–7.2). We note that this process is the three-dimensional analog to identifying molecular structures based on the noise levels in position-position-velocity (PPV) maps that observers obtain with telescopes, using molecular line tracers such as CO, CS, and HCN. This is commonly done by identifying clumps based on/after applying S/N-clipping, using tools such as the aips tasks serch, clumpfind, and cprops; (e.g., Williams et al. 1994; Oka et al. 2001; Rosolowsky & Leroy 2006; Rosolowsky et al. 2008; Donovan Meyer et al. 2013)). Existing studies find a good correspondence in the dynamical properties extracted in PPV- versus PPP-space for well-isolated structures (Ballesteros-Paredes & Mac Low 2002a; Heitsch et al. 2009; Shetty et al. 2010; Beaumont et al. 2013; Pan et al. 2015, but see Ballesteros-Paredes & Mac Low 2002a and Shetty et al. 2010 for a discussion on caveats and limitations).
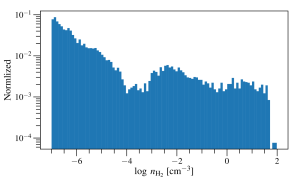
In Figure 2, we show the distribution of H2 number density for Althæa during its accreting phase, including the contribution from the gas within 3.5 kpc from the galaxy center. We note that the distribution is almost flat for and it samples the range of densities where clumps are found based on morphological analysis666For , the fourth Minkowski functional of the H2 density field is significantly larger than zero. This implies that the field is made of isolated components. See Fig. 6 in Pallottini et al. (2017a). (Pallottini et al. 2017a). In each evolutionary stage, we identify MGCs by applying density cuts to the H2 density distribution, i.e., MGCs are selected at . We select 10 equally-spaced cuts in H2 density in log scale: . Note that with these choices we are including MGCs that are not fully molecular ().
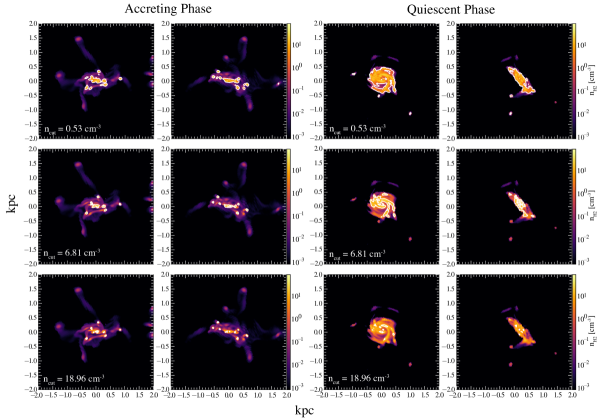
To visually display the clump finding procedure, we overplot the molecular structures identified using a subset of the H2 density cuts ( = 0.53, 5.81, and 18.96 ) on the H2 density maps (Figure 3). Since the molecular structures are identified in the 3D H2 density field, they can appear as overlapping structures depending on the viewing angle; thus we also plot them in different projections so that the identification can be more easily appreciated. We repeat this identification process for 14 evolutionary stages between redshift [6.0, 7.2], spaced by = 15 Myr.
We impose the additional constraint that an identified structure must be composed of at least 10 cells. We caution that an important caveat of such a constraint is that we can only examine the parameter space of cloud complexes of radius pc, because of the resolution limit of the simulation.
4.2. MGC Properties
Upon identifying the molecular structures, we extract properties such as the gas mass , effective size , Mach number , velocity dispersion , and gas surface density to examine their dynamics.
The mass of an MGC is calculated from the uniformly-gridded 3D density field, integrating over the MGC volume . The effective size is defined assuming spherical geometry, i.e., . The full velocity dispersion of MGCs is calculated from the bulk velocity field (), thermal sound speed (), and the non-thermal velocity dispersion ()
| (15) |
In observations of MGCs, the linewidth contribution of dense gas exceeds that from the diffuse gas. Therefore, when calculating the global quantities of MGCs, we always perform a mass-weighting. Since we operate on data on a uni-grid, this is equivalent to density averaged quantities. In general, for the quantity in a MGC we write
| (16) |
where the sum is done for the cells indexed by composing the MGC. We use the definition Equation 16 to write each term of the right-hand side of Equation 15 as follows. The bulk velocity dispersion is
| (17) |
where Equation 16 is applied to each velocity component. The thermal sound speed is calculated from the thermal pressure () through
| (18) |
where the pressure is in units of K , is the Boltzmann constant, is the mass of a proton. Similarly, contribution from non-thermal energy is calculated from non-thermal pressure () as follows
| (19) |
Finally, the Mach number is related to the pressure terms as follows
| (20) |
5. Results
5.1. MGC Basic Properties
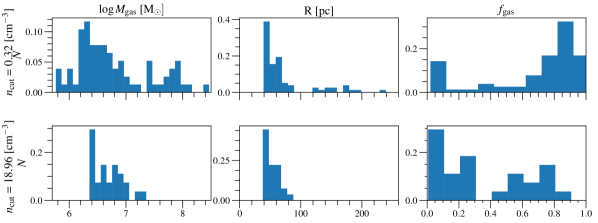
We start by considering the distributions of MGC total gas mass , radius , and gas mass fraction
| (21) |
We show in Figure 4 the distributions from the combination of the three considered evolution stages. We show results for a low density cut of = 0.32 (top panels) and a high cut777The highest density threshold we used of = 31.62 corresponds to a minimum MGC mass of the order of 105.5 for the densest structure. However, not all evolutionary stages considered have at least one MGC at this highest density threshold, so we consider MGCs identified with the second highest density threshold instead. of = 18.96 (lower panels). Overall, the mass of all MGCs identified ranges from 105.5-8.5 , whereas the gas fraction ranges from 0.1 – 1.
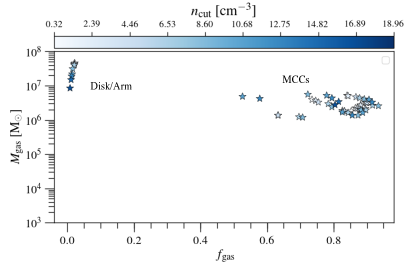
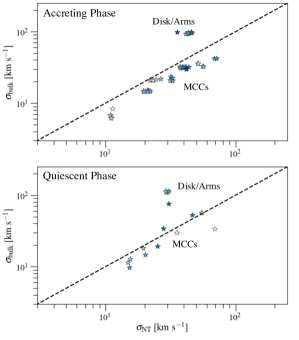
The most massive structures (107 ) correspond to the molecular disk of the galaxy (see e.g., Figure 3), which is identified as a single component at low . This main disk component occupies the top left corner of Figure 5, with a low gas mass fraction of . The velocity dispersion of such a structure is dominated by the bulk motion term888The bulk velocity dispersion term is likely associated with the rotational velocity, see Kohandel et al. (2019) for kinematical analysis of Althæa., as shown in Figure 6, where we compare the velocity dispersions of MGCs resulting from bulk () versus non-thermal turbulent motions () in the accreting and quiescent phases of Althæa. The accreting phase of Althæa displays a disturbed morphology, whereas the quiescent phase displays a disk-like morphology (Figure 3). Excluding the structure corresponding to the molecular disk, the velocity dispersions of most MGCs in the accreting phase of Althæa are dominated by turbulent motions, while in the quiescent disk-like phase, is at least comparable to for almost half the MGCs. For these reasons, the most massive MGCs are excluded in the discussion of the dynamics (§6), as they are dominated by large-scale shear; however, we include them in the scaling relation plots (Figure 7 and Figure 8), as would be done for an observational study.
Considering only the MGCs identified at the highest density threshold, the mass of MGCs is . We note that similarly massive molecular structures (few times 107 999See §3.1 of Behrendt et al. (2016b).) have been reported in idealized closed-box isolated galaxy simulations done at higher resolution (e.g., a maximum resolution of 3 pc in the 48 kpc box studied by Behrendt et al. 2016b). However, the stellar feedback, IGM, merger and accretion histories are not properly modeled in such simulations, e.g. see Grisdale et al. (2017, 2019) for the importance of feedback in shaping the properties of clouds forming in local simulated galaxies. That said, the similar mass range found in MGCs of Althæa is reassuring — our results are not far off in spite of the limited resolution ( 30 pc).
The local sound speed of all MGCs identified is typically much smaller than their non-thermal (turbulent) velocities, as non-thermal pressure dominates thermal pressure for dense gas (Pallottini et al. 2017a), i.e., . In particular, the average Mach number for MGCs identified at the highest density threshold is . This is consistent with the analysis done in Vallini et al. (2018), that finds a global Mach number of for Althæa.
5.2. Single Evolutionary Stage
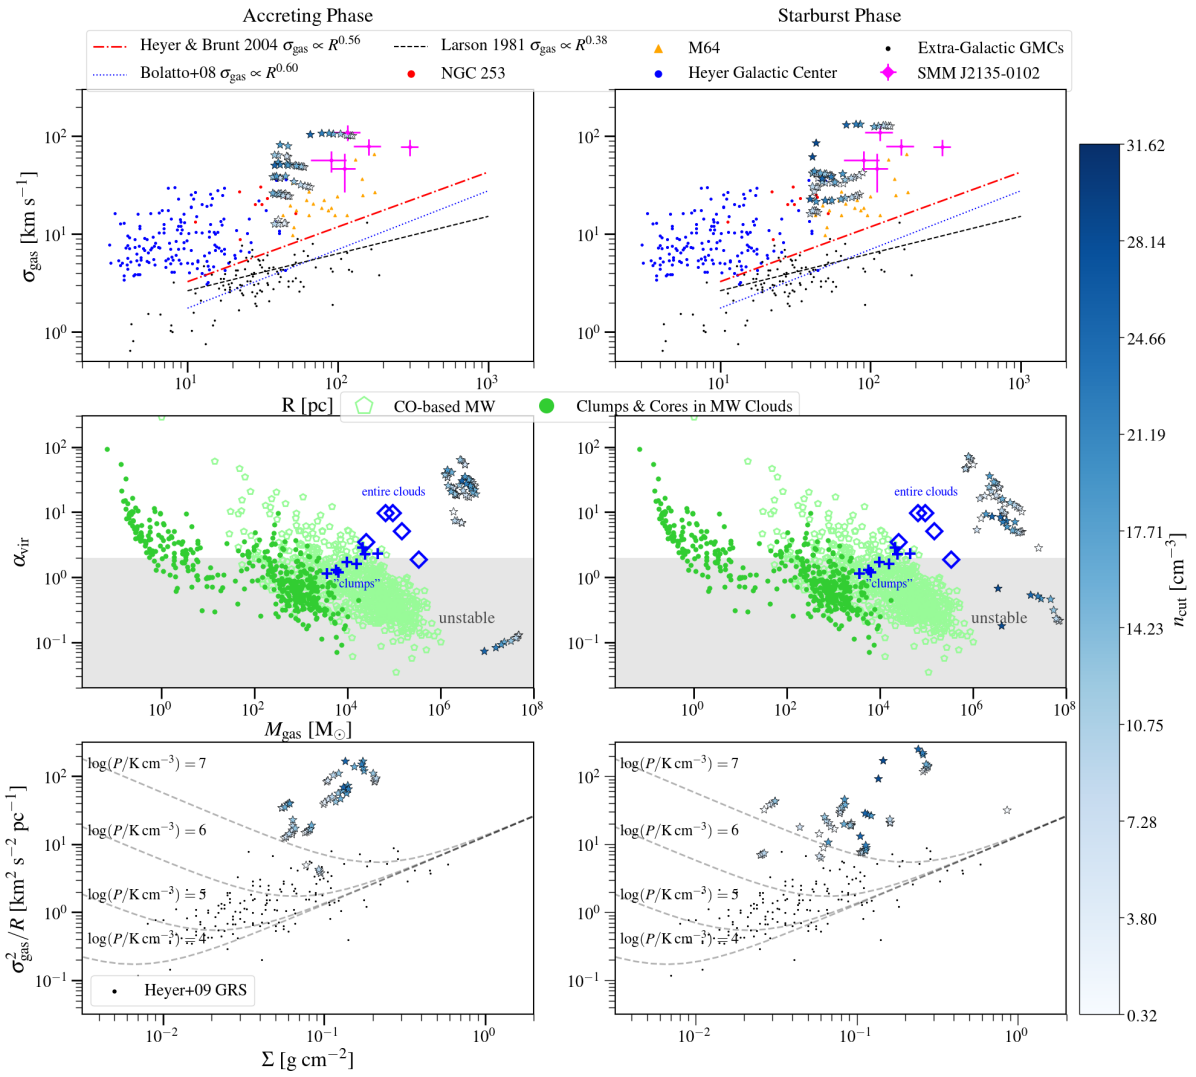
Here, we focus on the MGC properties in the two most extreme evolutionary stages of Althæa — the accreting and starburst phases (see §3.1). These properties are plotted in Figure 7 together with observational results of nearby and 2 molecular structures for comparison.
During the accreting phase, MGCs in Althæa are characterized by large velocity dispersions () and sizes ( pc). These values are comparable to those found in starburst galaxies, such as the nearby gas-rich galaxy M64 and the 2 starbursting disk galaxy SMM J2135-0102 (Rosolowsky & Blitz 2005; Swinbank et al. 2011), but are higher than those found in the Milky Way and extragalactic GMCs by an order of magnitude (Heyer & Brunt 2004; Bolatto et al. 2008).
While the virial parameter defined as Equation 5 is typically used in observational studies, as they are designed to probe structures that are composed of mainly molecular gas only, we calculate the virial parameter of MGCs including the influence from the stellar component (i.e., via Equation 6) given the high stellar-to-gas mass ratios of some molecular structures identified (see Figure 5). The biggest MGC identified at low and with the highest stellar-to-gas mass ratio ( 1; Figure 5) corresponds to the central main disk of Althæa (see top panels of Figure 3 and §4.2). The large amount of stellar mass already assembled in Althæa explains the low total virial parameter seen in the middle left panel of Figure 7, where the stellar gravitational potential influences the overall stability. On the other hand, the MGCs in this phase are mostly stable101010We check that the gas-only virial parameter of MGCs is comparable to the total virial parameter., with virial parameter within the range observed in the molecular structures of the Milky Way but higher than its average value, though the MGCs are more massive. The higher than typical MW value is linked to the higher turbulence of these systems.
Motivated by observational studies, we also plot the ratio and gas surface density of MGCs in the accreting phase of Althæa in the bottom left panels of Figure 7. In the same plot, we show those observed in the Galactic Ring Survey (GRS) of the Milky Way (Heyer et al. 2009) for comparison. Dashed lines in the figure show the loci along which the annotated external pressures are needed for any molecular clouds in equilibrium to have certain linewidths for a given set of surface densities (see §2.1). At a given gas surface density, MGCs display a range of . Such variation in is observed in GMCs in the central and outer part of the Milky Way (Oka et al. 2001; Heyer et al. 2009).
If constant column density (Larson’s third relation) were truly a fundamental property of molecular clouds, and if virial equilibrium were a universal property of molecular clouds with negligible surface pressure, one would expect a single point in the – relation at that mass surface density . The variation in with seen here suggests that column density is not a fundamental property of molecular clouds in agreement with Heyer et al. (2009). Previous studies suggest that the observed mass-size relation of molecular clouds is solely a result of and may be an artifact of the limited range of column densities a specific molecular line tracer is sensitive to (see e.g., Ballesteros-Paredes & Mac Low 2002b; Ballesteros-Paredes et al. 2011b).
In the starburst phase, MGCs have velocity dispersion and sizes similar to those in the accreting phase; however, MGCs in the starburst phase span a wider range in gas surface density (bottom panels of Figure 7) and have lower virial parameters. That is, MGCs in the starburst phase are more susceptible to collapse, as expected. The gas surface density of MGCs in both accreting and starburst phases is higher than that in the solar neighborhood of the Milky Way and the Large Magellanic Cloud (LMC), but comparable to those observed in starburst galaxies and the nearby ultra-luminous IR galaxies (ULIRGS; Boulares & Cox 1990; Scoville et al. 1991; Weiß et al. 2001; Hughes et al. 2010; Leroy et al. 2015).
5.3. Adopted Density Threshold Dependence
As seen in §5.1, the cuts used to identify the molecular structures are based on the H2 number density, which ranges from nH2 0.1 – 30 . We do not explicitly use a minimum H2 fraction to select the structures. Among the various cuts, two physical regimes are identified, corresponding to materials in the disk/interarm material and MGCs (see Figure 5). The former have n and n , whereas the latter have ngas and n (see also Figs. 5 and 6 of Pallottini et al. (2017a) for details111111In particular, their analysis of the Minkowski function of the molecular density field (see Fig. 6 therein)). Considering that = = = 2 , for the disk/interarm region 14%, while for the MGCs 28%. Note that for the lowest value of the H2 cuts, these fractions might be lower; however, removing regions selected with such cuts yields no qualitative change to the physical interpretation resulting from the analysis.
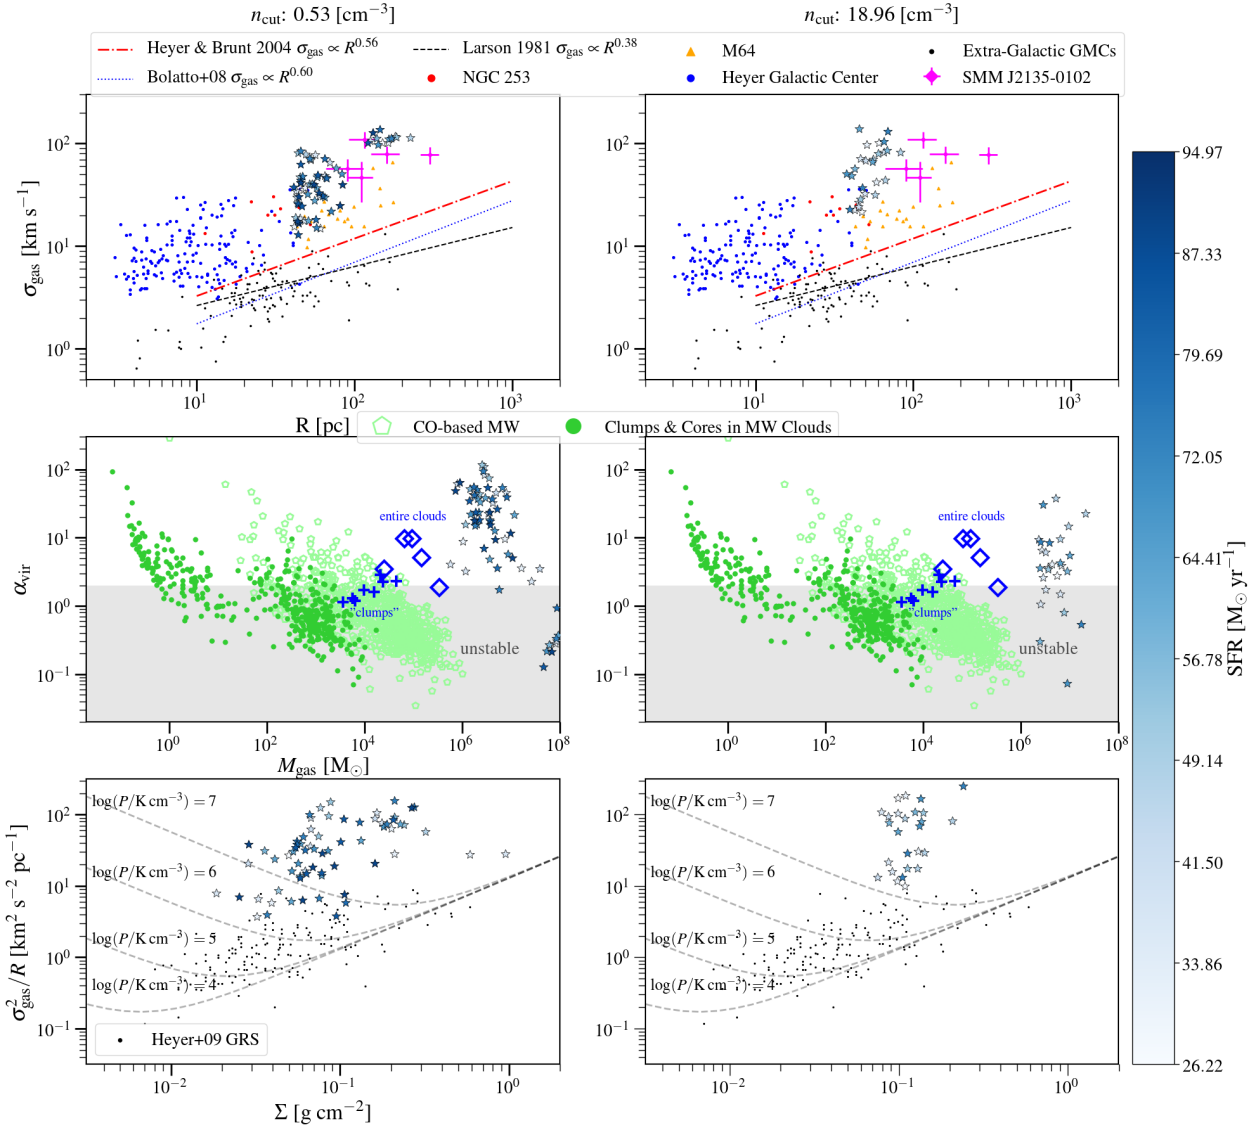
We investigate possible variations in the dynamics of the molecular structures of Althæa by adopting different values of to test the robustness of our results against the choice of density threshold. That is, how sensitively are the structure properties, and thus, the results presented in §5.2, dependent on the choice of density thresholds? Observationally, this effect would be mimicked by e.g., adopting different molecular gas tracers since they have different critical densities.
The sizes of MGCs are dependent on the choice of in the following ways. As mentioned in §5.1, the most massive cloud identified at low H2 gas density thresholds corresponds to the molecular disk of Althæa, which is broken down into multiple smaller MGCs at higher 121212That said, there are fewer MGCs at highest than the lowest since there are fewer cells in the simulations with correspondingly high H2 gas densities.. Second, excluding such structure, some MGCs are further broken down into smaller MGCs at higher (see top panels of Figure 8). At the resolution limit of our simulation, most MGCs studied in this work have 50 pc (see also Figure 4). The gas velocity dispersion of MGCs, on the other hand, is rather insensitive to the actual value of . This lack of variation is reassuring: our inference on the velocity dispersion of 6 MGCs in relation to those observed in nearby and 2 galaxies is not biased by our choice of in this work.
At the highest density cut, only the densest gas structures are identified131313In the simulation, the densest molecular regions reaches gas density of 103 , which is comparable to the critical density of low- CO lines (see e.g., Vallini et al. 2018); however, we emphasize that we do not resolve the internal structure of molecular clouds at the resolution of the simulation.. The virial parameter of these MGCs are, on average, lower than those identified at low , and are thus, more unstable against collapse (see middle right panel of Figure 8).
6. Discussion
6.1. Synthetic vs Observed MGC Properties
In this section, we compare the observable quantities of MGCs obtained from the simulations (e.g., , , , ) with those of molecular gas structures from observations at lower redshift.
The velocity dispersion of MGCs in Althæa is similar to those observed in 2 spatially resolved studies of gas-rich star-forming galaxies, spanning a range of 2080 km s-1 (Figure 7; see e.g., Swinbank et al. 2011). However, the sizes of MGCs are almost a factor of two smaller. This suggests that the sizes of high- molecular gas structures reported in the literature are probably limited by the spatial resolution. The velocity dispersions of some MGCs are also comparable to the most turbulent gas clouds observed in the inner Milky way and nearby gas-rich galaxies (e.g., M64; Oka et al. 2001; Rosolowsky & Blitz 2005; Heyer et al. 2009; Leroy et al. 2015), which lie along the locus of . Such high velocity dispersion in Althæa is dominated by non-thermal energy (Figure 6) and results from the injection of kinetic energy from recent star formation as Althæa is assembling its stellar mass (given the high Mach numbers of MGCs; §4.2). In fact, by the accreting stage (see Figure 1a) at 7.2, Althæa has assembled a stellar mass of = 7.5 . This contrasts with Krumholz et al. (2018), who show that numerical models and analytic arguments point to feedback generally not being able to produce velocity dispersions of more than 10–20 km s-1, with higher velocities likely being produced by Toomre instability driven radial inflow.
The total pressure141414Non-thermal pressure dominates the total pressure in these high density regions. of MGCs identified at the highest ranges from K cm-3, with a median of K cm-3. Such high pressures are comparable to those observed in local ULIRGs; however, the molecular clouds in these local galaxies are concentrated within their central regions (Downes & Solomon 1998; Sakamoto et al. 2008). In our simulated galaxy, the high pressure MGCs are found throughout the disk. This difference likely stems from the different physical mechanisms giving rise to the highly turbulent nature of these molecular structures. While MGCs in both local ULIRGs and Althæa may form via gravitational instability (see e.g., McKee & Ostriker 2007), MGCs in the local merger-driven ULIRGs are likely formed by shock compression and cloud-cloud collisions that funnel large amounts of gas from the progenitor galaxies towards the central region (Tan 2000; Wu et al. 2018; see §6.2 for Toomre- analysis on Althæa). As shown by Kohandel et al. (2019) and Gallerani et al. (2018), the highly turbulent nature seen in the MGCs of Althæa result from extra-planar flows and higher velocity accretion/SN-driven outflows. The presence of extra-planar flows may also be the dominant mode for forming the highly supersonic massive MGCs observed in gas-rich star-forming galaxies at 2. For instance, Swinbank et al. (2011) report ISM pressure of 107 K and molecular gas mass of in the star-forming regions of a gas-rich starburst galaxy at = 2.3 based on spatially resolved CO line observations.
We do not find any major quantitative differences (see Figure 7) in the MGCs of Althæa with respect to those observed in the nearby Universe between its accreting and starburst phase, which are separated by 300 Myr. However, MGCs in the starburst phase have lower compared to the accreting phase. This is expected for star formation to proceed.
6.2. Toomre Parameter and Stability of MGCs
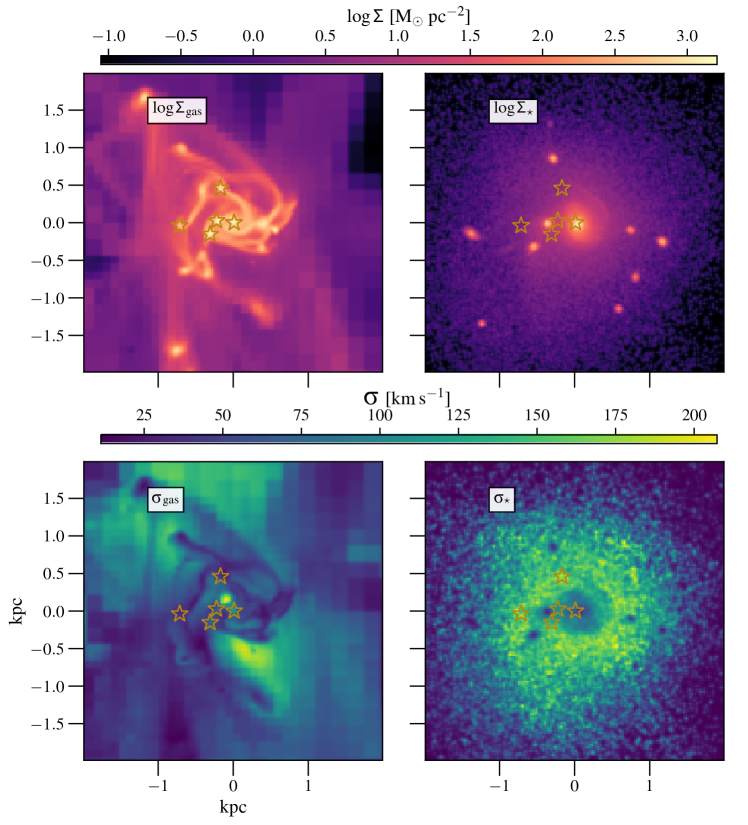
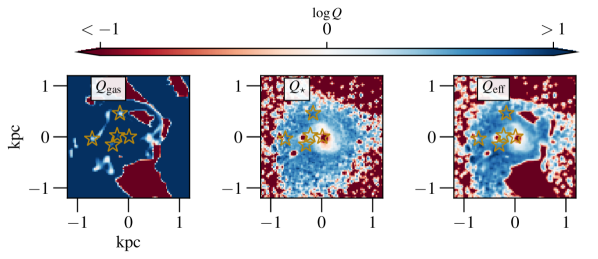
We define Toomre parameters for the gas, stars, and the effective two-component in §2.2. Maps of the corresponding Toomre are shown in Figure 10 (see also Figure 2 for example of MGCs identified in this evolutionary stage of Althæa using different ).
Close resemblance of the and maps indicates that contributions from the stellar component play an important role in governing the stability of the MGCs against perturbations. This can be understood since stars in Althæa dominate the central part of the galaxy in mass, so their gravitational potential provides a non-negligible contribution to the instability. Similarly, contribution from the thickness of the disk is important in Althæa since its disk is warped and has a scale height-to-radius ratio of 150 pc/1 kpc 0.15. That is, some MGCs are found in regions of 1, which is consistent with the expectation that they correspond to regions of high surface densities that are gravitationally unstable. Note, however, that when including the stabilizing effects due to the stellar potential of Althæa and the thickness of its disk (via , i.e., ; see Equation 13), some of these MGCs are consistent with . This demonstrates the importance of accounting for stellar contribution and disk thickness when examining the stability of molecular gas structures. This consideration is especially relevant for the relatively evolved and enriched systems at high redshift that are preferentially being imaged at high resolution with ALMA. In the outer regions of Althæa, on the other hand, resembles , with both and . Notably, these are the more gas-rich regions (see Figure 9).
The large virial parameters ( 2) seen in some MGCs of Althæa can be understood by first noting that fragmentation can happen in regions of low (if we only consider instability against axisymmetric perturbations), but further evolution and gas collapse depends on the equation of state of the gas. Such fragmentation is expected to take place at the critical scale length . Second, this fragmentation scale is greater than the typical size of GMCs. This could be interpreted as a result of instability setting the scales for fragmentation, but the truly star-forming regions correspond to the collapsing, denser, and cooler molecular structures that are on smaller scales. Thus, the high virial parameter found for some MGCs in Althæa indicates that they are not the collapsing structures and are found in regions of . On the other hand, MGCs in (the denser) regions with a lower Toomre parameter are more unstable, and star formation may take place within its star-forming clumps and cores on smaller scales, where energy quickly dissipates.
7. Summary and Conclusions
Properties of the star-forming ISM of galaxies near the Epoch of Reionization are now within reach with ALMA. While it is possible to obtain sensitive and high fidelity imaging that reveals their gas and dust morphology on sub-kpc scales and even smaller, such observations remain challenging; logistically, data from multiple cycles pushing to increasing resolution and sensitivity are needed. As such, observational studies of MGCs on such scales are still missing in the literature. In this work, we aim to understand the origin and dynamical properties of MGCs in prototypical galaxies at the EoR in numerical simulations to provide a framework within which upcoming observations can be compared against to aid in the interpretation.
We study the dynamics of MGCs and their temporal evolution in Althæa, a 6 prototypical galaxy obtained from the state-of-the-art cosmological zoom-in simulations Serra, which include a chemical network to determine the formation of molecular hydrogen, heating and cooling of the ISM by UV radiation and metal lines, and detailed stellar feedback. We use a three-dimensional clump-finding algorithm to identify MGCs. We decompose the molecular structures into non-overlapping objects by using a set of H2 density contours () at multiple evolutionary stages, in particular focusing on the accreting phase, starburst phase, and quiescent phase. We extract properties such as mass, size, Mach number, velocity dispersion, gas surface density, and virial parameter () for each MGC and perform a Toomre- stability analysis on Althæa.
Excluding the main structure (disk of Althæa) identified, the typical mass and size of MGC is and pc, respectively. Similarly massive molecular structures have been observed in nearby star-forming and starburst galaxies (e.g., Keto et al. 2005; Donovan Meyer et al. 2013; Colombo et al. 2014; Leroy et al. 2015), and reported in idealized (no stellar feedback) isolated (no cosmological initial conditions) galaxy simulations done at higher resolution (e.g., pc in the 48 kpc box studied by Behrendt et al. 2016b). That said, the similar mass range found in MGCs of Althæa is reassuring — our results are not far off despite the resolution limit ( 30 pc). On the other hand, the gas velocity dispersion of 20-10 km s-1 is rather insensitive to the adopted density threshold.
Velocity dispersion and gas surface density of MGCs of Althæa are systematically higher than Milky Way clouds regardless of the density threshold adopted. These MGCs are, in fact, highly supersonic, with high Mach number of . Their velocity dispersions are comparable to those observed in 2 starburst galaxies. A comparison between the bulk and non-thermal velocity dispersions of MGCs indicates that MGCs are supported by turbulence motions.
High pressure MGCs are found throughout the disk of Althæa, with a median pressure of K . This is in contrast to the local ULIRGs, where such high pressure has only been observed in molecular clouds concentrated in their central regions (Downes & Solomon 1998; Sakamoto et al. 2008). In ULIRGs, MGCs are formed by shock compression and cloud-cloud collisions that funnel large amounts of gas from progenitor galaxies towards the central region (Tan 2000; Wu et al. 2018). On the other hand, the highly turbulent MGCs of Althæa results from extra-planar flows and high velocity accretion/SN-driven outflows. The presence of such extra-planar flows may also be the dominant mode for forming the highly supersonic massive MGCs observed in gas-rich star-forming galaxies at 2, for instance, those reported in Swinbank et al. (2011). The variation in with seen in this work is in line with previous studies, suggesting that “Larson’s third relation” is an artifact arising from observational bias artifact of the limited range of column densities a specific molecular line tracer is sensitive to (Ballesteros-Paredes & Mac Low 2002b; Ballesteros-Paredes et al. 2011b). This would imply column density is not a fundamental properties of molecular clouds and not all molecular clouds are virialized.
We perform virial analysis, as motivated by observations, to assess the stability of MGCs. On average, the virial parameter of MGCs in the starburst phase of Althæa is lower than in the accreting phase, as expected for star formation. Similarly, the virial parameter of MGCs identified at the highest density thresholds are lower than those identified at lower density thresholds. Close resemblance of and maps indicates that contribution from the stellar component plays an important role in governing the stability of the MGCs against axisymmetric perturbations, especially in the central part of Althæa. Similarly, stabilizing effect due to the thickness of its disk is also non-negligible. This illustrates the importance of accounting for stellar contribution and disk thickness when examining the stability of molecular gas structures, especially in relatively evolved and enriched systems at high redshift that are preferentially being observed now. Star formation is expected to take place within its star-forming clumps and cores on smaller scales, where energy quickly dissipates. This is consistent with the notion that collapsing structures result from gravitational instability occurring within globally stable structures, which are supported by turbulence and rotation on large scale.
This also implies that observations with spatial resolution better than 40 pc are needed to examine the truly star-forming structures (cores), and thus, star formation in the first galaxies. Such resolution is in principle within reach using ALMA, for which 001 resolution images can be attained using the highest frequency bands. With the Next Generation VLA151515http://library.nrao.edu/public/memos/ngvla/NGVLA_21.pdf, which is approximately ten times more sensitive than ALMA, direct observations of molecular gas clouds in galaxies at the EoR on cloud scales will be possible via the higher- rotational transitions of CO in the 2030s. In the meantime, cosmological zoom-in simulations, such as Serra, while inherently limited in galaxy statistics and depend on the sub-grid models adopted, serve as a useful tool for examining and making predictions on the morphology and dynamics of the molecular ISM of the first galaxies.
Acknowledgements
We thank Jens Kauffmann, Thushara Pillai, and Mark Swinbank for sharing their data, Caitlin Casey for useful discussions, and the referee for providing constructive comments on the manuscript. TKDL gratefully acknowledges support by the NSF through award SOSPA4-009 from the NRAO and support from the Simons Foundation. AF acknowledges support from the ERC Advanced Grant INTERSTELLAR H2020/740120. M-MML acknowledges partial support by the NSF through award AST18-15461, and hospitality from the Insitute for Theoretical Astrophysics at the University of Heidleberg. This work is based on a project developed at the Kavli Summer Program in Astrophysics (KSPA) held at the Center for Computational Astrophysics of the Flatiron Institute in 2018. The program was co-funded by the Kavli Foundation and the Simons Foundation. We thank the KSPA Scientific and Local Organizing Committees, and the program founder, Pascale Garaud, for supporting the genesis of this work. We also thank the Center for Cosmology and Particle Physics at the New York University for their hospitality in hosting us after the steam pipe explosion in NYC during the KSPA. The Flatiron Institute is funded by the Simons Foundation. This research has made use of NASA’s Astrophysics Data System Bibliographic Services.
References
- Agertz et al. (2013) Agertz, O., Kravtsov, A. V., Leitner, S. N., & Gnedin, N. Y. 2013, ApJ, 770, 25
- Astropy Collaboration et al. (2013) Astropy Collaboration, Robitaille, T. P., Tollerud, E. J., et al. 2013, A&A, 558, A33
- Ballesteros-Paredes et al. (2011a) Ballesteros-Paredes, J., Hartmann, L. W., Vázquez-Semadeni, E., Heitsch, F., & Zamora-Avilés, M. A. 2011a, MNRAS, 411, 65
- Ballesteros-Paredes et al. (2011b) —. 2011b, MNRAS, 411, 65
- Ballesteros-Paredes & Mac Low (2002a) Ballesteros-Paredes, J., & Mac Low, M.-M. 2002a, ApJ, 570, 734
- Ballesteros-Paredes & Mac Low (2002b) —. 2002b, ApJ, 570, 734
- Beaumont et al. (2013) Beaumont, C. N., Offner, S. S. R., Shetty, R., Glover, S. C. O., & Goodman, A. A. 2013, ApJ, 777, 173
- Behnel et al. (2011) Behnel, S., Bradshaw, R., Citro, C., et al. 2011, Computing in Science Engineering, 13, 31
- Behrendt et al. (2016a) Behrendt, M., Burkert, A., & Schartmann, M. 2016a, ApJ, 819, L2
- Behrendt et al. (2016b) —. 2016b, ApJ, 819, L2
- Behrendt et al. (2019) Behrendt, M., Schartmann, M., & Burkert, A. 2019, MNRAS, 1675
- Behroozi & Silk (2015) Behroozi, P. S., & Silk, J. 2015, ApJ, 799, 32
- Behroozi et al. (2013) Behroozi, P. S., Wechsler, R. H., & Conroy, C. 2013, ApJ, 770, 57
- Bertoldi & McKee (1992) Bertoldi, F., & McKee, C. F. 1992, ApJ, 395, 140
- Bolatto et al. (2008) Bolatto, A. D., Leroy, A. K., Rosolowsky, E., Walter, F., & Blitz, L. 2008, ApJ, 686, 948
- Boulares & Cox (1990) Boulares, A., & Cox, D. P. 1990, ApJ, 365, 544
- Bouwens et al. (2011) Bouwens, R. J., Illingworth, G. D., Labbe, I., et al. 2011, Nature, 469, 504
- Bovino et al. (2016) Bovino, S., Grassi, T., Capelo, P. R., Schleicher, D. R. G., & Banerjee, R. 2016, A&A, 590, A15
- Carilli & Walter (2013) Carilli, C. L., & Walter, F. 2013, ARA&A, 51, 105
- Carniani et al. (2018) Carniani, S., Maiolino, R., Amorin, R., et al. 2018, MNRAS, 478, 1170
- Ceverino et al. (2010) Ceverino, D., Dekel, A., & Bournaud, F. 2010, MNRAS, 404, 2151
- Ceverino et al. (2017) Ceverino, D., Glover, S. C. O., & Klessen, R. S. 2017, MNRAS, 470, 2791
- Colombo et al. (2014) Colombo, D., Hughes, A., Schinnerer, E., et al. 2014, ApJ, 784, 3
- Decarli et al. (2016) Decarli, R., Walter, F., Aravena, M., et al. 2016, ApJ, 833, 69
- Decarli et al. (2017) Decarli, R., Walter, F., Venemans, B. P., et al. 2017, Nature, 545, 457
- Decataldo et al. (2019) Decataldo, D., Pallottini, A., Ferrara, A., Vallini, L., & Gallerani, S. 2019, MNRAS, 1456
- D’Odorico et al. (2018) D’Odorico, V., Feruglio, C., Ferrara, A., et al. 2018, ApJ, 863, L29
- Donovan Meyer et al. (2013) Donovan Meyer, J., Koda, J., Momose, R., et al. 2013, ApJ, 772, 107
- Downes & Solomon (1998) Downes, D., & Solomon, P. M. 1998, ApJ, 507, 615
- Dunlop et al. (2017) Dunlop, J. S., McLure, R. J., Biggs, A. D., et al. 2017, MNRAS, 466, 861
- Federrath & Klessen (2013) Federrath, C., & Klessen, R. S. 2013, ApJ, 763, 51
- Ferkinhoff et al. (2015) Ferkinhoff, C., Brisbin, D., Nikola, T., et al. 2015, ApJ, 806, 260
- Gabor & Bournaud (2013) Gabor, J. M., & Bournaud, F. 2013, MNRAS, 434, 606
- Gallerani et al. (2018) Gallerani, S., Pallottini, A., Feruglio, C., et al. 2018, MNRAS, 473, 1909
- García-Burillo et al. (2003) García-Burillo, S., Combes, F., Hunt, L. K., et al. 2003, A&A, 407, 485
- Garland et al. (2015) Garland, C. A., Pisano, D. J., Mac Low, M.-M., et al. 2015, ApJ, 807, 134
- Genzel et al. (2011) Genzel, R., Newman, S., Jones, T., et al. 2011, ApJ, 733, 101
- Goldreich & Lynden-Bell (1965) Goldreich, P., & Lynden-Bell, D. 1965, MNRAS, 130, 97
- Goodman et al. (2014) Goodman, A. A., Alves, J., Beaumont, C. N., et al. 2014, ApJ, 797, 53
- Grassi et al. (2014) Grassi, T., Bovino, S., Schleicher, D. R. G., et al. 2014, MNRAS, 439, 2386
- Grisdale et al. (2018) Grisdale, K., Agertz, O., Renaud, F., & Romeo, A. B. 2018, MNRAS, 479, 3167
- Grisdale et al. (2019) Grisdale, K., Agertz, O., Renaud, F., et al. 2019, MNRAS, 486, 5482
- Grisdale et al. (2017) Grisdale, K., Agertz, O., Romeo, A. B., Renaud, F., & Read, J. I. 2017, MNRAS, 466, 1093
- Heitsch et al. (2009) Heitsch, F., Ballesteros-Paredes, J., & Hartmann, L. 2009, ApJ, 704, 1735
- Heyer et al. (2009) Heyer, M., Krawczyk, C., Duval, J., & Jackson, J. M. 2009, ApJ, 699, 1092
- Heyer & Brunt (2004) Heyer, M. H., & Brunt, C. M. 2004, ApJ, 615, L45
- Hodge et al. (2015) Hodge, J. A., Riechers, D., Decarli, R., et al. 2015, ApJ, 798, L18
- Hodge et al. (2016) Hodge, J. A., Swinbank, A. M., Simpson, J. M., et al. 2016, ApJ, 833, 103
- Hopkins et al. (2014) Hopkins, P. F., Kocevski, D. D., & Bundy, K. 2014, MNRAS, 445, 823
- Hughes et al. (2010) Hughes, A., Wong, T., Ott, J., et al. 2010, MNRAS, 406, 2065
- Hughes et al. (2013) Hughes, A., Meidt, S. E., Colombo, D., et al. 2013, ApJ, 779, 46
- Hunter (2007) Hunter, J. D. 2007, Computing in Science Engineering, 9, 90
- Inoue et al. (2016) Inoue, S., Dekel, A., Mandelker, N., et al. 2016, MNRAS, 456, 2052
- Jiang et al. (2016) Jiang, L., Finlator, K., Cohen, S. H., et al. 2016, ApJ, 816, 16
- Jones et al. (2001–) Jones, E., Oliphant, T., Peterson, P., et al. 2001–, SciPy: Open source scientific tools for Python, [Online; accessed ¡today¿]
- Jones et al. (2017) Jones, S. F., Blain, A. W., Assef, R. J., et al. 2017, MNRAS, 469, 4565
- Jura (1975) Jura, M. 1975, ApJ, 197, 575
- Kassin et al. (2012) Kassin, S. A., Weiner, B. J., Faber, S. M., et al. 2012, ApJ, 758, 106
- Katz et al. (2017) Katz, H., Kimm, T., Sijacki, D., & Haehnelt, M. G. 2017, MNRAS, 468, 4831
- Kauffmann et al. (2017a) Kauffmann, J., Pillai, T., Zhang, Q., et al. 2017a, A&A, 603, A89
- Kauffmann et al. (2017b) —. 2017b, A&A, 603, A90
- Kennicutt (1989) Kennicutt, Jr., R. C. 1989, ApJ, 344, 685
- Keto et al. (2005) Keto, E., Ho, L. C., & Lo, K.-Y. 2005, ApJ, 635, 1062
- Kohandel et al. (2019) Kohandel, M., Pallottini, A., Ferrara, A., et al. 2019, MNRAS, 487, 3007
- Krumholz et al. (2018) Krumholz, M. R., Burkhart, B., Forbes, J. C., & Crocker, R. M. 2018, MNRAS, 477, 2716
- Krumholz et al. (2009) Krumholz, M. R., McKee, C. F., & Tumlinson, J. 2009, ApJ, 693, 216
- Labadens et al. (2012) Labadens, M., Chapon, D., Pomaréde, D., & Teyssier, R. 2012, in Astronomical Society of the Pacific Conference Series, Vol. 461, Astronomical Data Analysis Software and Systems XXI, ed. P. Ballester, D. Egret, & N. P. F. Lorente, 837
- Larson (1981) Larson, R. B. 1981, MNRAS, 194, 809
- Leroy et al. (2015) Leroy, A. K., Bolatto, A. D., Ostriker, E. C., et al. 2015, ApJ, 801, 25
- Leung et al. (2019) Leung, T. K. D., Riechers, D. A., Baker, A. J., et al. 2019, ApJ, 871, 85
- Li et al. (2005) Li, Y., Mac Low, M.-M., & Klessen, R. S. 2005, ApJ, 626, 823
- Li et al. (2006) —. 2006, ApJ, 639, 879
- Lupi & Bovino (2020) Lupi, A., & Bovino, S. 2020, MNRAS, 60
- Ma et al. (2018) Ma, X., Hopkins, P. F., Garrison-Kimmel, S., et al. 2018, MNRAS, 478, 1694
- Mac Low (1999) Mac Low, M.-M. 1999, ApJ, 524, 169
- Maiolino et al. (2015) Maiolino, R., Carniani, S., Fontana, A., et al. 2015, MNRAS, 452, 54
- Malhotra et al. (2001) Malhotra, S., Kaufman, M. J., Hollenbach, D., et al. 2001, ApJ, 561, 766
- Martin & Kennicutt (2001) Martin, C. L., & Kennicutt, Robert C., J. 2001, ApJ, 555, 301
- McKee & Ostriker (2007) McKee, C. F., & Ostriker, E. C. 2007, ARA&A, 45, 565
- McKee & Zweibel (1992) McKee, C. F., & Zweibel, E. G. 1992, ApJ, 399, 551
- Meidt et al. (2013) Meidt, S. E., Schinnerer, E., García-Burillo, S., et al. 2013, ApJ, 779, 45
- Moster et al. (2013) Moster, B. P., Naab, T., & White, S. D. M. 2013, MNRAS, 428, 3121
- Moster et al. (2018) —. 2018, MNRAS, 477, 1822
- Oka et al. (2001) Oka, T., Hasegawa, T., Sato, F., et al. 2001, ApJ, 562, 348
- Ono et al. (2013) Ono, Y., Ouchi, M., Curtis-Lake, E., et al. 2013, ApJ, 777, 155
- Pallottini et al. (2017a) Pallottini, A., Ferrara, A., Bovino, S., et al. 2017a, MNRAS, 471, 4128
- Pallottini et al. (2017b) Pallottini, A., Ferrara, A., Gallerani, S., et al. 2017b, MNRAS, 465, 2540
- Pallottini et al. (2019) Pallottini, A., Ferrara, A., Decataldo, D., et al. 2019, MNRAS, 1329
- Pan et al. (2015) Pan, H.-A., Fujimoto, Y., Tasker, E. J., et al. 2015, MNRAS, 453, 3082
- Planck Collaboration et al. (2014) Planck Collaboration, Ade, P. A. R., Aghanim, N., et al. 2014, A&A, 571, A16
- Rafikov (2001) Rafikov, R. R. 2001, MNRAS, 323, 445
- Richings et al. (2014) Richings, A. J., Schaye, J., & Oppenheimer, B. D. 2014, MNRAS, 442, 2780
- Romeo (1992) Romeo, A. B. 1992, MNRAS, 256, 307
- Romeo & Falstad (2013) Romeo, A. B., & Falstad, N. 2013, MNRAS, 433, 1389
- Romeo & Wiegert (2011) Romeo, A. B., & Wiegert, J. 2011, MNRAS, 416, 1191
- Rosdahl et al. (2018) Rosdahl, J., Katz, H., Blaizot, J., et al. 2018, MNRAS, 479, 994
- Rosolowsky & Blitz (2005) Rosolowsky, E., & Blitz, L. 2005, ApJ, 623, 826
- Rosolowsky & Leroy (2006) Rosolowsky, E., & Leroy, A. 2006, PASP, 118, 590
- Rosolowsky et al. (2008) Rosolowsky, E. W., Pineda, J. E., Kauffmann, J., & Goodman, A. A. 2008, ApJ, 679, 1338
- Rubin (1985) Rubin, R. H. 1985, ApJS, 57, 349
- Sakamoto et al. (2008) Sakamoto, K., Wang, J., Wiedner, M. C., et al. 2008, ApJ, 684, 957
- Sanders et al. (1985) Sanders, D. B., Scoville, N. Z., & Solomon, P. M. 1985, ApJ, 289, 373
- Scoville et al. (1991) Scoville, N. Z., Sargent, A. I., Sanders, D. B., & Soifer, B. T. 1991, ApJ, 366, L5
- Scoville & Solomon (1974) Scoville, N. Z., & Solomon, P. M. 1974, ApJ, 187, L67
- Shetty et al. (2010) Shetty, R., Collins, D. C., Kauffmann, J., et al. 2010, ApJ, 712, 1049
- Smith et al. (2009) Smith, B. D., Turk, M. J., Sigurdsson, S., O’Shea, B. W., & Norman, M. L. 2009, ApJ, 691, 441
- Sparre et al. (2015) Sparre, M., Hayward, C. C., Springel, V., et al. 2015, MNRAS, 447, 3548
- Stark (2016) Stark, D. P. 2016, ARA&A, 54, 761
- Swinbank et al. (2011) Swinbank, A. M., Papadopoulos, P. P., Cox, P., et al. 2011, ApJ, 742, 11
- Tan (2000) Tan, J. C. 2000, ApJ, 536, 173
- Teyssier (2002) Teyssier, R. 2002, A&A, 385, 337
- Toomre (1964) Toomre, A. 1964, ApJ, 139, 1217
- Trebitsch et al. (2018) Trebitsch, M., Volonteri, M., Dubois, Y., & Madau, P. 2018, MNRAS, 478, 5607
- Turk et al. (2011) Turk, M. J., Smith, B. D., Oishi, J. S., et al. 2011, ApJS, 192, 9
- Vallini et al. (2018) Vallini, L., Pallottini, A., Ferrara, A., et al. 2018, MNRAS, 473, 271
- van de Voort et al. (2011) van de Voort, F., Schaye, J., Booth, C. M., & Dalla Vecchia, C. 2011, MNRAS, 415, 2782
- van der Walt et al. (2011) van der Walt, S., Colbert, S. C., & Varoquaux, G. 2011, Computing in Science Engineering, 13, 22
- Van Rossum & de Boer (1991) Van Rossum, G., & de Boer, J. 1991, CWI Quarterly, 4, 283
- Wang & Silk (1994) Wang, B., & Silk, J. 1994, ApJ, 427, 759
- Weiß et al. (2001) Weiß, A., Neininger, N., Hüttemeister, S., & Klein, U. 2001, A&A, 365, 571
- Williams et al. (1994) Williams, J. P., de Geus, E. J., & Blitz, L. 1994, ApJ, 428, 693
- Wu et al. (2018) Wu, B., Tan, J. C., Nakamura, F., Christie, D., & Li, Q. 2018, PASJ, 70, S57