An extensive-air-shower-like event registered with the TUS orbital detector
Abstract
TUS (Tracking Ultraviolet Set-up) is the world’s first orbital detector of ultra-high-energy cosmic rays (UHECRs). It was launched into orbit on 28th April 2016 as a part of the scientific payload of the Lomonosov satellite. The main aim of the mission was to test the technique of measuring the ultraviolet fluorescence and Cherenkov radiation of extensive air showers generated by primary cosmic rays with energies above EeV in the Earth atmosphere from space. During its operation for 1.5 years, TUS registered almost 80,000 events with a few of them satisfying conditions anticipated for extensive air showers (EASs) initiated by UHECRs. Here we discuss an event registered on 3rd October 2016. The event was measured in perfect observation conditions as an ultraviolet track in the nocturnal atmosphere of the Earth, with the kinematics and the light curve similar to those expected from an EAS. A reconstruction of parameters of a primary particle gave the zenith angle around but an extreme energy not compatible with the cosmic ray energy spectrum obtained with ground-based experiments. We discuss in details all conditions of registering the event, explain the reconstruction procedure and its limitations and comment on possible sources of the signal, both of anthropogenic and astrophysical origin. We believe this detection represents a significant milestone in the space-based observation of UHECRs because it proves the capability of an orbital telescope to detect light signals with the apparent motion and light shape similar to what are expected from EASs. This is important for the on-going development of the future missions KLYPVE-EUSO and POEMMA, aimed for studying UHECRs from space.
1 Introduction
Measurements of the energy spectrum, nuclear composition and arrival directions of ultra-high-energy cosmic rays (UHECRs, EeV1111 EeV eV) are an important part of the modern astrophysics and particle physics [1]. It was more than 50 years ago that the first cosmic ray particles of so extreme energies were detected [2] and a cut-off of the energy spectrum was predicted [3, 4]. However, the nature and origin of UHECRs are still not understood. To a great extent, the problem relates to their very low flux. Suffices to say the biggest UHECR experiments—the Pierre Auger Observatory and the Telescope Array—registered less than two dozen events with energies EeV in 13 and 7 years of operation respectively [5, 6].
The primary goal of the TUS project, first announced in 2001 [7], was to expand the UHECR experimental studies to space as suggested by Benson and Linsley in early 1980’s [8, 9]. The main idea is that fluorescence and Cherenkov ultraviolet (UV) radiation of an extensive air shower (EAS) generated by an UHECR in the nocturnal atmosphere of the Earth can be detected from a satellite similar to the way it is observed from the ground with fluorescence telescopes but with a much larger exposure, thus considerably increasing the number of registered events.
The TUS instrument on board the Lomonosov satellite was launched into orbit from the newly built Vostochny Cosmodrome (Russia) on 28th April 2016. The satellite had a sun-synchronous orbit with an inclination of , a period of min, and a height of about 470–500 km above the sea level [10, 11]. The detector operated till late 2017 and registered almost 80,000 events in the mode aimed at studying UHECRs, see below. The upper limit of the total exposure is . The estimate reduces to after one takes into account different penalty factors that arise due to a high background illumination (and thus a higher energy threshold) over thunderstorm regions, auroral and urban areas, during periods of full-moon nights etc. assuming their weights are the same as for the JEM-EUSO project [12, 13].
Several preliminary UHECR candidates have been selected in the TUS data earlier [14, 12]. We found six events among them with the shape and kinematics of the signals that resemble what is expected from an EAS. In five of these cases, the field of view (FOV) of the hit pixels correlated with location of airports thus strongly suggesting an anthropogenic origin of the signals. In the present work, we focus on an event registered on 3rd October 2016 (TUS161003 for short), which is different from the other five since there is neither an airport near the FOV of the hit pixels, nor another obvious man-made object or settlement that could be the source of a sufficiently strong emission in the UV range. First, we describe the experiment, then present the event and discuss its phenomenology, temporal and spatial behavior and conditions of the observation. Next, we focus on the reconstruction of the arrival direction and energy of a possible source of the event assuming it had an UHECR origin. Finally, we discuss the result including possible anthropogenic and astrophysical sources of the signal.
2 The TUS detector
2.1 Design of the detector
TUS is a UV telescope looking downward into the atmosphere in the nadir direction. It consists of the two main parts: a modular Fresnel mirror-concentrator and 256 photomultiplier tubes (PMTs) arranged in a -channel photodetector located in the focal plane of the mirror. The overall field of view of the detector is .
The TUS mirror is composed of 7 hexagonal segments made of a carbon plastic with the total area of m2. The focal distance of the mirror equals 1500 mm. The local reflectivity of the mirror is higher than 85% in the near-UV range.
The photodetector is built of 16 modules, each consisting of 16 channels. Each channel (pixel) is a Hamamatsu R1463 PMT with the quantum efficiency of approximately 20% in the wavelength band 300–400 nm. A multi-alcali cathode is covered by a UV glass filter of the UFS1 type and a reflective light guide with a square entrance of the 15 mm size located in the focal plane of the mirror. The angular resolution (the FOV of one channel) equals 10 mrad, which corresponds to a spatial domain of about at the sea level from a 500 km orbit height. Thus, the full instantaneous area observed by TUS on the ground is approximately .
The general design of TUS is determined by its main task of registering fluorescence and backscattered (reflected) Cherenkov radiation of EASs in the near-UV band with a time resolution of 0.8 s in a full temporal interval of 256 time steps. The temporal and spatial resolution of the detector makes it possible to measure a time-dependent signal from an EAS as a source moving rectilinearly at the speed of light. The trajectory of such a source is the EAS axis, which in its turn coincides with the arrival direction of a primary particle given by the azimuth and the zenith angle .
The mirror projects this trajectory in a rectilinear track resulting in a moving EAS image on the focal plane. At any moment of time, the signal is distributed over several neighbouring channels due to the non-ideal focusing of the mirror. The shape of a spot is determined by the position of the centre of the image and by the point spread function (PSF) of the mirror. The PSF was measured during pre-flight tests of the mirror for different angles of incidence [15]. A typical root-mean-square radius of a spot varies from approximately 7–8 mm on the axis to 8–10 mm at the edge of the FOV (at ), where the shape of the spot is asymmetric due to coma aberration.
The effectiveness of the TUS optics was estimated to be of the order of 0.7 based on tests performed at the stage of manufacturing. This means about 70% of all UV photons approaching the entrance pupil are focused in the PMTs.
The TUS electronics can operate in four modes intended for registering various fast optical phenomena at different time scales with various time sampling. In addition to the EAS mode with the 0.8 s temporal resolution, TUS performed observations with the sampling time of 25.6 s, 0.4 ms and 6.6 ms. The latter one, a so called “Meteor” mode, is used in the present work for a relative calibration of PMTs. Every data record contains 256 waveforms each consisting of ADC codes registered in 256 consecutive moments of time.
The TUS on-line selection system is provided by a two-level trigger [16, 17], which allows selecting events in terms of both the intensity of the signal (a threshold trigger) and the specific space-time pattern (an adjacency trigger). Data of all 256 channels are recorded in case conditions of both triggers are satisfied thus forming a TUS event.
The sensitivity of the PMTs was controlled by the high-voltage system, which was aimed to decrease their sensitivity in conditions of a high illumination. Unfortunately, the detector was accidentally operated at the highest voltage due to a malfunction of the system during the first few orbits, including both day and nocturnal segments. The reason of such operation was that the focal surface was partially illuminated by a very bright Sun light, which caused a shortcut in the high voltage power supply (HVPS) divider. The HVPS of two modules (number 5 and number 15) were burnt and these modules did not operate anymore. In other modules, only PMTs with a high current were damaged but they had protected other PMTs due to a shortcut because the voltage was significantly decreased. Totally, 51 photo detector channels were burnt. A map of PMTs is shown in the left panel of Fig. 1. Dark pixels are dead ones, the other pixels were operating, with the hit channels of the TUS161003 event shown in yellow. One can see the measured event lies in a “good” part of the focal surface, with only the starting point of the event being adjacent to the non-working module.
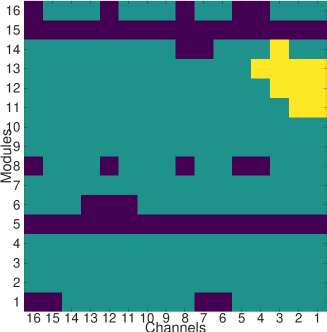
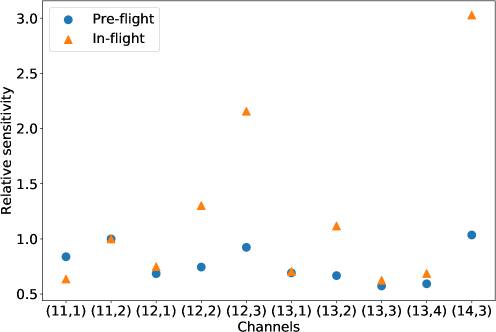
While 51 PMTs were totally broken by the time of the event measurement, gains of many other PMTs might have changed so that the validity of the pre-flight calibration [18] was lost. To overcome the problem, a new method of absolute calibration was developed for estimating the sensitivity of channels of the photodetector. The method is a combination of the PMT calibration based on an analysis of the stationary background glow and an estimation of the relative sensitivity of channels employing events registered in the slow (“Meteor”) mode. A change of PMT gains in the hit channels as estimated by the method of in-flight calibration versus the pre-flight values is demonstrated in the right panel of Fig. 1, see Appendix A for details.
2.2 Expected detector response to UHECRs
At any moment of time, UV illumination from an EAS is focused by the optical system of TUS on a number of adjacent channels (“hit channels”). A response of the th channel to a signal in 256 time steps of a data record is represented by 10-bit ADC codes , . The average value of the background illumination in each channel (the base level) can be estimated from a stationary part of the waveform occupying first time steps of each record.
The digital signal is determined by the emission of an EAS, transparency of the atmosphere and by the sensitivity of the detector in a given direction. A “physical” signal is represented by an intensity of the illumination at the entrance pupil expressed as the number of photons per unit time per unit area. In particular, by the light curve we mean the dependence of on time. A contribution of each th hit channel to depends on its sensitivity :
| (2.1) |
Here, the sum is calculated over all hit channels.
In its turn, the sensitivity of the th channel in the DC-mode of a PMT can be expressed as a function of the PMT’s gain and the overall optical efficiency , which includes the photo-cathode quantum efficiency, as well as the efficiency of the mirror and the light guide of the channel:
| (2.2) |
where V-1 is the anode voltage-to-ADC code coefficient, is the fundamental charge, kOhm is the anode resistance, and is the field angle of the channel in the FOV.
The sensitivity in the nadir direction222The cosine of the maximum field angle equals 0.997, so the angular dependence of the sensitivity can be neglected. is estimated as 0.44 s m2 for the average value of the overall optical efficiency 0.14, which is the product of the quantum efficiency equal to 0.2 and the efficiency of the mirror and light guides , and the PMT gain equal to , which is a typical value for the type of PMTs deployed in the TUS photodetector [19].
Characteristic features of the detector response to a signal from an EAS can be found with numerical simulations. We utilized the ESAF (EUSO Simulation and Analysis Framework) [20] software to simulate fluorescence and Cherenkov light from extensive air showers as they are observed by TUS. Detailed simulations of the detector response were performed with the code developed at University of Turin (Italy) [12]. Another implementation was developed at Joint Institute for Nuclear Research (Dubna, Russia) at the R&D stage [17]. Both codes provide similar outcomes.
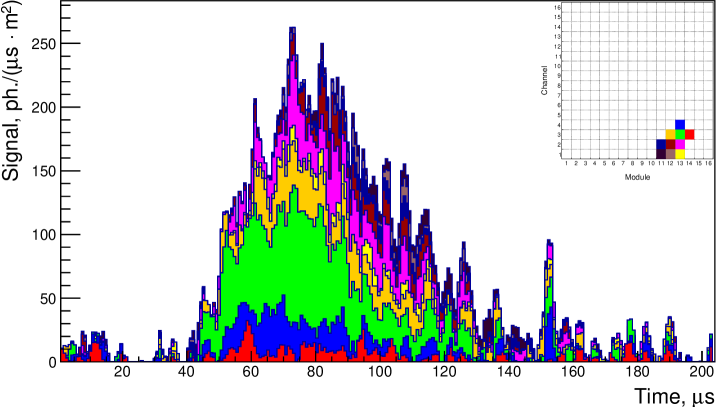
The left panel of Fig. 2 shows waveforms of eight hit channels that represent the detector response to an EAS from a primary proton with the energy of eV and the zenith angle of . For simplicity, we use an equal sensitivity of all channels corresponding to the overall optical efficiency 0.14 and the PMT gain . Zero background illumination is assumed. An albedo of the ground surface was set equal to 2% since this is the value of albedo of grass in the UV range of 320–390 nm [21], and the TUS161003 event was registered above a similar surface. One can see a sequential movement of the peak of the digital signal from one channel to another.333Channels are indicated in the format (module number, channel number). The right panel of the figure represents the characteristic features of the light curve calculated in accordance with Eq. (2.1). One can see its increase and subsequent abrupt decline due to the shower front hitting the ground and a weak Cherenkov peak near the time stamp 100 s. Here, the signals are filtered with the moving average calculated over three time steps to minimize statistical fluctuations. In the upper-right part of the panel, a channel map is shown, on which the hit channels are highlighted with the same colours as in the histogram.
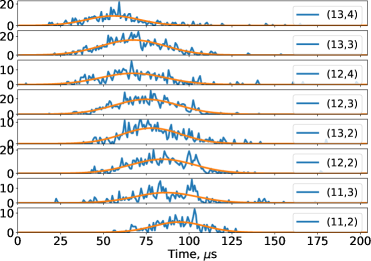
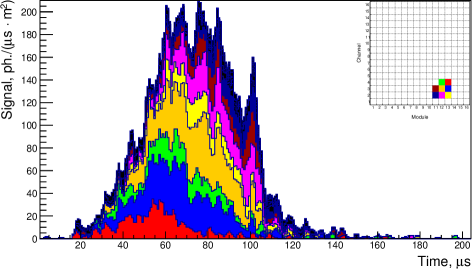
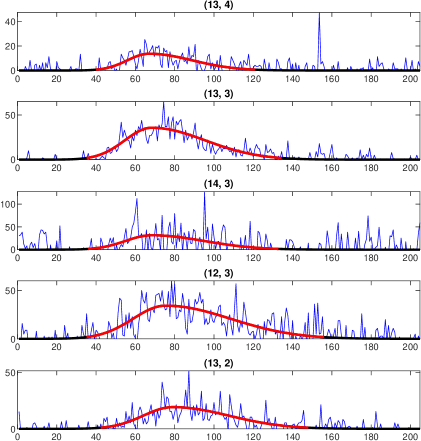
Figure 3 presents examples of the expected response of TUS to EASs generated by a primary proton with the energy of 1 ZeV arriving at three different zenith angles . Simulations were performed with the same assumptions on the sensitivity of channels, albedo and the background illumination as above. Arrival directions of EASs were chosen so that the signal was located in approximately the same part of the focal surface as the TUS161003 event. Five orders of scattering of light were taken into account since an impact of higher orders was found to be negligible.
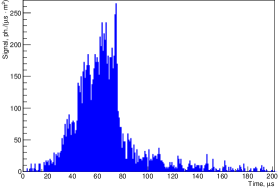
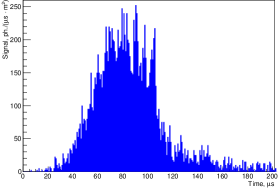
One can see typical asymmetric forms of the light curves depending on the zenith angle of the primary proton, with the mean FDHM growing from approximately 35 s for to 70 s for . A sharp break of the signal at small zenith angles is caused by the EAS front hitting the ground. A pronounced peak from the Cherenkov radiation is seen clearly for at s time. The Cherenkov peak becomes less pronounced as the zenith angle grows, and is rarely observed in simulations for and the surface albedo of 2%. The heavy “tail” of the signal, which can be seen even for EASs with small zenith angles, is due to multiple scattering of light in the atmosphere [20]. It becomes particularly significant at large zenith angles.
3 Phenomenology of the TUS161003 event
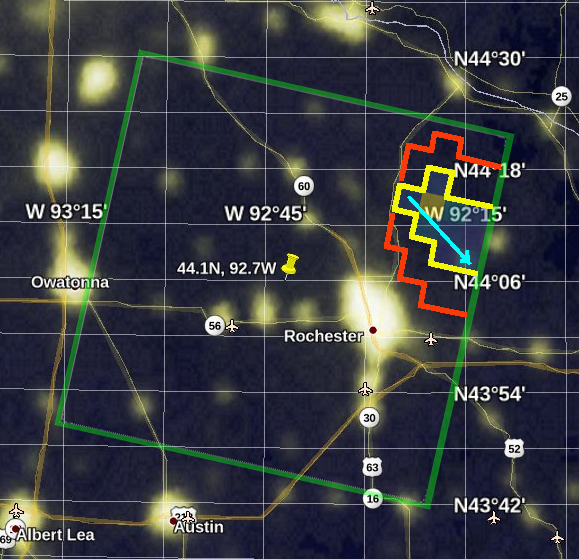
The event was registered on 3rd October 2016 at 05:48:59 UTC, 00:48:59 local time. The centre of the FOV of TUS at the moment of registration was located at N, W above Minnesota, USA, in approximately 100 km south-east from Minneapolis. The orbit height was about 481 km above the sea level.
Location of the FOV of TUS on the ground at the moment of registration of the event is shown in Fig. 7. The direction of motion of the satellite was from NNE to SSW, parallel to the left and right boundaries of the FOV shown in green. The location is a part of the Richard J. Dorer Memorial Hardwood State Forest. There are no big cities, airports or other obvious potential sources of the signal below the hit channels. The Red Wing Regional Airport (N, W) and Rochester, the third-largest city of Minnesota, are located beyond the “error box” of the location of the hit pixels.444The uncertainty in the position of the FOV of the detector is due to the s accuracy of the time stamps of the triggered events, which results in approximately km along the trajectory. The coordinates of the satellite were known with a high accuracy thus we take them as precise and neglect an uncertainty of the position in the direction perpendicular to the direction of motion. One can also notice the Mississippi river, which is a major commercial waterway, to the North-East of the FOV of the detector, with the shape of the river being roughly parallel to the spot made by the hit channels.555We thank the anonymous referee for noticing this. We have studied the TUS data for correlations between triggered events, especially those with similar waveforms, with the Mississippi River and other major commercial waterways but did not find any. A visit of our colleague to the area of registration did not reveal any obvious bright sources of strobe lights though we cannot exclude there were some at the moment of the observation.
3.1 Description of the weather situation
An analysis of conditions of observation was performed to exclude possible atmospheric sources that could imitate an EAS signal. The analysis was conducted by means of the US National Weather Service dataset888https://www.wpc.ncep.noaa.gov/index.shtml#page=ovw with the main conclusion that the atmosphere was clear at the time of observation of the event without any noticeable clouds except some small low-altitude ones. Details are provided below in Appendix B..
Thunderstorm activity was studied in the region using the Vaisala Global Lightning Dataset GLD360, a ground-based lightning location network with a relatively high detection efficiency [22, 23]. No lightning strikes were registered within 930 km and during s from the event. This witnesses in favour of a non-thunderstorm origin of the signal.
3.2 Hit channels and their signals
An algorithm similar to the one developed for searching for EAS candidates [14] was employed for selecting hit channels in the TUS161003 event. A total of 10 hit channels were selected. The respective waveforms are shown in Fig. 5. The signals are approximated by an asymmetric Gaussian function, i.e., a smooth sewing of two Gaussian functions at the point of maximum.
The signals demonstrate a spatio-temporal dynamics similar to what is expected from an EAS, see the left panel of Fig. 2. The hit channels are grouped in an oblong spot, the shape of which might be a “convolution” of two factors, namely, the asymmetric PSF of the mirror and a linear track. Times of the maximum of the signal (a peak) in each channel have some shift from one channel to another. It is natural to interpret this as a movement of the signal in the FOV of the detector.
Numerical characteristics of the signals in all hit channels are presented in Table 1. Shown are the time of the peak from the beginning of the record, the full duration at half maximum (FDHM) and the amplitude of the signal. The median FDHM equals approximately 48 s, the time interval from the first peak to the last one s.
| (md,ch) | s | FDHM, s | |
|---|---|---|---|
| (13,4) | 66.9 | 38.9 | 27.9 |
| (13,3) | 68.2 | 48.0 | 81.2 |
| (14,3) | 68.2 | 47.0 | 12.1 |
| (12,3) | 75.3 | 58.3 | 30.5 |
| (13,2) | 79.1 | 51.2 | 34.9 |
| (13,1) | 79.3 | 46.9 | 9.0 |
| (12,2) | 86.3 | 48.3 | 20.9 |
| (11,2) | 100.2 | 30.2 | 11.8 |
| (12,1) | 104.8 | 40.9 | 7.6 |
| (11,1) | 123.3 | 64.5 | 10.6 |
It is important to note that the rest of the channels demonstrated a noise-like behaviour of the signal typical for a low background illumination, similar to the behaviour of the signals shown in Fig. 5 during the first s of the record. The trigger rate was at the average level. The signal could not be caused by a direct cosmic ray hitting the camera because such events used to produce drastically different waveforms. Such signals used to manifest themselves in a signal jumping in most cases to the highest possible ADC counts during one time step (i.e., in less than a microsecond) and then having exponential tails. The hit channels in such events occupied adjacent pixels forming a line in the focal surface, which made us call them “track-like.” Detailed discussions of this type of events with numerous examples can be found in [24, 10, 11, 25].
3.3 Light curve analysis
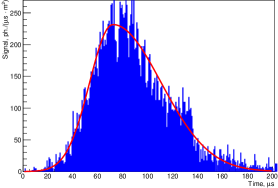
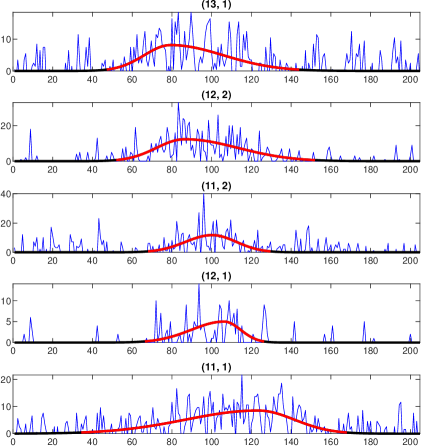
Waveforms of the ten hit channels shown in Fig. 5 were used to reconstruct the light curve of the event. The resulting light curve and the hit channel map are shown in Fig. 6. The signal is smoothed with the moving average calculated for three time steps to minimize statistical fluctuations.
The light curve is clearly asymmetric, which is most likely due to the delayed signal as a result of multiple scattering of UV photons in the atmosphere. The following set of four parameters was obtained by fitting the light curve with an asymmetric Gaussian function with the coefficient of asymmetry defined as a ratio of the attenuation time to the rise time:
-
•
the amplitude of the signal at its maximum ph. s-1 m-2;
-
•
the position of its maximum s;
-
•
the full duration at half maximum FDHM s;
-
•
the coefficient of asymmetry .
To compare, the asymmetric Gaussian approximation of the light curve obtained for a simulated EAS with the zenith angle shown in the right panel of Fig. 3 has the coefficient of asymmetry .
4 Reconstruction of the event parameters
Here we present results of a reconstruction of parameters of the TUS161003 event assuming it was an air shower generated by an UHECR. The kinematic and amplitude characteristics of the signal in the hit channels will be used to estimate the arrival direction of a primary particle. The amplitude of the light curve will be employed to estimate its energy.
4.1 Arrival direction
To reconstruct the arrival direction of a relativistic particle, one needs to find parameters of its track in the focal plane (FP), along which the image centre (a “point”) moves at a constant velocity:
| (4.1) |
where and are Cartesian coordinates of the image centre in the FP at time , is a point on the track corresponding to , and are projections of the point velocity on the axes of the local Cartesian coordinate system.999The -axis coincides with direction of motion of the detector, the -axis points along the modules, the -axis points to the nadir, and the origin corresponds to the centre of the FP. However, when using approximation (4.1), one should keep in mind that an image of a point source hardly ever occupies a single channel in the FP because of the PSF, and the track is not exactly linear because of the discrete structure of the focal surface.
A reconstruction of allows one to calculate the arrival direction of a light source, its azimuth and zenith angles:
| (4.2) |
where is the distance between the detector and the source of light, which can be assumed constant, is the speed of light, is the angular velocity of the signal in the FP and is the focal distance of the mirror, is the angle between the optical system axis and the direction to the source, is the angle between ground projections of the line of sight and the track velocity direction.
The first term in the expression for in Eqs. (4.2) corresponds to the centre of the FOV. For an off-axis event with an angle , one should take into account the correction to the zenith angle, which means that the instantaneous velocity of the point varies slightly along the track (see the second term).
An heuristic method of estimating parameters of a track was suggested in [26]. The method is based on minimizing weighted least squares for Eqs. (4.1), independently for and . Weights are chosen equal to ADC codes in hit channels. An analysis that followed revealed a drawback of the method: it happened to be sensitive to the choice of hit channels in case some of them have a low signal. The method was modified to diminish the effect. In the improved algorithm, which we called the Linear Track Algorithm (LTA), one minimizes the sum
| (4.3) |
over parameters and , and a similar sum for and . Here, the index runs over all hit channels in the event, is a weight that correlates with the signal value at time , and and are coordinates of the centre of the th pixel.
One of the key modifications aimed at reducing the influence of statistical fluctuations of the ADC codes on the results of the LTA-reconstruction is a search for moments when the th channel is “active.” To solve the problem, the signal in each hit channel with the base level subtracted was fitted with a Gaussian. Then an “activity window” of the th channel was defined as an interval such that the fit values exceed some threshold value . Weights are proportional to the -th power of the fit value in the th channel at time . Parameters and control the LTA operation. It was shown in a dedicated study that the choice of the threshold equal to 30% relative to the amplitude value makes the reconstruction procedure more robust, and exponent gives the smallest bias in the reconstruction.
For the mean distance km, the off-axis correction angles and , the LTA-reconstruction gave the following results for the TUS161003 event: , .
Accuracy of the LTA method was studied with one thousand events simulated in ESAF for , . A distribution of errors of the reconstruction is presented in Fig. 7. One can see the mean error of reconstructing the zenith angle is close to zero but the reconstruction of the azimuth angle has a bias with the mean error . A comparatively low accuracy of the reconstruction is primarily due to the size of the pixels of the photodetector and a relatively small number of the hit channels. A work to improve the accuracy of the reconstruction is currently in progress and its results will be presented in a separate paper.
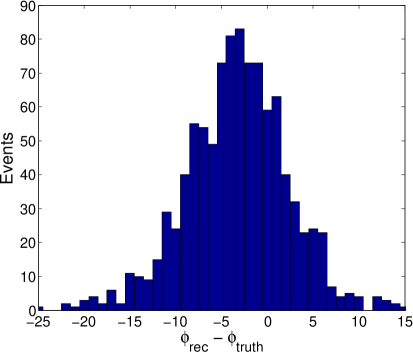
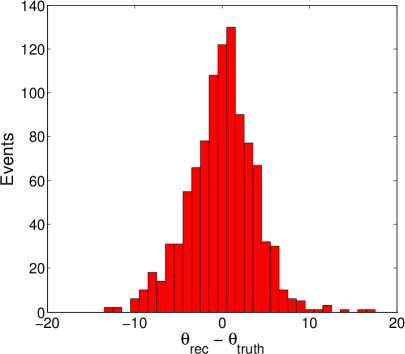
Assuming RMS-error estimated from simulated events as the uncertainty of the reconstructed values, we obtain the following result for the arrival direction of a hypothetical source of the TUS161003 event:
4.2 Energy estimation
It is well known that the number of photons in an EAS maximum is proportional to the number of electrons and, thus, the energy of a primary particle. This allows one to estimate the energy of a cosmic ray that caused the EAS basing on the amplitude of the light curve obtained after an absolute calibration of the detector.
Taking into account only direct fluorescent radiation, the amplitude of the signal at the entrance pupil can be written as
| (4.4) |
where is the number of electrons (and positrons) in the maximum, which is proportional to the energy of a primary particle GeV [20], is the fluorescence yield and is the atmosphere transmittance.
The fluorescence yield (the number of photons per charged particle per meter) is approximately constant at altitudes from 5 km to 15 km ( ph./m). The atmosphere transmittance depends on the altitude of the EAS maximum. If we take into account the Rayleigh scattering only, the mean transmittance in the wavelength 320–400 nm in the nadir direction increases from 0.6 to 0.85 as the altitude changes from 5 km to 10 km (and is greater than 0.9 above 14 km).
As a result, an UHECR with an energy of 1 ZeV and a zenith angle generates direct fluorescence illumination of the order of 150–180 ph. s-1 m-2 for the same altitude range. However, as noted above, the signal recorded by the TUS detector includes not only direct fluorescent radiation, but also single- and multiple-scattered components of both fluorescent and Cherenkov light. Since the amplitude of the direct fluorescent radiation is 70–80% of the amplitude of the total signal at the entrance pupil of the detector (see, e.g., [20]), one can expect the intensity at the maximum at the level of 200–240 ph. s-1 m-2, i.e., similar to that for the TUS161003 event.
To make the energy estimation more accurate, we compared amplitudes of light curves of the events simulated in ESAF with that of the TUS161003 event. We simulated the detector response to EASs with zenith angles and azimuth angles located in the focal plane similar to the TUS161003 event. Energies of primary particles (protons) varied in the range from 200 EeV to 1000 EeV with a step of 200 EeV. One thousand events were simulated for each energy bin. As expected, the amplitude of the signal was found to be proportional to the energy of a primary particle and reaches 212–230 ph. s-1 m-2 at 1 ZeV, see Table 2.
| Energy, EeV | 200 | 400 | 600 | 800 | 1000 |
|---|---|---|---|---|---|
| , ph. s-1 m-2 |
One needs to take into account two factors when evaluating the accuracy of energy estimations. These are (i) fluctuations of amplitudes of simulated events and (ii) an accuracy of estimating the amplitude of a real light curve. The first factor is presented in Table 2 as and leads to an error of in the ZeV region. The second factor depends on the accuracy of the sensitivity estimation, see Appendix A below. It is also influenced by a possible loss of a part of the signal hidden in fluctuations of the background illumination. This loss results in a small systematic underestimation of the energy of a primary particle.
Thus, the lower estimate of the energy of the TUS161003 event in the assumption of its UHECR origin can be presented as eV.
5 Discussion
First of all, we conclude that an apparent relativistic movement of a source of UV radiation was registered in the TUS161003 event. The angular velocity of the image on the focal plane is rad/s, which corresponds to the linear velocity around of an object moving at the distance of km from the detector perpendicular to the line of sight (an apparent speed). This justifies the application of the kinematic LTA method for reconstructing the arrival direction of the source as described in Section 4.1. Results of this reconstruction demonstrate that the direction of movement is toward the Earth surface with a zenith angle near . The most natural candidates for being a source of UV radiation spreading downward to the Earth are an extensive air shower initiated by an UHECR particle or a beam of light, e.g., a laser shot from an airplane or a satellite.
The next important parameter of the track is the maximum luminosity of the light curve, which is used to estimate the energy of a primary particle generating the air shower. It was shown in Section 4.2 that the energy of the TUS161003 event the assuming its UHECR origin is of the order of ZeV. This leads to a difficulty in interpreting the event as a “traditional” cosmic ray due to a very steep CR spectrum beyond 50 EeV measured by the main ground-based experiments—the Pierre Auger Observatory [5] and the Telescope Array [6].
Taking into account a limited exposure of the TUS experiment and the fact that the flux of ZeV CRs is expected to be from two to four orders of magnitude lower than that around 100 EeV, a chance TUS registered such an extremely energetic cosmic particle is very low (order of ) and, therefore, has to be excluded in the first instance.
Another important phenomenological feature of the event is that the maximum of the emission takes place very high in the atmosphere assuming its UHECR origin. This conclusion can be made if we compare the light curve of a simulated 1 ZeV air shower shown in Fig. 2 with that of the TUS161003 event shown in Fig. 6. It is clearly seen that the registered light curve does not have a steep break expected to take place when the shower front reaches the ground but gradually decays, nor does it demonstrate a Cherenkov peak following the maximum of the light curve in around 20–30 s. The time interval between the maximum of the light curve and the moment when the signal decays to the background level is 60 s, which geometrically corresponds to the altitude of 7.5 km. This allows us to estimate the slant depth of the shower maximum as g/cm2.
A high altitude of the light curve maximum can be also obtained if we consider a sharp peak near 150 s as a Cherenkov one, see Fig. 6. It has a delay from the light curve maximum s, and this means an altitude 8.5 km, which corresponds to the slant depth g/cm2 This number cannot be explained upon the assumption of an ordinary EAS with an energy of 100–1000 EeV and allows one to rule out the proton origin of the air shower since its maximum at energies around 1 ZeV should be much closer to the ground level.
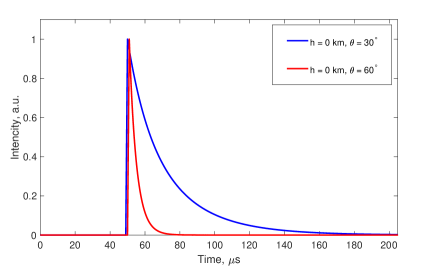
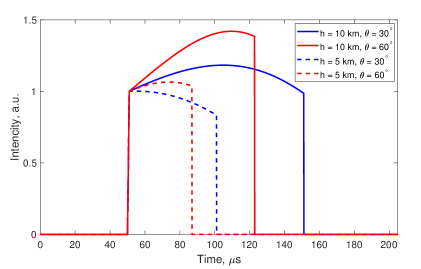
The above energy considerations and the fact the TUS161003 event was registered in a populated area, makes one consider an anthropogenic origin of the event more closely. One of the possibilities consistent with the downward movement is a laser shooting from the height of a few kilometers, for example, from an airplane. Simple simulations show the observed light curve cannot be explained by a laser lidar operating in a pulse mode since the light curve of an upward-going laser beam should have an exponential decay while the light curve of a downward-going laser beam should exhibit a sharp cut-off as soon as the beam hits the ground, see Fig. 8. However, multi-scattering can smoothen the cut-off resulting in a kind of a tail of the light curve. Anyway, the variety of devices employing lasers is rich and one cannot exclude a signal similar to the TUS161003 event can be produced by a combination of laser shots.
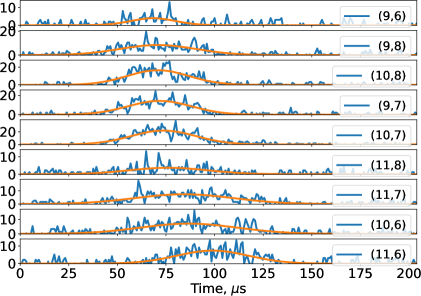
Another possibility is an ensemble of light impulses produced, e.g., by Xenon flashers. Simulations have revealed that a specially crafted pair of short but bright light flashes with a duration of the order of 40–50 s, located in 7–10 km from each other, separated by s in time, and with the first flash being 2–4 times brighter than the later one, can produce a signal with the light curve and kinematics of the signal similar to the TUS161003 event. Waveforms in hit channels of such an event are demonstrated in Fig. 9. A similarity with the signals shown in Figs. 2 and 5 is evident. An application of the LTA algorithm resulted in a “zenith angle” of the order of 35∘ in this case.
An emission from a pair of such flashes seems to be the most straightforward explanation of the TUS161003 signal taking into account the event was registered above a populated area, providing Xenon or other flashers emit enough light in the UV range. Still there are some caveats with this. First, these should be very short flashes bright in UV, with certain duration, mutual delay in time and separation in distance. Next, assuming these are random coincidences between flashes, it is natural to expect that in a half of cases the power of the first flash should be greater than the power of the second one, and the situation must be opposite for the other half of the events. As we have shown above, the signal in the TUS161003 event had a steep front and a much longer tail, which implies the brighter flash comes first. The other five events with similar waveforms and kinematics of the signal, mentioned in the Introduction, demonstrated similar asymmetric shapes of the signals and the light curves with a steep front coming first, thus also implying a brighter flash at the beginning of the event. This makes a random coincidence of all these factors less plausible.
Other possible sources of air showers in the atmosphere are neutrinos, energetic gamma-rays or heavier nuclei. No astrophysical neutrinos or gamma-rays with energies above a few PeV have been registered thus far but their existence is not ruled out by modern theories. It is important though that neutrino-induced showers develop even deeper in the atmosphere due to the small cross-section, and it is more likely to observe an upward-going EAS from an Earth-skimming neutrino, which contradicts the reconstructed direction of movement. One can expect that a heavier primary particle can solve this problem, but simulations show that the observed maximum is much higher than can be expected even for an iron nuclei.
Relativistic dust grains suggest an interesting explanation of an extreme-energy event developing high in the atmosphere. They were considered long ago by Spitzer [27] and later by Hayakawa [28] as possible sources of UHECRs of the highest energy. According to simulations [29, 7], an EAS initiated by a massive relativistic dust grain develops in the atmosphere at slant depths –400 g/cm2, and this seemingly agrees with the parameters of the TUS161003 event and can also explain why ground-based fluorescent detectors, which observe the lower layer of the atmosphere, do not register such events. A more detailed analysis of this hypothesis and the probability of registering dust grains by TUS will be addressed elsewhere.
6 Conclusions
The orbital telescope TUS on board the Lomonosov satellite is the first instrument in space with the primary goal to explore the possibility of registering UHECRs by their UV tracks in the atmosphere. The presented analysis of the data obtained during the experiment allowed us to interpret the TUS161003 event as a possible signal from an extensive air shower. Assuming the cosmic ray origin of the cascade, our reconstruction of the zenith angle gives , which agrees with results of simulations but the estimate of the signal amplitude indicates the energy of a primary particle of the order of eV, which is incompatible with the cosmic ray energy spectrum obtained with the ground-based experiments.
Basing on the first estimation of the TUS exposure and the pre-flight estimations of its sensitivity to UHECRs, it would be plausible to expect measuring one event in the energy range of eV. Due to a problem which occurred after the launch, it is not possible to assume the nominal sensitivity, and a new estimation of the TUS sensitivity was obtained, see Appendix A. The energy evaluation for the TUS161003 event based on these new estimations provides a value of one order of magnitude higher energy than could be expected. This can be interpreted in several ways, among them the event does not have an UHECR origin, see some hypotheses discussed in Section 5.
In conclusion, despite the fact that the origin of this event can not be unambiguously determined at present, this detection proves the capability of TUS to detect and trigger on light signals with an apparent motion and the light curve similar to what is expected from EASs. The most plausible interpretation of the event impies its anthropogenic nature but we cannot totally rule out all possible astrophysical sources including relativistic dust grains or even more exotic objects. A further analysis of the TUS161003 event and some other events registered during the experiment is aimed to resolve the puzzle. In the meanwhile, the Mini-EUSO detector [30] with its larger FOV, even though with less sensitivity than TUS, could search for the similar type of events to help understanding their origin.
We believe this measurement is important for the future orbital missions aimed for registering UHECRs from space. Being a pathfinder with a relatively low sensitivity, narrow field of view and only the 5-km spatial resolution, TUS has proved the possibility of observing EAS-like events from space and highlighted necessary improvements for the next-generation missions like KLYPVE-EUSO (K-EUSO) [31] and POEMMA [32].
Acknowledgments
We highly appreciate the invaluable help of Francesco Fenu with the implementation of TUS for ESAF and other issues related to the analysis of the event. We thank Gabriel Chiritoi and Anthony Salsi for their contribution in the study at its early stage and Roberto Cremonini for the help with the cloud coverage analysis. We acknowledge multiple insightful comments by the anonymous referee. We thank Vaisala Inc. company for providing the relevant data on lightning strikes. The data used in Section 3.1 were retrieved from the official NOAA National Weather Service (https://www.nco.ncep.noaa.gov/). Satellite data were retrieved from the Satellite Data Services archive (SSEC, https://www.ssec.wisc.edu/), and from the NASA LAADS DAC archive (https://ladsweb.modaps.eosdis.nasa.gov/). The work was done with partial financial support from the State Space Corporation ROSCOSMOS, M.V. Lomonosov Moscow State University through its “Prospects for Development” program and the Russian Foundation for Basic Research grant No. 16-29-13065 and 15-02-05498/17-a. The Italian group acknowledges financial contribution from the agreement ASI-INAF n.2017-14-H.O.
Appendix A Photodetector calibration
The absolute calibration of PMTs is a crucial point for reconstructing the number of in-falling photons and thus the energy and the arrival direction of a primary particle of an observed EAS. The initial calibration was performed before the launch of the Lomonosov satellite at the wavelength of 375 nm [18]. However, an emergency situation occurred during the first orbits after the detector was switched on. Namely, the system of an automatic PMT gain control did not work properly on the day side of the orbits, so that PMTs used to operate along the whole orbits at the highest voltage intended for nocturnal segments only. The behaviour of the gain control system was fixed later but a number of PMTs were damaged and gains of other PMTs changed. As a result, the absolute sensitivity of the channels turned out to be known only with a big uncertainty. A new method of the channel calibration was developed to address the problem. The method is a combination of the PMT calibration based on an analysis of the stationary background glow and an estimation of the relative sensitivity of channels employing events registered in the slow (“Meteor”) mode.
To estimate the gain of PMTs, we used the fact that the variance of a digital signal is a linear function of its mean value for a (quasy)stationary input signal on the photocathode. Denoting by the slope coefficient of the dependence, the product of the gain and the anode voltage-to-ADC code coefficient can be written as , where pF is the anode capacitance, cf. Eq. (2.2). Two examples of a linear approximation of the dependence are shown in Figure 10. Events with stationary signals were selected from the TUS data for this procedure. PMT gains for the ten hit channels of the TUS161003 event were estimated using this method. They are presented in the first row of Table 3, see also Figure 1.
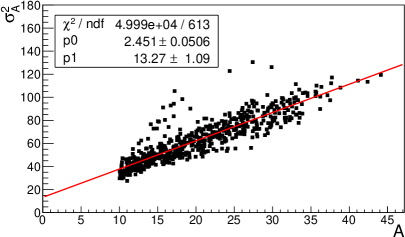
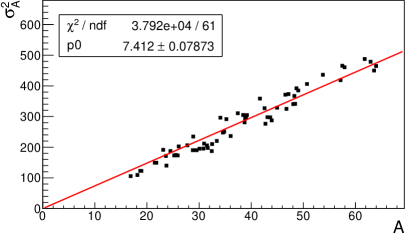
| (md,ch) | (11,1) | (11,2) | (12,1) | (12,2) | (12,3) | (13,1) | (13,2) | (13,3) | (13,4) | (14,3) |
| 1.14 | 1.79 | 1.34 | 2.33 | 3.86 | 1.26 | 2.00 | 1.12 | 1.23 | 5.42 | |
| , rel. | 1.26 | 1 | 0.63 | 0.45 | 0.51 | 1.26 | 0.49 | 0.70 | 0.71 | 0.86 |
| , sm2 | 0.80 | 1.00 | 0.47 | 0.59 | 1.12 | 0.90 | 0.55 | 0.44 | 0.49 | 2.61 |
We employed two considerations to estimate the optical efficiency of the hit channels: (i) stationary signals have very small relative fluctuations in the “Meteor” mode since the signal in this mode is integrated during 8192 time steps of the main mode, and (ii) the FOV of a channel shifts by 13 km in 1.68 s, during which a record in the “Meteor” mode was obtained, so that an area observed by a channel at the beginning of the record is later observed by an adjacent one, next with respect to the direction of movement of the satellite. This way, one can select signals which are stationary in time and (partially) uniform in the FOV and use them to estimate the relative sensitivity of channels. The optical efficiency of the hit channels relative to channel (11,2) is presented in the second row of Table 3.
Finally, absolute sensitivities of all hit channels are given in the third row of Table 3. Here, Eq. (2.2) was used together with an estimate of the average optical efficiency of 0.14.
We remark that the above method of in-flight calibration only takes into account fluctuations in the number of photoelectrons on a photocathode. However, the ADC code variance can be influenced by various other factors such as fluctuations of the secondary electron emission in the dynode system, voltage variations on the PMT high voltage power supply, an additional noise in the analog electronics and digitization path. These aspects as well as other details of the method and its results will be addressed in a dedicated publication.
Appendix B Weather conditions of the observation
The first map considered (Fig. 11) was the analysis chart with fronts and the RGB satellite composite image at 6:00 UTC, i.e., in 11 minutes after the TUS161003 event. A ridge, with its central high pressure located on the Western Canada, was extended roughly north-south on the Eastern part of the U.S. and on the Great Lakes area. On the other side, a trough dominated the Rocky Mountains and Western Plains area, and it was characterised by several local pressure minima. An extensive frontal zone passed through the central-western states, and progressively moved towards East, pushed by a high pressure field located on the Western Coast.
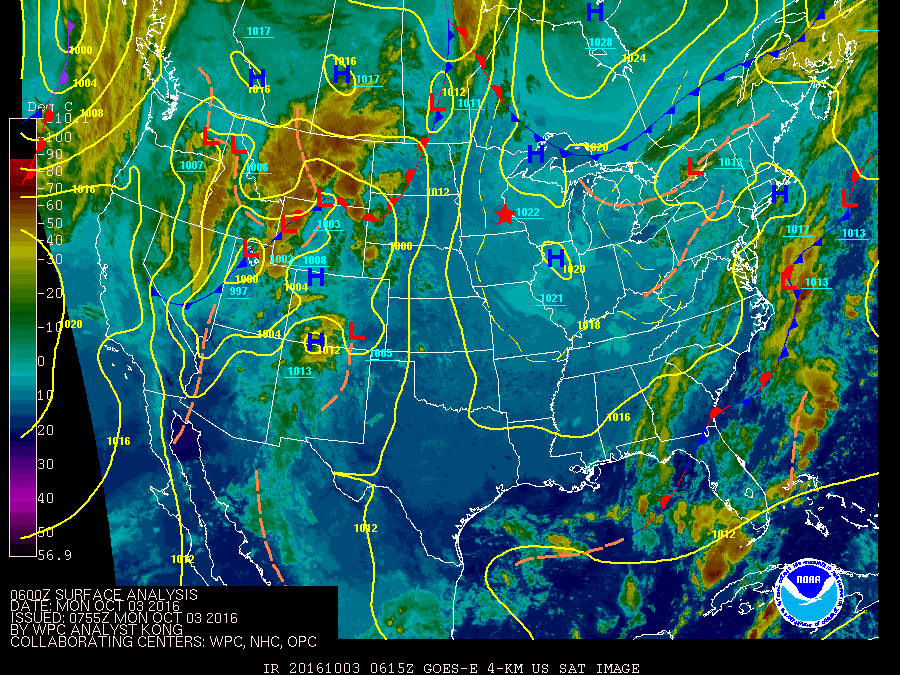
The map in Fig. 11 shows that a series of low-pressure systems were developing on the central-western U.S. that was organised into a thunderstorm line proceeding from West to East and positioned above Dakota 18 hours later. However, there were no clouds on the Eastern Minnesota and Wisconsin at 5:49 UTC as shown by Fig. 11 and also by the GEOS 13 image (at 5:45 UTC not shown), while fog was present in southern Wisconsin, which is depicted with light colours.
The atmosphere sounding at disposal was launched at Chanhassen ( N and W), and shows a not saturated, practically moist adiabatic profile with different layers of inversions. The tropopause was located at around . Unfortunately, the nearest sounding was at 00 UTC on 3rd October (late afternoon) and the next one at 12:00 UTC that corresponds to the morning local time. The evolution of the atmosphere profile was indeed coherent with a night thermal inversion building, and ideally at 6:00 UTC the inversion was partially built. This could justify the presence of fog at some stations (Fig. 12), but also the clear sky conditions due to radiative cooling of the ground.

The station observations of the area interesting for the event confirm the aforementioned (Fig. 12), and highlight the presence of light fog in the southern Wisconsin, but not in the area where the event was detected. The wind was feeble or calm, or less, and the average temperature ranged between (44 degrees Fahrenheit) and (57 degrees Fahrenheit). Some stations in the south part of Wisconsin had observed light fog (at other locations the fog was not observed but the air was saturated, in fact the dew point temperature was the same of air temperature). The sea level pressure trends were distributed as follows: a drop of pressure was generally measured in the western part of Minnesota, while there was a general increasing or stability on Wisconsin.
Looking at the MODIS satellite, that had shot an image at 4:20 UTC (Fig. 13), one can see the fog (shown in red) but also other clouds that probably were wrongly detected or that were not present at 6:00 UTC when operators compiled the SYNOP messages (Fig. 12).
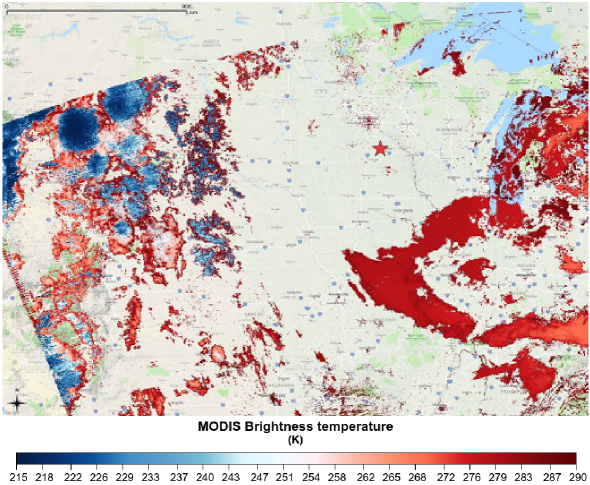
The cold front is not already formed, and the low pressure system is far from the event site. The Chanhassen station mentioned above showed that a strong inversion built up during the night, and this confirms the hypothesis of a clear sky. In fact, the ground could irradiate a lot of energy, and it reached low temperature values.
References
- [1] B. R. Dawson, M. Fukushima and P. Sokolsky, Past, present and future of UHECR observations, Prog. Theor. Exp. Phys. 2017 (2017) 12A101, [arXiv:1703.07897].
- [2] J. Linsley, L. Scarsi and B. Rossi, Extremely energetic cosmic-ray event, Physical Review Letters 6 (May, 1961) 485–487.
- [3] K. Greisen, End to the cosmic-ray spectrum?, Phys. Rev. Lett. 16 (Apr, 1966) 748–750.
- [4] G. T. Zatsepin and V. A. Kuz’min, Upper limit of the spectrum of cosmic rays, Soviet Journal of Experimental and Theoretical Physics Letters 4 (Aug., 1966) 78.
- [5] Pierre Auger collaboration, F. Fenu, The cosmic ray energy spectrum measured by the Pierre Auger Observatory, in Proceedings of Science (ICRC2017), no. 486, 2017, arXiv:1708.06592.
- [6] Y. Tsunesada, T. AbuZayyad, D. Ivanov, G. Thomson, T. Fujii and D. Ikeda, Energy spectrum of ultra-high-energy cosmic rays measured by the Telescope Array, in Proceedings of Science (ICRC2017), no. 535, 2017.
- [7] B. A. Khrenov, M. I. Panasyuk, V. V. Alexandrov et al., Space Program KOSMOTEPETL (project KLYPVE and TUS) for the study of extremely high energy cosmic rays, in Observing Ultrahigh Energy Cosmic Rays from Space and Earth (H. Salazar, L. Villasenor and A. Zepeda, eds.), vol. 566 of American Institute of Physics Conference Series, pp. 57–75, May, 2001.
- [8] R. Benson and J. Linsley, Satellite observation of cosmic-ray air showers, in Bulletin of the American Astronomical Society, vol. 12 of Bulletin of the American Astronomical Society, p. 818, Sept., 1980.
- [9] R. Benson and J. Linsley, Satellite observation of cosmic ray air showers, in 17th International Cosmic Ray Conference, Paris, France, vol. 8, pp. 145–148, 1981.
- [10] B. A. Khrenov, P. A. Klimov, M. I. Panasyuk, S. A. Sharakin, L. G. Tkachev, M. Y. Zotov et al., First results from the TUS orbital detector in the extensive air shower mode, J. of Cosmology and Astroparticle Physics 2017 (2017) 006, [1704.07704].
- [11] Lomonosov-UHECR/TLE collaboration, M. Zotov, Early results from TUS, the first orbital detector of extreme energy cosmic rays, in 2016 Conference on Ultrahigh Energy Cosmic Rays (UHECR2016) Kyoto, Japan, October 11-14, 2016, p. 011029, 2018, 1703.09484, DOI.
- [12] M. Bertaina, A. Castellina, R. Cremonini, F. Fenu, P. Klimov, A. Salsi et al., Search for extreme energy cosmic rays with the TUS orbital telescope and comparison with ESAF, in European Physical Journal Web of Conferences, vol. 210 of European Physical Journal Web of Conferences, p. 06006, Oct, 2019, DOI.
- [13] JEM-EUSO collaboration, J. H. Adams, S. Ahmad, J.-N. Albert et al., An evaluation of the exposure in nadir observation of the JEM-EUSO mission, Astroparticle Physics 44 (Apr., 2013) 76–90, [1305.2478].
- [14] S. V. Biktemerova, A. A. Botvinko, N. P. Chirskaya, V. E. Eremeev, G. K. Garipov, V. M. Grebenyuk et al., Search for extreme energy cosmic ray candidates in the TUS orbital experiment data, ArXiv e-prints (June, 2017) , [arXiv:1706.05369].
- [15] TUS collaboration, P. Klimov et al., Ultra high energy cosmic rays detector TUS on-board Lomonosov satellite, in Proceedings, 33rd International Cosmic Ray Conference (ICRC2013): Rio de Janeiro, Brazil, July 2-9, 2013, p. 0406, 2013.
- [16] A. A. Grinyuk, A. V. Tkachenko, L. G. Tkachev and TUS Collaboration, The TUS orbital detector optical system and trigger simulation, Journal of Physics Conference Series 409 (Feb., 2013) 012105.
- [17] A. Grinyuk, V. Grebenyuk, B. Khrenov et al., The orbital TUS detector simulation, Astroparticle Physics 90 (2017) 93–97.
- [18] P. A. Klimov, M. I. Panasyuk, B. A. Khrenov, G. K. Garipov, N. N. Kalmykov, V. L. Petrov et al., The TUS detector of extreme energy cosmic rays on board the Lomonosov satellite, Space Science Reviews (8, 2017) 1–17.
- [19] “Hamamatsu R1463 photomultiplier tube datasheet.” https://www.hamamatsu.com/resources/pdf/etd/R1463_TPMH1349E.pdf.
- [20] C. Berat, S. Bottai, D. De Marco, S. Moreggia, D. Naumov, M. Pallavicini et al., Full simulation of space-based extensive air showers detectors with ESAF, Astroparticle Physics 33 (May, 2010) 221–247, [arXiv:0907.5275].
- [21] R. Chadyšienė and A. Girgždys, Ultraviolet radiation albedo of natural surfaces, J. of Environmental Engineering and Landscape Management 16 (2008) 83–88.
- [22] R. K. Said, U. S. Inan and K. L. Cummins, Long-range lightning geolocation using a VLF radio atmospheric waveform bank, Journal of Geophysical Research (Atmospheres) 115 (Dec., 2010) D23108.
- [23] R. Said and M. Murphy, GLD360 upgrade: Performance analysis and applications, in 24th Int. Lightning Detection Conf. and Sixth Int. Lightning Meteorology Conf. (V. San Diego, CA, ed.), American Institute of Physics Conference Series, p. 8pp, 2016, https://my.vaisala.net/en/events/ildcilmc/archive/Pages/ILDCILMC-2016-Archive.aspx.
- [24] P. A. Klimov, M. Y. Zotov, N. P. Chirskaya, B. A. Khrenov, G. K. Garipov, M. I. Panasyuk et al., Preliminary results from the tus ultra-high energy cosmic ray orbital telescope: Registration of low-energy particles passing through the photodetector, Bulletin of the Russian Academy of Sciences: Physics 81 (Apr, 2017) 407–409.
- [25] M. Y. Zotov, First results of the tus orbital detector of extreme-energy cosmic rays, Physics of Particles and Nuclei 49 (Jul, 2018) 612–616.
- [26] L. Tkachev and Lomonosov-UHECR/TLE Collaboration, Search for EAS candidates with the TUS/Lomonosov orbital experiment: results of preliminary data reconstruction and analysis, in Proceedings of Science (ICRC2017), no. 527, 2017.
- [27] L. Spitzer, On the origin of heavy cosmic-ray particles, Phys. Rev. 76 (Aug, 1949) 583–583.
- [28] S. Hayakawa, Dust grain origin of cosmic ray air showers, Astrophysics and Space Science 16 (May, 1972) 238–240.
- [29] L. A. Anchordoqui, Cosmic dust grains strike again, Phys. Rev. D 61 (Mar, 2000) 087302.
- [30] F. Capel, A. Belov, M. Casolino and P. Klimov, Mini-EUSO: A high resolution detector for the study of terrestrial and cosmic UV emission from the International Space Station, Advances in Space Research 62 (2018) 2954–2965, [1709.00405].
- [31] P. Klimov and Lomonosov-UHECR/TLE Collaboration, Status of the KLYPVE-EUSO detector for EECR study on board the ISS, in Proceedings of Science (ICRC2017), no. 412, 2017.
- [32] A. V. Olinto et al., POEMMA: Probe Of Extreme Multi-Messenger Astrophysics, PoS (2017) 542, [arXiv:1708.07599].