Study of radioactivity built-up and decay with singles time-stamped data
Abstract
Time-stamped data have been used to estimate the decay half-lives of radioactive 118mSb and 64,66,68Ga nuclei. These nuclei are populated through the reaction 4He (Elab = 32 MeV) + natIn and p (Elab = 10 MeV) + natZn, respectively. The -rays emitted by the excited daughter nuclei are detected by a single high purity germanium (HPGe) detector and the data are acquired using a CAEN 5780M desktop digitizer. Half-lives of different orders of magnitudes for the above mentioned nuclei are obtained from both the decay of parent and the growth of daughter nuclei. It is observed that the half-lives obtained from both these techniques match fairly well and also are consistent with the reported values. It is demonstrated that the time-stamped data can be useful while studying certain half-lives which are too long for measurement using in-beam electronic technique and too short for decay studies in off-beam methods. The data also have a special relevance for constant monitoring of beam current and beam-tuning.
keywords:
: Gamma detectors (scintillators, CZT, HPGe, HgI etc); Interaction of radiation with matter; Data processing methods1 Introduction
The decay half-life of a radioactive nucleus is one of the fundamental observable in nuclear spectroscopy. Lifetimes of radioactive nuclei are related to transition probabilities which give a quantitative estimation of the overlap of two wavefunctions (parent and daughter states) being connected by a transition (-decay, say) operator. In several astrophysical processes, -decay of exotic nuclei plays decisive role in the path of nucleosynthesis. Although study of -decay half-lives has been pursued since long, there are still uncertainties in experimental results, even for nuclei close to the line of stability. For reliable theoretical predictions, especially for exotic nuclei, precise experimental data in this field is most important. These transition probabilities also provide a wealth of information about the parent and daughter nuclei such as their internal structure, shape, deformation. Reproduction of level lifetimes (electromagnetic transition probabilities) and -decay half-lives (decay due to weak interaction), thus in turn, provide crucial tests for validation of various theoretical models. Therefore, the precise measurement of lifetime is of key importance.
Recently, the impressive evolution in digital electronics, particularly the availability of high precision flash Analog to Digital Converters (ADC) and Field Programmable Gate Array (FPGA) has stimulated the usage of digital pulse processing (DPP) method in nuclear spectroscopy at a significant rate [1, 2].
In general, to measure short-lived activities, targets are irradiated for specific periods of time compatible to estimated half-lives. Decay data are then acquired in appropriate time steps to determine the half-lives. However, for a situation where a set of nuclei are populated having unknown half-lives, spanning a range from minutes to days, it is sometimes difficult to choose a time step for counting. In the present work, the half-lives of different nuclei (118mSb, 64Ga, 66Ga and 68Ga) with half-lives ranging from few minutes to several hours, have been determined from singles time-stamped data. Data from two different experiments have been used to demonstrate the effectiveness of the present technique. The data have been accumulated in an off-line experiment after irradiation and also continuously from in-beam to off-beam condition during an in-beam experiment. Later by analyzing list mode singles data with time-stamp, we could determine the half-lives of different orders and also could clearly differentiate the in-beam and off-beam situations.
The measured half-lives have been compared with earlier results [3] obtained using standard techniques with analog electronics in order to test the applicability of the present technique.
2 Experimental details
Two different experiments were performed to acquire the necessary data. Both of them have been done at Variable Energy Cyclotron Centre (VECC), Kolkata. One of them involved decay spectroscopic study of long-lived isotopes populated through irradiation. The other experiment was an in-beam study.
2.1 Experimental Setup: Detector and Data acquisition
An HPGe detector has been used to measure the decaying -rays from the excited target. Experimental data have been acquired using a CAEN 5780M [4] desktop digitizer (14 bit, 16k channel and 100 MS/s). The desktop module houses two high voltage power supplies of opposite polarities (5 kV, 300 A) and two preamplifier power supplies (12 V, 24 V). It is well equipped with DPP-PHA (Digital Pulse Processing-Pulse Height Analyzer) firmware that enables it to provide not only precise energy and timing information but also a portion of waveform and the other traces for fine-tuning of PHA settings [4].
The exchange of data and control command between the digitizer and personal computer was executed by connecting an USB cable. The digitizer can also be connected via a CAEN proprietary optical bus. Via USB, the data can be transferred up to a rate of 30 MB/s, whereas optical link offers Daisy-chain capability with a transfer rate up to 80 MB/s [4]. As in our case, the digitizer is connected only with a single detector, using USB cable is the simplest choice.
The output signal of the detector is directly fed into real-time digital pulse processing system (DPP), which is based on high speed digitizer, digital filter and analog to digital (A/D) converters (ADC). In contrast to conventional system (where A/D conversion takes place subsequent to analog processing), in these DPP units, A/D conversion is performed as early as possible without affecting the quality of the signal. In the present digitizer, the signals are continuously sampled at 100 MHz rate and the pulse heights are saved with 14 bit precision. The readout or digital processing is mainly handled by dedicated algorithms implemented in FPGAs, such as digital filters, pulse shapers, constant fraction discriminators, analog to digital converters etc. These algorithms are used to extract different necessary parameters like amplitude or the arrival time of the detected pulse from large data streams. Whenever the pulse height crosses the set threshold value, a trigger is generated. Pulse shaping procedure starts using a trapezoid filter [5], that is applied on an input signal to transform the typical exponential pulse produced by charge sensitive preamplifier into trapezoidal shape. Basically, the pulse height difference between the flat top of trapezoid and signal base line is proportional to the amplitude of input pulse containing information of energy released by the incident radiation ( in the present case) in the detector. The role played by this filter is analogous to traditional Shaping Amplifier. The Pulse Height Analysis (PHA) algorithm includes online baseline restoration, ballistic effect correction and manage the pile-up of online data acquisition [4].
To determine the arrival time of the pulse, use of constant fraction discriminator (CFD) in the conventional system is replaced by an algorithm that calculates the second derivative of the input signal. The purpose of the derivation is to subtract the baseline part to avoid low frequency fluctuation. The zero crossing of the pulse is independent of pulse amplitude [4]. The zero crossing of the second derivative of input signal provides accurate arrival-time with an uncertainty equivalent to one unit of sampling time [6]. Whenever the pulse crosses the base line, a trigger signal is generated, producing a time-stamp. The digital time-stamped data are saved with 10 ns time resolution.
2.2 Methodology
The half-life of the parent nucleus (an isomeric state in case of 118Sb) is generally determined from its decay which follows the equation
| (1) |
where N is the number of parent nuclei present at time t = 0 and is decay constant which represents the rate at which the parents transmute to the daughter nuclei.
The above equation can be also written as
| (2) |
For a stable daughter (or if the decay half-life of daughter is much much larger than that of parent), one can also generate the growth curve of daughter nuclei from the data instead of following the decay of the parent nuclei. In this process, the number of daughter nuclei produced will increase exponentially and reach a saturation value following the relation
| (3) |
where N is the number of daughter nuclei produced in time t. The half-life can be obtained either from the decay of parent nuclei or growth of daughter nuclei. The variation of count rate as a function of time is considered in case of the decay of parent nucleus, while the growth of the daughter nucleus is obtained by accumulating the data by increasing the time-bin of digitizer time-stamped data. In the present study, we have followed both the decay of parent nucleus and the growth of daughter nucleus.
To follow decay, the count rates at different instants of time are determined from experimental data. Let, be the starting time of measurement at which the count rate is first measured. Usually spectra for small intervals of time () starting from the initial time of counting are generated ( to , to ) and areas under the most intense -peak in these decay spectra are plotted as a function of time.
However, in the present work, somewhat different technique has been adopted for convenience in analysis of time- stamped data. From till the end of counting, same time interval () has not been considered for all instants. Instead of time, number of total events in the decay spectra are kept constant and thus the time bins at different instants varied. This means that at the beginning of the decay, the rate is faster and smaller time bins are needed to have 3 million (3M say,) decay events. On the other hand as time proceeds, same number of events result from longer time bins. Finally, count rates (number of decay events/ time of accumulation) for each of these bins are calculated and plotted as function of time to get the half-life.
The earlier equation (Eqn. 1) thus reduces to,
| (4) |
The decay constant or half-life is determined by fitting the curve with the exponential function (Eqn. 4) by using -minimization to ensure best fit.
For growth, spectra for equal number of decay events corresponding to different intervals of are added consecutively starting from the initial time of counting (i.e. to , to + …) and a set of growth spectra are generated. Thus, as time proceeds, the area of the -peak of interest increases i.e. statistics improves and error decreases.
The time-stamped data recorded using the digital data acquisition system have been used to determine the nuclear lifetime of the other nuclei having short half-lives (short enough to measure after stopping the beam and long enough for electronic timing measurement) produced in an in-beam reactions. Artificial radioactivity can be produced through a nuclear reaction, by bombarding highly energetic beam (such as proton, neutron, alpha particles or heavy ions) on a stable nucleus (used as a target). The stable target nuclei () are transformed into radioactive nuclei () that decay to another stable nucleus (). In general, the accumulation of radioactivity during the irradiation process can be expressed as the difference between the rates of production of the radioactive nucleus and its spontaneous radioactive decay. The rate of production of a particular residual nucleus () is proportional to the flux of beam (), the activation cross-section () and the number of target atoms (Nt). These residual radioactive nuclei also start decaying as soon as they are produced. In an in-beam experiment, data have been accumulated continuously from in-beam to off-beam condition. After the beam stopped, the decay rate of the short-lived isotopes have been determined without removing the target from the reaction chamber.
2.3 Data Analysis
The ‘LIST mode’ approach of digital acquisition is advantageous as it provides a sequential list of events with measured characteristics as needed by the user (energies and corresponding time information, as defined in the present experiment). By selecting a proper time window, the list mode data have been sorted. To analyze the list mode file and to generate histograms of energies within specific time windows, [7] software package was used. For each group, a definite number of events (say, 20k) are sorted to create histogram that simply corresponds to the decay spectrum for the desired time interval. The time resolution of the time-stamp is 10 ns. So, 20k events, in general, should correspond to a time interval of at least 200 s. The exact time difference is determined by taking the difference between the last and first time-stamps of each set of 20k events. Thus, depending on the expected half-life of the radioactive nucleus, the time-interval for saving consecutive decay spectra to follow the decay can be suitably chosen.
In the present work (Fig. 1), event binning has been chosen such that reasonably good statistics remains even at the end of the decay. However, that reduces number of data points in the decay curve. On the other hand, smaller event binning yields larger number of data points in the decay curve, thus resulting in better fitting in some cases (Table 1). But the error in the area of each peak increases for smaller bin. So, an optimization is needed depending on the source strength and half-life.
For analysis of the decay spectra, INGASORT [8] software was used. The uncertainties shown in the Tables are arising from the errors in the fitting parameters. However, while fitting the decay curves as shown in the figures, we have included the experimental errors (primarily statistical errors in the areas) in the data points. No systematic error has been considered.
3 Specific Experiments and Results
3.1 Experiment 1: Activation analysis
The irradiation experiment has been performed at Variable Energy Cyclotron Centre, Kolkata using -beam from the K-130 cyclotron. A natural indium (115In (95.71%), 113In (4.29%)) [9] target of thickness 54 m is irradiated by -beam of 32 MeV energy. The 118Sb is the strongest populated nucleus in this experiment. The ground state of 118Sb has a half-life of 3.6 (1) min, whereas one of its high spin ( = 8-) low energy isomeric state at 250 (6) keV excitation energy has a half-life of 5.00 (2) h [3] that decays via electron capture (EC) process to 118Sn. The irradiated foil has been carried to a nearby laboratory for counting purpose after reduction of activity to permissible limit to study the decay of this isomer. The data was collected by an 80% relative efficiency HPGe detector along with CAEN 5780M Digitizer.
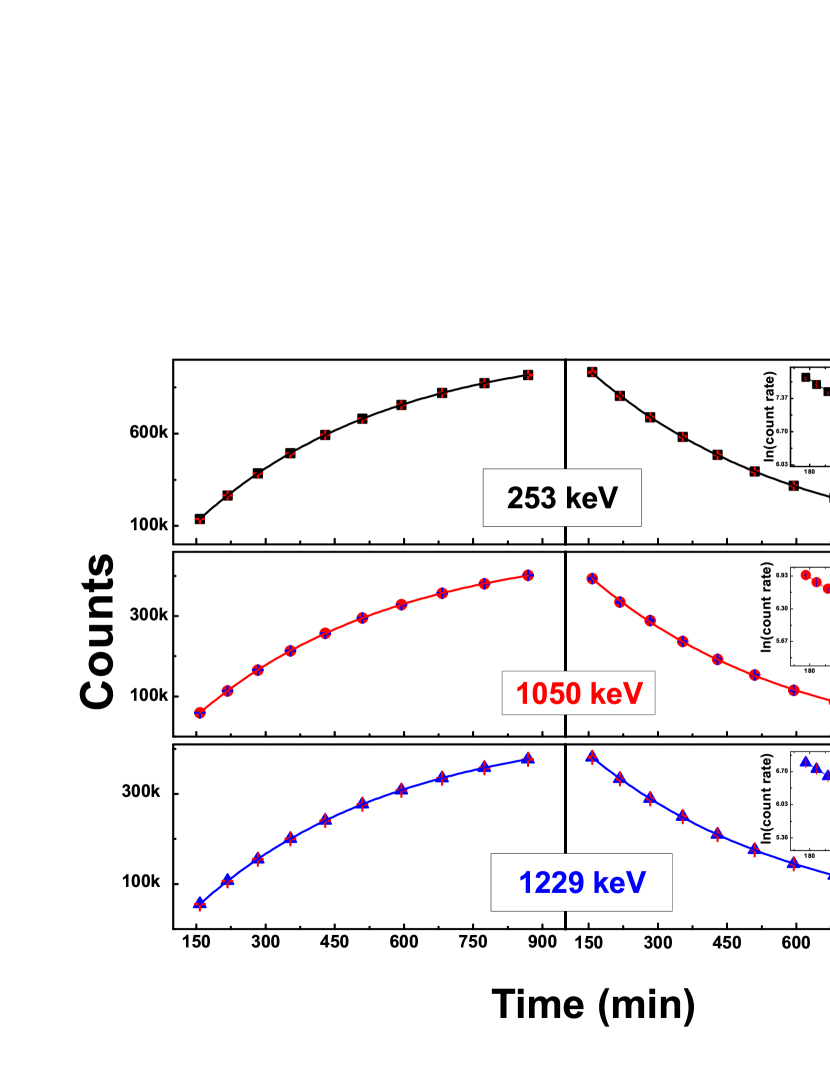
For 118mSb half-life measurement, the decay of parent nucleus (118mSb) and growth of daughter nucleus (118Sn) have been plotted for different -rays emitted by the daughter nucleus (Fig. 1). For the decay curves, as time proceeds beyond one or more half-lives the statistics in the peaks of interest diminishes. The half-lives have been determined by fitting these curves with a single exponential decay function (Eqn. 4). The are also plotted as a function of time and a linear fitting has been done to extract the half-lives. Both the results are shown in the Table 1. The linear fitting gives better results as shown in the Table 1. We also have compared the results for two different event bins (3M and 1M events). Smaller event bin results in better fitting as more number of data points are present in the decay curve. However, the error in the area of each peak increases consequently. So, one has to optimise the event bin to have more accurate result.
For growth of daughter nuclei, corresponding half-lives are determined by fitting the curves with the function mentioned in Eqn. 3. Table 1 shows that lifetime measured by these two different techniques are very similar. The present results are compared with the previous [10] results and they are found to match well. The half-lives determined from growth curve show better agreement with previous results. As expected, the change in the sizes of the event bins does not show much variation in the results for growth curves. Thus, it indicates that the time-stamped data of digital data acquisition system could be successfully used to evaluate the nuclear lifetime following the time evolution of the parent or daughter nucleus.
| Half-life (h) | ||||||||
| Energy | Prev. | Present | ||||||
| (keV) | [3] | |||||||
| Decay | Growth | |||||||
| Eqn. (4) | Linear 11footnotemark: 1 | Eqn. (3) | ||||||
| BIN122footnotemark: 2 | BIN233footnotemark: 3 | BIN122footnotemark: 2 | BIN233footnotemark: 3 | BIN122footnotemark: 2 | BIN233footnotemark: 3 | |||
| 253 | 5.28 (5) | 5.25 (8) | 4.95 (3) | 4.92 (2) | 4.87 (1) | 4.87 (1) | ||
| 1050 | 5.00 (2) | 5.18 (15) | 5.07 (10) | 5.20 (3) | 5.03 (2) | 5.00 (2) | 4.99 (1) | |
| 1229 | 5.36 (7) | 5.23(10) | 5.17 (2) | 5.11 (2) | 5.04 (1) | 5.04 (1) | ||
Determined from logarithmic plot.
22footnotemark: 2Event Bin of 3M.
33footnotemark: 3Event Bin of 1M.
3.2 Experiment 2: In-beam studies with CAEN digitizer
In-beam experiment has been performed at Variable Energy Cyclotron Centre, Kolkata, using proton beam from the K-130 cyclotron. The natural Zn target (Table 2) was bombarded by 10 MeV proton beam, populating the compound nuclei, viz., 65,67,68,69,71Ga isotopes, which de-excite by emitting one neutron and produce the residual nuclei 64,66,67,68,70Ga, respectively. The (p,n) reaction channel was the most dominant at this energy. The residual nuclei further undergo radioactive decay as shown in Table 2.
| Mass | Abundance | Decay mode | Half-life | -ray Energy (keV) |
|---|---|---|---|---|
| (A) | natZn[9] | (Error) | Intensity( %)11footnotemark: 1 | |
| 64 | 49.17% | EC | 2.627 min | 991.51 22footnotemark: 2 |
| (12) | (46) | |||
| 66 | 27.73% | EC | 9.49 h | 1039.22 22footnotemark: 2 |
| (3) | (37) | |||
| 67 | 4.04% | EC | 3.2617 d | 93.31 22footnotemark: 2 |
| (5) | (72.57) | |||
| 68 | 18.45% | EC | 67.71 min | 1077.34 22footnotemark: 2 |
| (8) | (3.22) | |||
| 70 | 0.61% | (99.59%) | 21.14 min | 1039.5133footnotemark: 3 |
| EC (0.41%) | (5) | (0.65) |
Absolute intensity per 100 decays.
22footnotemark: 2From corresponding Zn isotopes via electron capture (EC)-decay
33footnotemark: 3From 70Ge via -decay
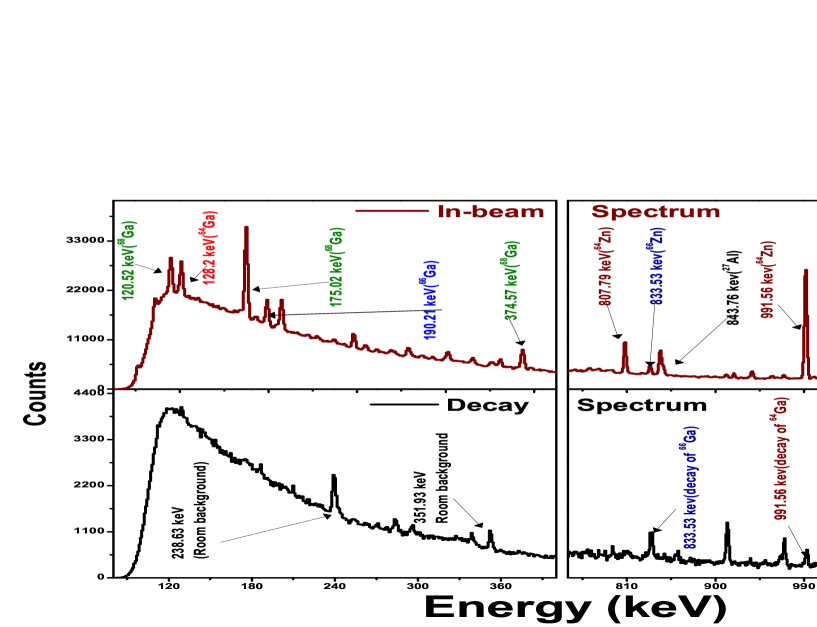
Thus, this experimental data contain information about the radioactive decay of nuclei having half-lives ranging from minutes to days. The -rays emitted by the excited states of nuclei produced in-beam as well as through decay (Fig. 2) are measured using a HPGe detector (with 20% relative efficiency) in singles mode with CAEN 5780 digitizer as discussed before (Sec.2). In order to study the in-beam process, the time evolution of count has been determined for strong transitions from 2+ to 0+ for 64,66,68Zn (991 keV, 1039 keV, 1077 keV) isotopes respectively. These -rays are emitted from excited levels of natZn isotopes populated by both natZn(p,p′)64,66,68Zn reactions, as well as from the decay of 64,66,68Ga isotopes populated through natZn(p,n) reactions. The 1014 keV ray is emitted from the de-excitation of 27Al first excited state populated via (p,p′) reaction. Aluminium is present in the target frame and other accessories in the chamber and thus can be considered as a measure of misalignment of the beam.
The variations in counts for different peaks have been plotted as a function of time (shown in Fig.3). Four -ray energies Eγ = 991, 1039, 1077 and 1014 keV correspond to the transition of 64Zn, 66Zn, 68Zn and 27Al (target holder material) respectively. As can be seen from Fig.3, the total counts under the -peaks remain almost the same during the BEAM-ON time. This is expected as there is no drastic change in beam parameters such as current intensity, beam focusing etc. [11].
For a specific target material, in general, the absolute area under the photopeak is dependent on the abundance of the particular isotope, cross-section of the reaction as well as on beam parameters like beam current incident on the target. Moreover, the time evolution of the yield of characteristic s emitted from the elements present in the target frame or the chamber can also provide information regarding beam tuning and focusing. Such details as a function of time can be obtained from these time-stamped data. Significant increase in the area of real peaks along with the beam-generated background peaks will be the evidence of an increase in beam current. Whereas, on the contrary, the increase in these background peaks compared to the real peak, will be an indication of poor beam focusing.
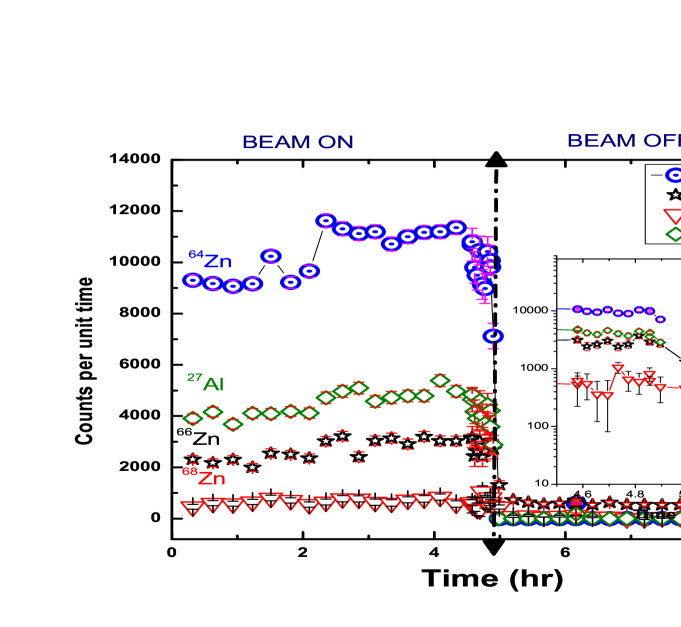
In the BEAM-OFF condition, data acquisition continued for 4 hours. Since the half-life of 64Ga is of the order of a few minutes, it decays much faster than 66,68Ga as can be seen in Fig. 3. It is also noticed that the peak area under 1014 keV goes to zero as an immediate effect of beam stop. The 27Al(p,n) reaction product 27Si has a half-life of 4.15 sec, which can also yield 1014 keV ray. However, the 27Si decays 99.7% to the ground state of 27Al. Thus, 1014 keV -ray is originating mostly from the in-beam excitation. From Fig. 3, the yield curves of different Zn isotopes follow the abundance ratio in natZn. Their de-excitation s have nearly the same energy, which ensures that the detector efficiency will be nearly the same.
| Mass | Energy | Half-life | |
|---|---|---|---|
| (keV) | |||
| Adopted [3] | Present work | ||
| 64 | 991 | 2.627 0.012 min | 2.61 0.15 min |
| 66 | 1039 | 9.49 0.03 h | 9.82 1.18 h |
| 68 | 1077 | 67.71 0.08 min | 70.30 3.57 min |
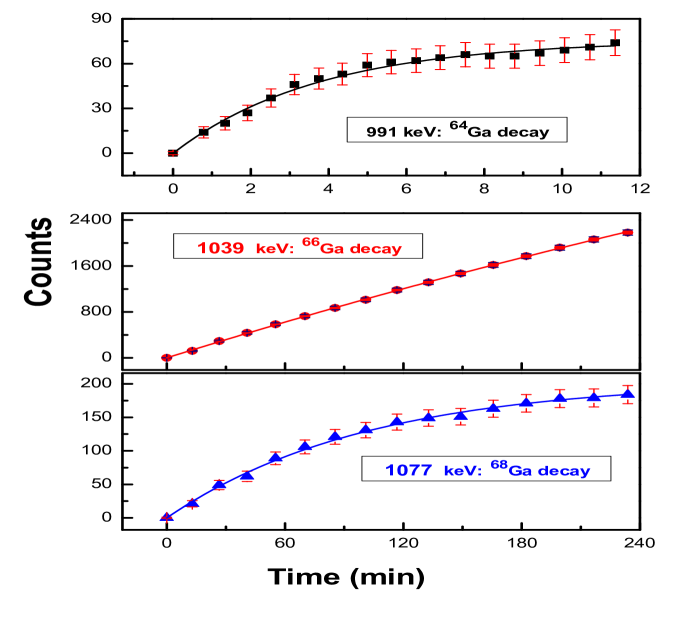
The half-lives of 64,66,68Ga isotopes have been extracted from the BEAM-OFF portion of the curve in Fig. 3. 67,70Ga decay data were not analysed due to long half-life (67Ga) and weak decay -ray (70Ga). In case of 64Ga, the growth curve (Fig. 4) is plotted for 12 minutes, beyond which it saturates. The growth curves (Fig. 4) of other two daughter nuclei (66,68Ga), have been plotted up to 4 h (depending upon the availability of data). The measured half-lives of 64Ga, 66Ga and 68Ga are tabulated in Table 3. The measured half-lives match reasonably well (Table 3) with the reported values [3]. In the case of 66Ga ( h), large deviation of half-life from the reported value is due to the time restriction of our data (only h data). For 68Ga, relatively lower abundance of 68Zn (Table 2) in natural Zn and lower intensity of the decay -ray increased the error in the result.
4 Discussions
The time-stamped singles data recorded using the digital data acquisition system has been used to estimate the nuclear lifetime by measuring the decay from an irradiated sample (118Sb). The half-lives have been determined from both the decay of parent nuclei and growth of daughter nuclei and the results are found to be consistent with the previously reported value. With progression of time, the count rate decreases inducing larger statistical error in the decay. On the other hand, building up growth curve is advantageous as it reduces relative statistical error by resulting in better fit. Furthermore, this technique has been applied to estimate shorter half-lives for other nuclei (64,66,68Ga) produced during the in-beam experiments in order to test the applicability. It is observed that the half-lives of 64,66,68Ga isotopes measured using the digitizer time-stamp match reasonably well with the values available in the literature.
5 Summary and conclusions
We have determined half-lives of 64,66,68Ga isotopes and that of an isomeric state of 118mSb nucleus, using digital time-stamped data acquired in singles mode. The half-lives of orders of minutes to days are determined from both the decay of parent and growth of daughter nuclei, and found to be consistent with the previously reported values. This demonstrates the effectiveness of time-stamped data for such measurements. It would be very interesting to check whether this technique is also reliable for lifetime measurement in the range of a few tens of nanoseconds, which could not be tested in the present work.
6 Acknowledgments
The authors gratefully acknowledge Mr. Pradipta Kumar Das of Saha Institute of Nuclear Physics (SINP) and the target preparation facility of TIFR for preparation of the target. We want to thank Mr. Pradip Barua for his technical help. The authors acknowledge fruitful discussions with Dr. D. Banerjee of VECC during their irradiation experiment. The effort of all INGA collaborators are highly appreciated.
References
- [1] X. Fléchard, E. Liénard, O. Naviliat-Cuncic, D. Rodríguez , M. A. G. Alvarez, G. Ban, B. Carniol, D. Etasse, J. M. Fontbonne, A. M. Lallena, and J. Praena, Measurement of the 8Li half-life, \hrefhttps://doi.org/10.1103/PhysRevC.82.027309 Phys. Rev C 82 (2010) 027309.
- [2] C. Fontbonne et al., High precision measurement of the 19Ne -decay half-life using real-time digital acquisition, \hrefhttps://doi.org/10.1103/PhysRevC.96.065501 Phys. Rev. C 96 (2017) 065501.
- [3] http://www.nndc.bnl.gov.
- [4] C. Tintori, WP2081 Digital Pulse Processing in Nuclear Physics, \hrefhttps://www.caen.it/documents/News/32/WP2081_digitalpulseprocessing_03.pdf Rev. 2.1, (2011); UM2606 DT5780 \hrefhttps://www.caen.it/products/dt5780/ Dual Digital MCA User Manual, Rev. 4.
- [5] V. T. Jordanov, G. F. Knoll, A. C. Huber, J. A. Pantazis, Digital techniques for real-time pulse shaping in radiation measurements, \hrefhttps://doi.org/10.1016/0168-9002(94)91652-7Nucl. Instrum. Meth. A 353 (1994) 261.
- [6] P. Mutti, M. Jentschel, E. Ruiz-Martinez, J. Ratel, F.Rey, W. Urban, A new fast triggerless acquisition system for large detector arrays, \hrefhttps://accelconf.web.cern.ch/accelconf/icalepcs2011/papers/wepmn025.pdfProceedings of ICALEPCS 2011, Grenoble, France (2011) 935.
- [7] MATLAB and Statistics Toolbox Release 2015a, The MathWorks, Inc., Natick, Massachusetts, United States.
- [8] R. Bhowmik, S. Muralithar, R. P. Singh, INGASORT, a new program for the analysis of multi-clover array, \hrefhttps://inis.iaea.org/search/searchsinglerecord.aspx?recordsFor=SingleRecord&RN=36070303 Proc. DAE-BRNS Symp. Nucl. Phys. (India) 44B (2001) 422.
- [9] J.K. Tuli, Nuclear wallet cards, 8th ed. October 2011, Brookhaven National Laboratory, USA.
- [10] H. H. Bolotin, A. C. Li, A. Schwarzschild, Level Structure of 118Sn and 120Sn from the Decay of Sb Isotopes,\hrefhttps://doi.org/10.1103/PhysRev.124.213 Phys. Rev. 124 (1961) 213.
- [11] S. Das, A. De, B. Dey, S. Sharma, A. Adhikari, S.S. Alam, A. Gupta, Y. Sapkota, A. Das, A. Saha, D. Pramanik, D. Banerjee, T. Bhattacharjee, A. Bisoi, S. Sarkar, and M. Saha Sarkar, Singles time-stamped data in in-beam spectroscopy,\hrefhttp://sympnp.org/snp2018/ Proc. DAE-BRNS Symp. Nucl. Phys. (India) 63 (2018) 1144.