DOD-ETL: Distributed On-Demand ETL for Near Real-Time Business Intelligence
Abstract
The competitive dynamics of the globalized market demand information on the internal and external reality of corporations. Information is a precious asset and is responsible for establishing key advantages to enable companies to maintain their leadership. However, reliable, rich information is no longer the only goal. The time frame to extract information from data determines its usefulness. This work proposes DOD-ETL, a tool that addresses, in an innovative manner, the main bottleneck in Business Intelligence solutions, the Extract Transform Load process (ETL), providing it in near real-time. DOD-ETL achieves this by combining an on-demand data stream pipeline with a distributed, parallel and technology-independent architecture with in-memory caching and efficient data partitioning. We compared DOD-ETL with other Stream Processing frameworks used to perform near real-time ETL and found DOD-ETL executes workloads up to 10 times faster. We have deployed it in a large steelworks as a replacement for its previous ETL solution, enabling near real-time reports previously unavailable.
1 Introduction
Today, there is a dire need for organizations to find new ways to succeed in an increasingly competitive market. There is no simple answer on how to achieve this goal. One thing is patently true, though: organizations must make use of near real-time and reliable information to thrive in the global market.
Business Intelligence (BI) is a term used to define a variety of analytical tools that provide easy access to information that support decision-making processes [17]. These tools perform collection, consolidation, and analysis of information, enabling analytical capabilities at every level inside and outside a company. Putting it another way, BI allows collected data to be unified, structured, and thus presented in an intuitive and concise manner, assisting organizations in corporate decision-making.
The Extract Transform Load (ETL) pipeline is a vital procedure in the Business Intelligence (BI) workflow. It is the process of structuring data for querying or analysis. ETL is made up of three stages, namely: data extraction, data transformation, and data loading where, respectively, data is extracted from their sources, structured accordingly, and finally loaded into the target data warehouse. Two processing strategies can be used in ETL process: (1) Batch and (2) Stream processing. The difference between them resides in whether the source data is bounded, by known and finite size, or unbounded (arriving gradually over time).
The integration of production systems and BI tools, which is a responsibility of ETL processes, “is the most challenging aspect of BI, requiring about 80 percent of the time and effort and generating more than 50 percent of the unexpected project costs” [34]. For all that, ETL is deemed a mission-critical process in BI and deserves close attention. Getting current, accurate data promptly is essential to the success of BI applications. However, due to the massive amount of data and complex operations, current ETL solutions usually have long run times and therefore are an obstacle to fulfilling BI’s requirements.
The main challenges of ETL lie on performance degradation at data sources during data extraction, and on performing complex operations on large data volumes in short time frames. The ideal solution has two conflicting goals: (1) cause no impact on data sources and (2) process data in near real-time as they are generated or updated. Ideal solutions should handle high-volume input data rates and perform complex operations in short time frames while extracting data with no operational overhead. Both batch and near real-time ETL process and its main characteristics are shown in Figure 1.
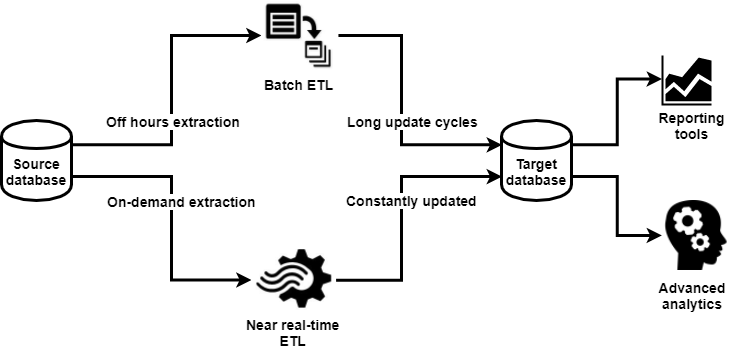
Sabtu et al. [27] enumerate several problems related to near real-time ETL and, along with Ellis [8], they provide some directions and possible solutions to each problem. However, due to these problems complexity, ETL solutions do not always address them directly: to avoid affecting efficiency on transaction databases, ETL processes were usually run in batches and off-hours (i.e., after midnight or weekends) and, by avoiding peak hours, the impact on mission-critical applications is mitigated. However, in a context where the delay to extract information from data determines its usefulness, BI tools and decision making are heavily impacted when the ETL process is executed infrequently.
In this paper, we propose DOD-ETL, Distributed On-Demand ETL, a technology-independent tool which combines modern frameworks with custom optimizations and multiple strategies to provide a near real-time ETL. DOD-ETL has minimum impact on the source database during data extraction, delivers a stream of transformed data to the target database at the same speed as data is generated or updated at the source, and provides scalability, being able to respond to data and complexity growth. We achieve all this by synergistically combining multiple strategies and technologies that were once used separately (e.g., in [18, 21, 37, 13]): log-based Change Data Capture (CDC), stream processing, cluster computing, an in-memory data store, a buffer to guarantee join consistency along with efficient data partitioning and an unified programming model. DOD-ETL works in a distributed fashion and on top of a Stream Processing framework, optimizing its performance.
We have developed a DOD-ETL prototype based on Kafka [15], Beam [1] and Spark Streaming [36]. We evaluate DOD-ETL’s performance executing the same workload on a Stream Processing framework with and without DOD-ETL. We have found that our solution, indeed, provides better performance when compared to an unmodified stream processing framework, being able to execute workloads up to 10 times faster without losing its core features: horizontal scalability and fault-tolerance. We have also tested it in a large steelworks as a replacement for its previous ETL solution. DOD-ETL has been able to speed up the ETL process from hours to less than a minute. This, in turn, enabled important near real-time reports that were previously impractical.
Our key contributions are: (1) a robust study and bibliographic review of BI and the ETL process; (2) the design and development of a general-use tool called DOD-ETL, using state-of-the-art messaging, cluster computing tools and in-memory databases; (3) application of DOD-ETL to the steel sector.
The remainder of this work is organized as follows. First, we discuss related work in Section 2. Then, Section 3 presents DOD-ETL and the assumptions under which it has been designed, detailing its implementation and optimization. We evaluate performance, scalability, and fault-tolerance in Section 4. And finally, we summarize our main findings and propose future work in Section 5.
2 Related Work
Due to the increasing pressure on businesses to perform decision-making on increasingly short time frames, data warehouses are required to be updated in real-time or on the shortest possible interval, not waiting for lower workload periods. This requirement leads to the concept of near real-time ETL, a challenging and important topic of research, whose primary definitions, problems and concepts were defined by Vassiliadis and Simitsis [32].
Other emerging concepts related to near real-time ETL are active data warehouses [30], [14] and real-time BI [2], [28], [24]. Both describe a new paradigm for business intelligence, in which data is updated in near real-time and both decision-making process as well as actions are performed automatically.
Both Wibowo [35] and Sabtu et al. [27] identify problems and challenges for developing near real-time ETL systems. Along with Ellis [8], they provide some directions within this topic for researchers and developers, proposing possible solutions to each challenge. According to Wibowo [35], there are problems on each stage of the ETL process that need to be handled to achieve near real-time ETL. Namely, data source overload, integration of heterogeneous sources, handling master data, and need for computational power to perform prompt operations.
Ellis [8] explains that dealing with near real-time ETL requires three key features to be addressed at each ETL phase: high availability, low latency, and horizontal scalability, which ensure that data will flow and be available constantly, providing up-to-date information to the business. They also enable ETL to always improve performance when needed by adding more servers to the cluster. Sabtu et al. [27] also point out the challenges that near real-time solutions faces but focus on multiple and heterogeneous data sources, data backups, inconsistency, performance degradation, data source overload and master data overhead.
Table 1 sums up these solutions and related problems, also described in detail below.
| Problem | Solution |
|---|---|
| Multiple data source integration | Stream Processing |
| Heterogeneous data source | Stream Processing |
| Backup data | Log-based CDC |
| Performance degradation | Log-based CDC |
| Data source overload | Update significance; Record change |
| Master data overhead | Master data repository; join optimization |
Mesiti et al. [18] take advantage of the Stream Processing paradigm, where processors can work concurrently, to integrate multiple and heterogeneous sensor data sources. This work takes the integration challenge to a more severe domain, where heterogeneity and multiplicity of data sources are accentuated: sensors as data sources. Naeem et al. [21] address near real-time ETL by proposing an event-driven near real-time ETL pipeline based on push technology and with a database queue. They also tried to minimize master data overhead by designing a new approach that manages them during the transformation stage: they divided data into master data, which are more static, and transactional data, which changes more often, and stored that master data on a repository. This strategy made its use more efficient during the transformation step.
Zhang et al. [37] proposes a new framework to process streaming data in healthcare scientific applications. Their framework (1) enables integration between data from multiple data sources and with different arrival rates and (2) estimates workload so it can plan for computational resources to scale appropriately. They extended the Hadoop [7] Map-Reduce framework to address the streaming data varied arrival rate. To estimate the unknown workload characteristics, they propose two methods to predict streaming data workload: smoothing and Kalman filter.
Waas et al. [33] propose a different approach for ETL with streaming. They first import raw records from data sources and only proceed with transformation and data cleaning when requested by reports, turning ETL into ELT. Therefore, data is transformed on-demand processing different data sets at different moments as required. To achieve this capability, they developed a monitoring tool to alert all connected components about new incoming data.
Many works focused on the master data overhead problem, where joins between the data stream and master data can lead to performance bottlenecks. To minimize these bottlenecks, they proposed optimizations strategies to these joins [25, 26, 3, 22].
As for data source overhead, Jain et al. [13] compared CDC proposals using two metrics to identify data source overload. They concluded that log-based CDC was the most efficient, having minimal impact on database performance and minimizing data loss.
The above-mentioned publications propose strategies to overcome the challenges related to the three main features of near real-time ETL solutions (high availability, low latency and horizontal scalability). Each one focusing on a specific problem and not all of them at once. However, the Stream Processing paradigm appears as a common denominator among most solutions, which is consistent with near real-time ETL requirements.
In this stream-based application context, multiple stream processing frameworks facilitate the development of such applications or are used directly to solve near real-time ETL requirements. Most of these frameworks are based on the record-at-a-time processing model, in which each record is processed independently. Examples of stream processors frameworks that use this model are Yahoo!’s S4 [23] and Twitter’s Storm [31].
In contrast to this record-at-a-time processing model, another possibility is to model it as a series of small deterministic batch computations, as proposed by Zaharia et al. [36] as the Spark Streaming framework. This way, among others benefits, integration with a batch system is made easy and performance overhead, due to record-at-a-time operations, is avoided. Flink [4] is currently competing with Spark Streaming as the open source framework for heavyweight data processing. It also merges, in one pipeline, stream and batch processing and it has features such as flexible windowing mechanism and exactly once semantics.
Besides these open source frameworks, there are those offered by cloud providers as services such as Google Dataflow [10] and Azure Stream Analytics [19]. By using these services, it is possible to avoid the installation and configuration overhead and the resources allocation to horizontal scalability gets simpler.
These open source frameworks and stream processing services are both designed for general use. Due to this one size fits all architecture, they lack strategies and optimizations that are used by DOD-ETL. In addition, while the above-mentioned publications propose solutions to a specific problem or challenge, DOD-ETL tries to combine them in a single tool.
3 DOD-ETL
DOD-ETL relies on an on-demand data stream pipeline with a distributed, parallel and technology-independent architecture. It uses Stream Processing along with an in-memory master data cache to increase performance, a buffer to guarantee consistency of join operations on data with different arrival rates, and a unified programming model to allow it to be used on top of a number of Stream Processing frameworks. Besides, our approach takes advantage of (1) data partitioning to optimize parallelism, (2) data filtering, to optimize data storage on DOD-ETL’s In-memory cache and (3) log-based CDC, to process data on-demand and with minimum impact on the source database. Therefore, DOD-ETL has: minimum impact on the source database during extraction, works in near real-time, can scale to respond to data and throughput growth and can work with multiple Stream Processing frameworks.
The insights that enable DOD-ETL to achieve the features mentioned above are: On-demand data stream—as data changes on the source database, they are processed and loaded into the target database, creating a stream of data where the ETL process handles, in a feasible time frame, only the minimum amount of necessary data. Distributed & parallel—perform all steps in a distributed and parallel manner, shortening processing time and enabling a proper use of the computer resources. In-memory cache—perform data transformations with no look-backs on the source database, providing all required data to execute calculations in the In-memory cache which avoids expensive communications with the data source. Unsynchronized consistency—a buffer guarantees that data with different arrival rates can be joined during transformation. Unified programming model—a programming model used to build data pipelines for both batch and streaming in multiple Stream Processing frameworks.
DOD-ETL merges into a single solution multiple strategies and techniques to achieve near real-time ETL that have are have never been integrated to this extent: log-based Change Data Capture (CDC), stream processing, cluster computing, and an in-memory data store along with efficient data partitioning (c.f. Section 2). We note that although these techniques have indeed been used before (e.g., in [18, 21, 37, 13])) they have not been previously integrated into a single solution. By synergistically combining these strategies and techniques DOD-ETL can achieve near real-time ETL.
3.1 Architecture
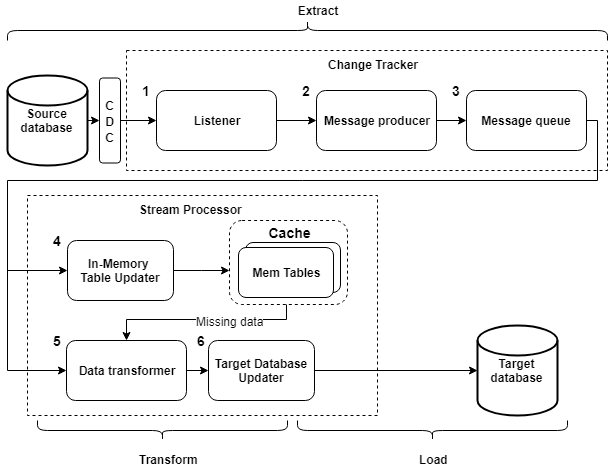
DOD-ETL has the following workflow (Figure 2): (1) it tracks changes on each source system’s database table and (2) sends these changes as messages to a (3) message queue, following a preconfigured partitioning criteria. Then, (4) these messages are pulled from the message queue and sent to the In-memory cache or (5) transformed to the target reporting technology format, and, finally, (6) loaded into the target database. DOD-ETL’s workflow can be grouped into two central modules: Change Tracker and Stream Processor.
All steps depend on configuration parameters to work properly. Thus, during DOD-ETL’s deployment, it is imperative to go through a configuration process, where decisions are made to set the following parameters: tables to extract—define which tables will have data extracted from; table nature—from the defined tables, detail which ones are operational (constantly updated) and which ones are master data (more static); table row key—column, from each table, that contains each row’s unique identifier; business key—column, from each table, that contains the values used to partition or filter data by a domain-specific key.
3.1.1 Change Tracker
The Change Tracker makes available to the Stream Processor module, at the same time that events occur, any data altered and added to the source database. This module makes use of CDC, a standard database pattern that contains all operations carried out over time and their respective values. Thus, whenever a record is inserted, altered, or removed from a table, the CDC writes that event, together with all of the record’s information.
CDC can take many forms, ranging from log files to structured tables in the database. They can be generated either by the database itself or by an external system. In this work, to be adherent to Jain et al.’s recommendations [13], log-based CDC was used. However, as explained later, the CDC reading step in DOD-ETL is performed by the Listener; thanks to DOD-ETL’s modular architecture, it is possible to create different Listeners to support different CDC implementations.
The Change Tracker works in three stages called Listener, Message Producer, and Message Queue. The Listener stage listens to the CDC changes and, with each new record, extracts its data to be further processed by Message Producer. This stage was built to extract data independently among tables, allowing it to be parallelized. As a prerequisite, then, Listener expects the CDC log to support this feature. The Listener step has minimum impact on the source database’s performance due to two factors: (1) only new and altered records are extracted at each execution, representing a lower data volume, and (2) queries are performed in log files only, which takes the pressure off the database and production tables. As this step has been designed to be decoupled from the others, it can be rebuilt to meet the specific characteristics of the source database, such as different technologies and CDC implementations.
The Message Queue works as a message broker and uses the publish/subscribe pattern with partitioning features, in which each topic is partitioned by its messages key. On DOD-ETL, a topic contains all insertions, updates and deletions of a table. The topic partitioning criteria vary by the table nature that the topic represents (master or operational). When dealing with master data tables, each topic is partitioned by its respective table unique row identifier and, when dealing with operational data, each topic is partitioned by the business key. This partitioning occurs at the Message Producer, before it publishes each extracted data, based on the aforementioned configuration parameters. Therefore, Message Producer builds messages from data extracted by the Listener and publishes them in topics on the Message Queue according to the preconfigured parameters. These two partitioning strategies (by row key and by business key) have the following objectives:
Row key: since the table unique row identifier is the topic partition key, Message Queue guarantees that the consumption of messages from a specific table row will happen in the right sequence. By calling the last message from each partitioning key (row id), it is possible to reconstruct the most recent table snapshot. In other words and, as shown in Figure LABEL:tts, each topic contains all insertions, updates and deletions from a table and it is partitioned by its id column. The last value from all partitions key represents the current table state.
Business key: the Stream Processor transformation process is parallelized based on the number of partitions defined by operational topics and their business keys. Therefore, the partitioning criteria has a direct impact on DOD-ETL’s performance. In this sense, it is paramount to understand in advance the extracted data and the nature of operations that will be performed by Stream Processor. The goal is to figure out the partitioning criterion and its key, because they may vary depending on the business nature.
3.1.2 Stream Processor
The Stream Processor receives data from the Listener by subscribing to all topics published on Message Queue, receiving all recently changed data as message streams. Stream Processor comprises three steps: (1) In-memory Table Updater, (2) Data Transformer and (3) Target Database Updater.
In-memory Table Updater prevents costly look-backs on the source database by creating and continuously updating distributed in-memory tables that contains supplementary data required to perform a data transformation. Data flowing from topics representing master data tables goes to In-memory Table Updater step. In-memory Table Updater only saves data related to the business keys assigned to its corresponding Stream Processor node, filtering messages by this key. By doing so, only data from keys that will be processed by each node are saved in its in-memory table, taking off pressure from memory resources. In case of node failures, data loss or both, Stream Processor retrieves a snapshot from Message Queue and repopulates in-memory tables that went down. This is possible due to the way each Message Queue master data topic is modeled: it is partitioned by the table’s unique row identifier, allowing In-memory Table Updater to retrieve, from Message Queue, an exact snapshot of this topic table.
Data Transformer receives data and performs operations to transform it into the required BI report format. Data Transformer can run point-in-time queries on the in-memory tables to fetch missing data necessary to carry out its operations, joining streaming and static data efficiently. Each partition is processed in parallel, improving performance. The operations executed in Data Transformer rely on the operators of the cluster computing framework (e.g., map, reduce, filter, group) and are business-dependent. Like In-memory Table Updater, not all messages go through this module, only messages from tables configured as operational. In the event of master data arriving after operational data (master and operational messages are sent to different topics and by different Listener instances), Data Transformer uses a buffer to store this late operational message for late reprocessing. At each new operational message, Data Transformer checks the buffer for late messages and reprocesses them, along with the current one. To optimize performance, Data Transformer only reprocesses buffer messages with transaction dates older than the latest transaction date from the In-memory cache, which avoids reprocessing operational messages that still have no master data As shown in more details in Section 4, DOD-ETL performance is highly dependant on the data model and transformation operations complexity. That is, the data and how it is transformed, in this case by Stream Processor, will determine DOD-ETL processing rate.
Target Database Updater translates the Data Transformer’s results into query statements and then loads the statements into the target database. For performance, the loading process also takes place in parallel and each partition executes its query statements independently.
3.2 Scalability, Fault-tolerance and Consistency
DOD-ETL takes advantage of the adopted cluster computing framework’s and the message queue’s native support for scalability and fault-tolerance. For the former, both DOD-ETL modules can handle node failures, but with different strategies: while Change Tracker focuses on no message loss, Stream Processor concentrates on no processing task loss. As for scalability, both depend on efficient data partitioning to scale properly.
Despite these inherited capabilities, some features had to be implemented on Stream Processor so fault-tolerance and scalability could be adherent to DOD-ETL’s architecture: the In-memory cache and the Operational Message Buffer have to be able to retrieve data from new nodes or from failed nodes. Regarding the In-memory cache, we implemented a trigger that alerts In-memory Table Updater when Data Transformer’s assigned business keys changes. On a change event, In-memory Table Updater resets the In-memory cache, dumps the latest snapshot from Message Queue and filters it by all assigned business keys. By doing so, the In-memory cache keeps up with Stream Processor reassignment process on failure events or even when the cluster scales up or down. As for the Operational Message Buffer, it uses a distributed configuration service, that already comes with Message Queue, to save its values so, in case of a node failure, other Stream Processor instances can keep up with reprocessing. That is, Operational Message Buffer saves all operational messages with late master data and, at each new message, Data Transformer tries to reprocess this buffer by checking at the In-memory cache if its respective master data arrived, solving the out-of-sync message arrival problem.
Since DOD-ETL focuses on delivering data to information systems, not operational mission-critical systems, transactional atomicity was not a requirement and it was left out of the scope of this work: rows of different tables added/altered in the same transaction can arrive at slightly different time frames. However, due to its late operational messages buffer, DOD-ETL can guarantee that only data with referential integrity will be processed and that those that are momentarily inconsistent will be eventually processed. As stated before, Data Transformer reprocesses all messages from the Operational Message Buffer when all needed data arrives on the In-memory cache.
3.3 Implementation
DOD-ETL is a tool with many parts: CDC, Listener, Message Queue, Stream Processor. While the Listener was built from scratch, CDC and Message Queue are simply out of the shelf products, and Stream Processor is a Stream Processing Framework with customizations and optimizations built on top of a unified programming model. Its implementation and used technologies are explained next.
All data exchanged between DOD-ETL modules are serialized and deserialized by the Avro system [6]. The Message Queue role was performed by Kafka [15], an asynchronous real-time message management system, whose architecture is distributed and fault-tolerant. Due to Kafka’s dependency on Zookeeper [11], it was also used on DOD-ETL.
Stream Processor was implemented with Beam [1], a unified programming model, which allows it to be used on top of Stream Processing frameworks such as Spark Streaming and Flink. Its steps, Data Transformer, In-memory Table Updater and Target Database Updater, were all encapsulated together to make communication between them easy. Data Transformer takes advantage of the already deployed Zookeeper to store its late operational messages buffer. It does so to guarantee that, in any failure event, another Stream Processor node could keep processing those late messages.
Regarding the In-memory cache, H2 [20] was used and deployed as an embedded database on the Stream Processor application. To support DOD-ETL’s needs, H2 was configured to work in-memory and embedded so, for each Spark worker, we could have an H2 instance with fast communication. Our prototype and its modules are publicly available.111https://github.com/gustavo-vm/dod-etl
Since DOD-ETL modules were designed to be decoupled, each one can be altered and replaced without impacting the others. Adding to this its technological-independent features, all selected technologies on each module can be replaced, provided that its requirements are satisfied.
4 Evaluation
We used, as a case study, a large steelworks and its BI processes. In this case, a relational database, powered by both its production management system and shop floor level devices, was used as the data source. This steelworks has the following characteristics: total area of 4,529,027 m2, a constructed area of 221,686 m2, 2,238 employees, and it is specialized in manufacturing Special Bar Quality (SBQ) steel.
This steelworks uses OLAP reports [5] as its BI tool. DOD-ETL was used to provide near real-time updates to these reports, which were unavailable; prior to DOD-ETL’s deployment reports were updated twice a day. DOD-ETL’s purpose was to extract data from the source database and transform them into OLAP’s expected model, known as star schema [9]. This transformation involves calculations of Key Process Indicators (KPIs) of this steelworks’ process. For this case study, the Overall Equipment Effectiveness (OEE) [29], developed to support Total Productive Maintenance initiatives (TPM) [16], and its related indicators (Availability, Performance, and Quality) were chosen as the steelworks KPIs.
TPM is a strategy used for equipment maintenance that seeks optimum production by pursuing the following objectives: no equipment breakdowns; no equipment running slower than planned; no production loss.
OEE relates to TPM initiatives by providing an accurate metric to track progress towards optimum production. That is, the following KPIs can quantify the above three objectives: availability—measures productivity losses, tracking the equipment downtime vs. its planned productive time; performance—tracks the equipment actual production speed vs. its maximum theoretical speed; quality—measures losses from manufacturing defects. These three indicators together result in the OEE score: a number that provides a comprehensive dimension of manufacturing effectiveness.
DOD-ETL extracted only the data needed to calculate these indicators. For this industry context, we grouped them into the following categories: production data—information of production parts; equipment data—equipment status information; quality data—produced parts quality information. During the DOD-ETL configuration process, two decisions were made: we defined the nature of each table (operational and/or master data) and decided which table column would be considered as the Stream Processor business partitioning key. Regarding the table nature, we considered the production group as operational and equipment and quality as master data. Due to this decision, all equipment and quality data sent to Stream Processor will be stored on its In-memory cache while production data will go straight to the Data Transformer step of the Stream Processor.
As for the business key, we considered the production equipment unit identifier, since all KPIs are calculated for it. We set, then, the column that represents and stores the related equipment unit code on each table as the business key in the configuration. This column will be used by operational topics for partitioning and by the In-memory cache as filter criteria.
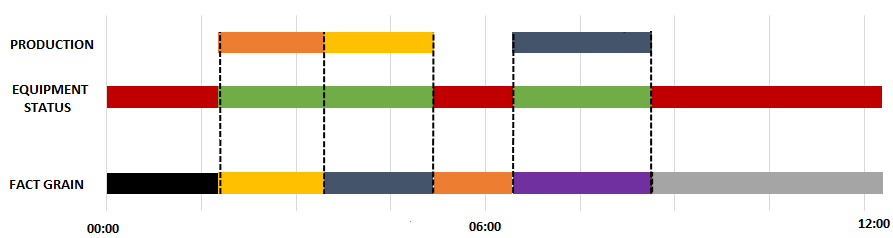
For this industry context, Data Transformer splits data as a requisite to support OLAP multidimensional reports. For the above mentioned KPIs, we defined the splitting criteria as its intersections in the time domain, in which the lowest granularity represents the intersection between all the data obtained for the equipment unit in question: Production, Equipment status and Quality. Figure 3 shows an example of this intersection analysis and data splitting. In this case, Data Transformer searches for intersections between equipment status and production data and breaks them down, generating smaller data groups called fact grain. In the Figure 3 example, these fact grains can be divided in two groups: (1) equipment with status ”off” and (2) equipment with status ”on” with production. As stated before, after the splitting process is completed, Data Transformer performs the calculations.
4.1 Experiments
To evaluate our DOD-ETL prototype’s performance, we used the Spark Streaming framework [36] as the baseline. We generated a synthetic workload, simulating the data sent by the steelworks equipment, and executed Spark with and without DOD-ETL on top of it. We have also performed experiments to check if DOD-ETL achieved Ellis [8] key features (high availability, low latency and horizontal scalability) and, as a differential of our work, we executed DOD-ETL with production workloads from the steelworks to check its behavior in a complex and realistic scenario.
In sum, we evaluated (1) DOD-ETL vs Baseline, checking how Spark performs with and without DOD-ETL on top of it; (2) horizontal scalability, analyzing processing time when computational resources are increased; (3) fault tolerance, evaluating DOD-ETL’s behavior in the event of failure of a compute node; (4) DOD-ETL in production, comparing its performance against real workloads and complex database models from the steelworks.
We used Google Cloud and resources were scaled up as needed, except for the fifth experiment that used the steelworks’s computing infrastructure. The following hardware and configurations were used: database – MySQL (with CDC log activated) deployed on an 8-core 10 GB memory instance; sampler – 20-core 18 GB instance; Change Tracker – 10-core 18 GB instance; Message Queue – seven instances, three for Kafka brokers and three for Zookeeper, with one core and 2 GB of memory each; Stream Processor – we deployed Spark in standalone mode with one master node and multiple worker nodes, which varied from one to twenty instances depending on the experiment (all Stream Processor instances had one core and 2 GB of memory each). All Google Cloud Platform instances had Intel Haswell as their CPU platform and hard disk drives for persistent storage. To represent the three data categories cited before, we used one table per data model group on experiments 1, 2 and 3. Regarding the fourth experiment, we used a more complex data model based on the ISA-95 standard [12].
Also for experiments 1, 2 and 3, as mentioned above, we built a sampler to insert records on each database table. This sampler generates synthetic data, inserting 20,000 records at each table, simulating the steelworks operation. To minimize the impact of external variables in these experiments, the Listener started its data extraction after the sampler finished its execution. To avoid impact on the results, Change Tracker extracted all data before the execution of Stream Processor, so Message Queue could send data at the same pace as requested by Stream Processor. Since Listener depends on the CDC log implementation, its data extraction performance also depends on it. We used MySQL as the database and its binary log as the CDC log.
4.1.1 DOD-ETL vs Baseline
Since DOD-ETL is comprised of out-of-the-shelf components, each module following a decoupled architecture. To evaluate DOD-ETL’s performance, each module needed to be analyzed separately.
As said before, Listener is highly dependant on the used database and CDC implementation and its performance is tied to them. Therefore, Listener has the CDC throughput as its baseline. Since the complete flow from writing to the database to copying it to the binary incurs a lot of I/O, Listener will always be able to read more data than CDC can provide.
Since Message Queue is an out-of-the-shelf product and can be replaced by any other product, provided that its requirements are satisfied, it can keep up with new benchmarks. As for now, Message Producer and Message Queue are instances of Kafka producers and Kafka brokers, respectively. Kreps et al. [15] already demonstrated its performance against other messaging systems.
The Stream Processor includes substantial customizations (Data Transformer, In-memory Table Updater and Target Database Updater) on top of the Spark Streaming framework. We evaluated its performance executing the same workload against Spark Streaming with and without DOD-ETL. We used a fixed number of Spark worker nodes (Table 2): a cluster with ten nodes.
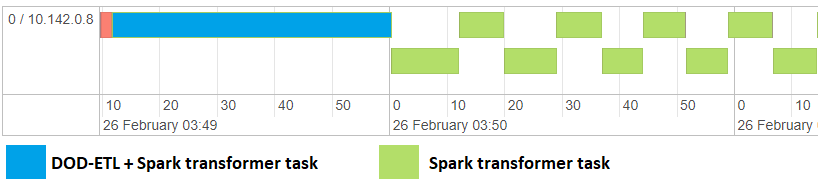
While DOD-ETL was able to process 10,090 records per second, Spark Streaming alone processed ten times fewer records (1,230 records/s). In order to understand in detail this performance difference, we analyzed the Spark job execution log, that shows the processing time in milliseconds of each Spark Worker task (Figure 4). Note that DOD-ETL has an initialization overhead at each Spark worker when it is started and when a new key or partition is assigned. Regarding the used dataset and infrastructure, this initialization overhead costs 40 seconds for each Worker.
Throughout these experiments, we were able to demonstrate that DOD-ETL customizations make Spark significantly faster. Although it has an initialization overhead, due to the In-memory Table Updater data dump from Message Queue, it is minimal and negligible considering the volume of processed messages.
4.1.2 Scalability
We evaluated the scalability of DOD-ETL’s Change Tracker and Stream Processor modules. Listener scalability, as stated before, also depends on the CDC log implementation. We performed two different experiments to evaluate Listener’s performance: (1) Inserted data on extracted tables only, where insertions were made only in databases that we were extracting data, so the number of inserted and extracted tables increased at the same time (from 1 to 16); and Fixed number of inserted tables, where insertions were made in a fixed number of tables (16) and the number of extracted tables was increased (from 1 to 16).
As shown in Figure 5, where number of records inserted per second was plotted against the number of tables, Listener had different results on each experiment: When inserting data on extracted tables only, Listener’s performance increased as a sublinear function and then saturated at 18,600 records per second for eight tables. When using a fixed number of tables, it increased linearly until it also saturated when extracting simultaneously from eight tables, with a throughput of 10,200 records per second. This behavior is directly related to MySQL’s CDC implementation, where it writes changes from all tables on the same log file, so each Listener instance had to read the whole file to extract data from its respective table. Throughput is higher in the first experiment compared to the second experiment because of the difference in log file size: while in the fixed insertions experiment the CDC log file had a fixed size of 320,000 records, the varying insertion experiment log file varied from 20,000 records to 320,000 records. Therefore, going through the whole log file took less time until it matched at 16 tables. Regarding the saturation point, this happened due to MySQL performance and we conjecture it will vary across different databases and CDC implementations.

As already stated, Message Producer and Message Queue are instances of Kafka producers and Kafka brokers, respectively. Kreps et al. [15] already demonstrated that each producer is able to produce orders of magnitude more records per second than Listener can process. Regarding its brokers, their throughput is dictated more by hardware and network restrictions than by the software itself, also enabling it to process more records.
To evaluate Stream Processor’s scalability, we varied the number of available Spark worker nodes from one to twenty and fixed the number of partitions on the operational topic at twenty. To maximize parallelization, the number of equipment units (partition keys) from the sampled data followed the number of topic partitions: sampled data contained 20 equipment unit identifiers, used as partition keys. We used the Spark Streaming Query Progress’ metric average processed rows per second at each of its mini batch tasks. As shown in Figure 6, where the number of processing records per seconds was plotted against the number of Spark Workers.
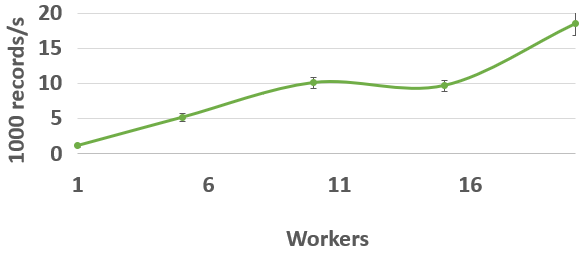
DOD-ETL modules are scalable: both Change Tracker and Stream Processor can absorb growth by adding more computational resources, despite their difference in throughput and scalability factor. While Change Tracker scales proportionally to the number of tables, Stream Processor scales with the number of partition keys on operational tables.
Regarding Change Tracker, we saw that Listener and Message Producer can process tables independently and that it can scale up as the process incorporates new ones, provided that the database CDC log supports it. As for Message Queue, it also scales linearly but based on multiples variables: the number of available brokers, extracted tables (topics), partitions, and keys.
Stream Processor’s scalability is proportional to the number of partitions at the operational table topics and the number of partitioning keys that, on this steelworks case, are the total number of production equipment units. Data partitioning plays a vital role here, so, it is imperative to understand functionally and in advance all extracted data in order to find partitioning criterion and its key, which varies from business to business. Since Message Queue supports throughput orders of magnitude higher than Listener and Stream Processor, it is possible to integrate multiple database sources and use multiple Stream Processor instances, each performing different transformations.
4.1.3 Fault Tolerance
We have executed DOD-ETL in a cluster with five worker nodes and, midway through the experiment, we shut down two of the worker nodes to evaluate DOD-ETL’s fault tolerance. We measured the rate of processed messages before and after the shutdown and performed a data consistency check on the result. We used the same performance metric as the scalability experiment (Table 2).
Stream Processor went from processing 5,060 messages per second to 2,210, representing a processing rate decrease of 57%. After each execution, we checked the consistency of all messages processed by this module and did not find any error: it processed all messages correctly, albeit at a reduced rate. This result indicates that DOD-ETL is fault tolerant, which significantly increases its robustness.
While the number of available clusters was changed from 5 to 3, a 40% decrease, the performance decrease was more significant (57%). By analyzing the Spark execution log, we found that the In-memory cache also impacts fail-over performance: when a node becomes unavailable and a new one is assigned, the In-memory cache has to dump all data from the newly assigned partition keys, which impacts performance.
Since the Change Tracker and the Stream Processor were built on top of Kafka and Spark, respectively, both modules can resist node failures. Due to their different purposes, each module uses distinct strategies: while Kafka can be configured to minimize message loss, Spark can be configured to minimize interruption of processing tasks.
4.1.4 DOD-ETL in production
We executed DOD-ETL with real workloads from the steelworks. This workload is generated by both a production management system and shop floor level devices and its data model is based on the ISA-95 standard, where multiple tables are used to represent each category (production, equipment and quality). We compared DOD-ETL results on previous experiments (Table 2), where synthetic data was used with a simpler data model (a single table for each category of data), with DOD-ETL executing real and complex data.
| Baseline | Fault Tolerance | Production | |||
| DOD-ETL | Spark | Normal | Failure | Simple Wkld | Real Wkld |
| 10,090 | 1,230 | 5,063 | 2,216 | 10,090 | 230 |
Both synthetic and production experiments used the same configuration: a cluster with ten Spark worker nodes. While DOD-ETL can process 10,090 records per second for the data source with simple model complexity, this number decreases to 230 records per second for the complex data model. It is possible to state, then, that data model complexity impacts directly on DOD-ETL performance. Since it depends on the In-memory cache to retrieve missing data, when this retrieval involves complex queries, this complexity impacts on the query execution time and, therefore, on DOD-ETL performance.
This steelworks currently uses an ETL solution to perform the same operation performed by DOD-ETL. It adopts a sequential batch approach, comprises a series of procedures ran within the relational database server, and relies on a twelve core /32 GB memory server. While DOD-ETL takes 0.4 seconds to process 100 records, this solution takes one hour. Although it is not a a fair comparison (a streaming distributed and parallel tool vs a batch and legacy solution), it is important to demonstrate that DOD-ETL can be successfully used in critical conditions and to absorb the steelworks data throughput, providing information in near real-time to its BI tools.
Considering the author’s experience in developing mission critical manufacturing systems and its knowledge in the ISA-95 standard, his opinion regarding these systems data modeling is that the drawbacks of using a standardized and general data model, that seeks a single vision for all types of manufacturing processes, far outweigh the benefits. Manufacturing systems that use generalized data models get way more complex when compared with process-specific models. These systems performance, maintenance and architecture get severely impacted in order to provide a generic model.
Therefore, in this industry context, a more straightforward data model could be used in production management systems and shop-floor without drawbacks. With this, DOD-ETL would perform even better, in addition to the factory systems.
5 Conclusion
DOD-ETL’s novelty relies on synergistically combining multiple strategies and optimizations (that were previously only used separately) with an on-demand data stream pipeline as well as with a distributed, parallel, and technology-independent architecture.
ETL systems need to have three key features to work in near real-time: high availability, low latency, and scalability. DOD-ETL has been able to achieve all three key features and address these challenges by combining log-based Change Data Capture (CDC), stream processing, cluster computing, an in-memory data store, a buffer to guarantee join consistency along with efficient data partitioning, and a unified programming model.
We have been able to demonstrate, by performing independent experiments on each of its main modules, that DOD-ETL strategies and optimizations reduce ETL run time by a factor of ten, outperforming unmodified Stream Processing frameworks. Through these experiments, we showed that DOD-ETL achieves these results without sacrificing scalability and fault-tolerance. We have also found that data source model complexity heavily impacts the transformation stage and that DOD-ETL can be successfully used even for complex models.
Due to its technology-independence, DOD-ETL can use a number of Stream Processor frameworks and messaging systems, provided that its requisites are satisfied. This allows DOD-ETL to adapt and evolve as new technologies arrive and avoid technology lock-ins.
Instantiating DOD-ETL requires customizing the Data Transformer step: each required transformation is translated as Spark operators which, in turn, are compiled as a Java application. This requires DOD-ETL’s users to know how to program, restricting its use. To overcome this, on future work, DOD-ETL will be adapted to integrate a friendly user interface with an intuitive and visual configuration of Data Transformer transformation operations.
Also on future work, we will study the impact on DOD-ETL performance when lightweight Stream Processing frameworks are used, such as Kafka Streams and Samza, by performing new experiments. By doing so, we will be able to compare and evaluate the trade-offs between these two types of frameworks (lightweight vs heavyweight) and its impact on DOD-ETL proposed strategies and optimizations.
In sum, through this work, we were able to achieve near real-time ETL by combining multiple strategies and technologies, to propose a general use tool and to evaluate it in the metals industry context.
References
- Apache [2015] Apache. Apache Beam. https://beam.apache.org/, 2015.
- Azvine et al. [2006] B. Azvine, Z. Cui, D. D. Nauck, and B. Majeed. Real time business intelligence for the adaptive enterprise. In E-Commerce Technology, 2006. The 8th IEEE International Conference on and Enterprise Computing, E-Commerce, and E-Services, The 3rd IEEE International Conference on, pages 29–29. IEEE, 2006.
- Bornea et al. [2011] M. A. Bornea, A. Deligiannakis, Y. Kotidis, and V. Vassalos. Semi-streamed index join for near-real time execution of etl transformations. In Data Engineering (ICDE), 2011 IEEE 27th International Conference on, pages 159–170. IEEE, 2011.
- Carbone et al. [2015] P. Carbone, A. Katsifodimos, S. Ewen, V. Markl, S. Haridi, and K. Tzoumas. Apache flink: Stream and batch processing in a single engine. Bulletin of the IEEE Computer Society Technical Committee on Data Engineering, 36(4), 2015.
- Codd et al. [1993] E. F. Codd, S. B. Codd, and C. T. Salley. Providing olap (on-line analytical processing) to user-analysts: An it mandate. Codd and Date, 32, 1993.
- Cutting [2009] D. Cutting. Apache Avro. https://avro.apache.org/, 2009.
- Dean and Ghemawat [2008] J. Dean and S. Ghemawat. Mapreduce: simplified data processing on large clusters. Communications of the ACM, 51(1):107–113, 2008.
- Ellis [2014] B. Ellis. Real-time analytics: Techniques to analyze and visualize streaming data. John Wiley & Sons, 2014.
- Giovinazzo [2000] W. A. Giovinazzo. Object-oriented data warehouse design: building a star schema. Prentice Hall PTR, 2000.
- Google [2015] Google. Google Dataflow. https://cloud.google.com/dataflow/, 2015.
- Hunt et al. [2010] P. Hunt, M. Konar, F. P. Junqueira, and B. Reed. Zookeeper: Wait-free coordination for internet-scale systems. In USENIX annual technical conference, volume 8, page 9. Boston, MA, USA, 2010.
- International Society of Automation [2001] International Society of Automation. Enterprise-Control System Integration Part 2 : Object Model Attributes. Isa, 2001.
- Jain et al. [2012] T. Jain, S. Rajasree, and S. Saluja. Refreshing datawarehouse in near real-time. International Journal of Computer Applications, 46(18):24–29, 2012.
- Karakasidis et al. [2005] A. Karakasidis, P. Vassiliadis, and E. Pitoura. Etl queues for active data warehousing. In Proceedings of the 2nd international workshop on Information quality in information systems, pages 28–39. ACM, 2005.
- Kreps et al. [2011] J. Kreps, N. Narkhede, J. Rao, et al. Kafka: A distributed messaging system for log processing. In Proceedings of the NetDB, pages 1–7, 2011.
- Ljungberg [1998] Õ. Ljungberg. Measurement of overall equipment effectiveness as a basis for tpm activities. International Journal of Operations & Production Management, 18(5):495–507, 1998.
- Malhotra [2001] Y. Malhotra. From information management to knowledge management. beyond the’hi-tech hidebound’systems. Knowledge management and business model innovation, pages 115–134, 2001.
- Mesiti et al. [2016] M. Mesiti, L. Ferrari, S. Valtolina, G. Licari, G. Galliani, M. Dao, K. Zettsu, et al. Streamloader: an event-driven etl system for the on-line processing of heterogeneous sensor data. In Extending Database Technology, pages 628–631. OpenProceedings, 2016.
- Microsoft [2015] Microsoft. Azure Stream Analytics. https://azure.microsoft.com/en-us/services/stream-analytics/, 2015.
- Mueller [2012] T. Mueller. H2 Database. http://www.h2database.com/, 2012.
- Naeem et al. [2008] M. A. Naeem, G. Dobbie, and G. Webber. An event-based near real-time data integration architecture. In Enterprise Distributed Object Computing Conference Workshops, 2008 12th, pages 401–404. IEEE, 2008.
- Naeem et al. [2010] M. A. Naeem, G. Dobbie, G. Weber, and S. Alam. R-meshjoin for near-real-time data warehousing. In Proceedings of the ACM 13th international workshop on Data warehousing and OLAP, pages 53–60. ACM, 2010.
- Neumeyer et al. [2010] L. Neumeyer, B. Robbins, A. Nair, and A. Kesari. S4: Distributed stream computing platform. In Data Mining Workshops (ICDMW), 2010 IEEE International Conference on, pages 170–177. IEEE, 2010.
- Nguyen et al. [2005] T. M. Nguyen, J. Schiefer, and A. M. Tjoa. Sense & response service architecture (saresa): an approach towards a real-time business intelligence solution and its use for a fraud detection application. In Proceedings of the 8th ACM international workshop on Data warehousing and OLAP, pages 77–86. ACM, 2005.
- Polyzotis et al. [2007] N. Polyzotis, S. Skiadopoulos, P. Vassiliadis, A. Simitsis, and N.-E. Frantzell. Supporting streaming updates in an active data warehouse. In Data Engineering, 2007. ICDE 2007. IEEE 23rd International Conference on, pages 476–485. IEEE, 2007.
- Polyzotis et al. [2008] N. Polyzotis, S. Skiadopoulos, P. Vassiliadis, A. Simitsis, and N. Frantzell. Meshing streaming updates with persistent data in an active data warehouse. IEEE Transactions on Knowledge and Data Engineering, 20(7):976–991, 2008.
- Sabtu et al. [2017] A. Sabtu, N. F. M. Azmi, N. N. A. Sjarif, S. A. Ismail, O. M. Yusop, H. Sarkan, and S. Chuprat. The challenges of extract, transform and loading (etl) system implementation for near real-time environment. In Research and Innovation in Information Systems (ICRIIS), 2017 International Conference on, pages 1–5. IEEE, 2017.
- Sahay and Ranjan [2008] B. Sahay and J. Ranjan. Real time business intelligence in supply chain analytics. Information Management & Computer Security, 16(1):28–48, 2008.
- Stamatis [2010] D. Stamatis. The OEE Primer: Understanding Overall Equipment Effectiveness, Reliability, and Maintainability. Productivity Press, 1 pap/cdr edition, 6 2010. ISBN 9781439814062. URL http://amazon.com/o/ASIN/1439814066/.
- Thalhammer et al. [2001] T. Thalhammer, M. Schrefl, and M. Mohania. Active data warehouses: complementing olap with analysis rules. Data & Knowledge Engineering, 39(3):241–269, 2001.
- Toshniwal et al. [2014] A. Toshniwal, S. Taneja, A. Shukla, K. Ramasamy, J. M. Patel, S. Kulkarni, J. Jackson, K. Gade, M. Fu, J. Donham, et al. Storm@ twitter. In Proceedings of the 2014 ACM SIGMOD international conference on Management of data, pages 147–156. ACM, 2014.
- Vassiliadis and Simitsis [2009] P. Vassiliadis and A. Simitsis. Near real time etl. In New trends in data warehousing and data analysis, pages 1–31. Springer, 2009.
- Waas et al. [2013] F. Waas, R. Wrembel, T. Freudenreich, M. Thiele, C. Koncilia, and P. Furtado. On-demand elt architecture for right-time bi: extending the vision. International Journal of Data Warehousing and Mining (IJDWM), 9(2):21–38, 2013.
- Watson and Wixom [2007] H. J. Watson and B. H. Wixom. The current state of business intelligence. Computer, 40(9), 2007.
- Wibowo [2015] A. Wibowo. Problems and available solutions on the stage of extract, transform, and loading in near real-time data warehousing (a literature study). In Intelligent Technology and Its Applications (ISITIA), 2015 International Seminar on, pages 345–350. IEEE, 2015.
- Zaharia et al. [2012] M. Zaharia, T. Das, H. Li, S. Shenker, and I. Stoica. Discretized streams: An efficient and fault-tolerant model for stream processing on large clusters. HotCloud, 12:10–10, 2012.
- Zhang et al. [2015] F. Zhang, J. Cao, S. U. Khan, K. Li, and K. Hwang. A task-level adaptive mapreduce framework for real-time streaming data in healthcare applications. Future Generation Computer Systems, 43:149–160, 2015.