Optical Excitations of Chlorophyll a and b Monomers and Dimers
Abstract
A necessary first step in the development of technologies such as artificial photosynthesis is understanding the photoexcitation process within the basic building blocks of naturally-occurring light harvesting complexes (LHCs). The most important of these building blocks in biological LHCs such as LHC II from green plants are the chlorophyll a (Chl a) and chlorophyll b (Chl b) chromophores dispersed throughout the protein matrix. However, efforts to describe such systems are still hampered by the lack of computationally efficient and accurate methods that are able to describe optical absorption in large biomolecules. In this work we employ a highly efficient linear combination of atomic orbitals (LCAOs) to represent the Kohn–Sham (KS) wave functions at the density functional theory (DFT) level and perform time dependent density functional theory (TDDFT) in either the reciprocal space and frequency domain (LCAO-TDDFT--) or real space and time domain (LCAO-TDDFT--) calculations of the optical absorption spectra of Chl a and b monomers and dimers. We find our LCAO-TDDFT-- and LCAO-TDDFT-- calculations reproduce results obtained with a plane wave (PW) representation of the KS wave functions (PW-TDDFT--), but with a significant reduction in computational effort. Moreover, by applying the GLLB-SC derivative discontinuity correction to the KS eigenenergies, with both LCAO-TDDFT-- and LCAO-TDDFT-- methods we are able to semi-quantitatively reproduce the experimentally measured photoinduced dissociation (PID) results. This work opens the path to first principles calculations of optical excitations in macromolecular systems.
I Introduction
Chlorophyll a (Chl a or C55H72MgN4O5) and chlorophyll b (Chl b or C55H70MgN4O6) Moss (1988); Scheer (2006) are the fundamental functional units of the light harvesting complex (LHC II) Siefermann-Harms (1985) present in green plants. For this reason, understanding the photoexcitation process within Chl a and b is of great importance in the development of technologies such as those involved in the optimization of food crop production Long (2014); Ray et al. (2013) and conversion of solar radiation into a usable form of energy directly through methods such as conventional solar cells Ruban, Johnson, and Duffy (2011); Fleming et al. (2012) or via subsidiary technologies such as photosynthetically-driven (bio)reactor systems for hydrogen combustion Allakhverdiev et al. (2010); Krassen et al. (2009); Berardi et al. (2014); Searle and Malins (2014). Moreover, such information is more generally applicable to the in silico design and optimization of dye-sensitized solar cells Gong et al. (2017), organic photovoltaic cells Agnihotri (2014), photocatalytic systems Ahmad et al. (2016), optoelectronic devices Li (2009), and plasmonics Geddes (2016).
Although much progress has been recently made in both the experimental measurement of individual monomer and dimer Chl a and b spectra Milne et al. (2015); Stockett et al. (2015); Milne et al. (2016), and their theoretical description at the time-dependent density functional theory (TDDFT) Runge and Gross (1984) level Hedayatifar et al. (2016); Linnanto and Korppi-Tommola (2006); Dreuw and Head-Gordon (2004); Parusel and Grimme (2000), the lack of reasonably accurate yet highly efficient computational methods has hampered efforts to describe the optical absorption of large Chl-containing biomolecules. Initial attempts to investigate the optical absorption characteristics of biomacromolecules such as the LHC II using first-principles electronic structure methods have helped to clarify several aspects of the functioning of these systemsJornet-Somoza et al. (2015); Konig and Neugebauer (2011). However, these calculations neglected the protein matrix, and thus failed to fully explain the role played by the surrounding proteins in photosynthesis and why they are produced. Moreover, the computational resources required for a complete treatment of systems of this size lie considerably beyond what is generally available to most researchers.
On the one hand, methods based on the Kohn–Sham (KS) density of states Kohn and Sham (1965), while being quite efficient, often underestimate energy gaps by more than half. This is because an independent-particle picture fails to describe electronic screening of the excited states Migani et al. (2013). On the other hand, quasiparticle-based calculations of spectra from the Bethe–Salpeter equation (BSE) Salpeter and Bethe (1951), while often achieving quantitative accuracy, are extremely heavy computationally Onida, Reining, and Rubio (2002). As a result, only recently have even the smallest dye-sensitized solar cells (DSSC) been described at the BSE level Mowbray and Migani (2016). Moreover, such methods are intrinsically ill-suited to the description of isolated and/or non-periodic systems.
Although TDDFT Runge and Gross (1984); Marques et al. (2006) real time Yabana and Bertsch (1996, 1999); Ghosh et al. (2017); Koh, Nguyen-Beck, and Parkhill (2017) and frequency domain Casida (1995, 2009); Yan, Thygesen, and Jacobsen (2011); Yan et al. (2011); Mowbray (2014) calculations provide an attractive alternative, implementations based on real-space (RS) or plane-wave (PW) representations of the KS orbitals Kohn and Sham (1965) are both computationally expensive, and exhibit a strong exchange and correlation (xc) functional dependence for their accuracy. Time propagation RS (RS-TDDFT--) calculations require time steps much shorter than what is needed to resolve the features of the spectra in order to ensure the stability of the calculation Jornet-Somoza et al. (2015). Such instabilities of RS calculations may be related to their freedom in representing the KS wavefunctions, which are only constrained by the grid spacing.
In this work we employ linear combinations of atomic orbitals (LCAOs) to provide a more efficient representation of the KS orbitals, while retaining the accuracy of PW-based TDDFT reciprocal space and frequency domain PW-TDDFT-- calculations of the optical absorption. Moreover, we use the recently developed derivative discontinuity correction based on the exchange part of the GLLB-SC Kuisma et al. (2010) functional to correct the KS eigenenergies and provide a semi-quantitative agreement with experimental measurements Castelli et al. (2012); Preciado-Rivas, Torres-Sánchez, and Mowbray (2019); Lyon et al. (2019). Furthermore, the constraints imposed by an LCAO representation of the KS wavefunctions may be expected to improve the stability of time-propagation TDDFT calculations (LCAO-TDDFT--), allowing one to use larger time steps. However, the reliability of LCAO-TDDFT is inherently basis set dependent Rossi et al. (2015). This makes an assessment and benchmarking for the fundamental functional units with PW-TDDFT-- calculations and photoinduced dissociation (PID) experiments essential before applying LCAO-TDDFT-- or LCAO-TDDFT-- to the complete macromolecular system.
By applying LCAO-TDDFT methods Glanzmann et al. (2015); Preciado-Rivas, Torres-Sánchez, and Mowbray (2019); Lyon et al. (2019); Kuisma et al. (2015) to the Chl a and b monomer and dimer systems, we may clearly explain their advantages and disadvantages for describing light-harvesting systems, with the aim of applying these methods to macromolecules such as the complete LHC II. Note that since experimental measurements of the Chl b dimer are currently unavailable, we have restricted consideration to the Chl a dimer herein.
This paper is organized as follows. In Sec. II we describe the computational parameters employed to model the Chl a and b systems and provide a theoretical background to LCAO-TDDFT-- Glanzmann et al. (2015); Preciado-Rivas, Torres-Sánchez, and Mowbray (2019); Lyon et al. (2019) and LCAO-TDDFT-- Kuisma et al. (2015) calculations in the projector augmented wave (PAW) method. In Sec. III, we perform a basis set convergence test and direct comparison with PW-TDDFT-- calculations and PID measurements for our LCAO-TDDFT-- calculations of Chl a and b, model the excitonic density of their first four bright excitations using the electron hole density difference from LCAO-TDDFT--, compare our LCAO-TDDFT-- calculations with PID measurements for Chl a and b, compare both LCAO-TDDFT-- and LCAO-TDDFT-- calculations with PID measurements for the Chl a dimer (Chl a)2, and finally tabulate and compare our results for the Q band with those available in the literature Milne et al. (2015, 2016). We then provide concluding remarks in Sec. IV. Atomic units () are employed throughout unless stated otherwise.
II METHODOLOGY
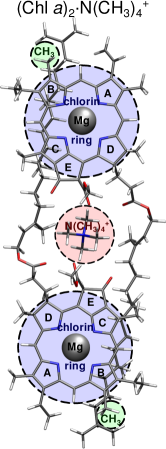
All DFT Hohenberg and Kohn (1964); Kohn and Sham (1965) calculations were performed using the PAW Blöchl (1994); Blöchl, Först, and Schimpl (2003); Rostgaard (2006) implementation within the GPAW code Mortensen, Hansen, and Jacobsen (2005); Enkovaara et al. (2010); Larsen et al. (2009). We employed the generalized gradient approximation (PBE Perdew, Burke, and Ernzerhof (1996)) for the exchange and correlation functional. To represent the electron density and wave functions we employed either LCAOs Larsen et al. (2009) with a double--polarized (DZP) basis set, after performing convergence tests with basis sets of varying quality up to a quadruple--polarized (QZP) basis set, or PWs with a plane-wave cutoff of 340 eV. Gas phase structures for the full Chl a and b monomers (see Figure 1(a) full1+) and the Chl a dimer (see Figure 2) were based on those of Refs. 17 and 19, respectively. To determine the influence of the hydrocarbon chain and the tetramethylammonium charge tag (N(CH3) or 1+) on the optical absorbance of Chl a and b monomers we have also considered structures with the hydrocarbon chain cut from C20H39 to C5H9 with and without the N(CH3) charge tag, as shown in Figure 1 (a) cut1+ and (b) cut, respectively.
Each structure was optimized using the ASE code Bahn and Jacobsen (2002); Larsen et al. (2017) until a maximum force less than 0.03 eV/Å was obtained. All structures were modelled in supercells with more than 6 Å of vacuum using non-periodic boundary conditions, that is, the electron density and wave functions were set to zero at the cell boundary. This prevents long-range interactions between repeated images that would affect a periodic calculation. More importantly, the use of non-periodic boundary conditions has been previously shown to be essential for modelling charged structures in gas phase Mowbray et al. (2013).
Optical absorbance spectra were modelled using the imaginary part of the dielectric function, , from LCAO-TDDFT calculations in the frequency domain (LCAO-TDDFT--) Glanzmann et al. (2015); Preciado-Rivas, Torres-Sánchez, and Mowbray (2019); Lyon et al. (2019); LCA , and using the Fourier transform of the dipole moment, , from LCAO-TDDFT in the real time domain (LCAO-TDDFT--) Kuisma et al. (2015).
The optical absorbance from LCAO-TDDFT-- in the direction, neglecting local field effects, is given by Preciado-Rivas, Torres-Sánchez, and Mowbray (2019); Lyon et al. (2019)
| (1) |
where is the supercell volume, is the electronic broadening, is the Fermi–Dirac function, is the eigenenergy and is the KS wave function of the th orbital, and is the derivative discontinuity correction to the eigenenergies Kuisma et al. (2010) from the exchange part of the GLLB-SC functional given by Preciado-Rivas, Torres-Sánchez, and Mowbray (2019)
| (2) |
where is the number of electrons. Incorporating this derivative discontinuity correction has been shown to provide better agreement with experimental band gaps Castelli et al. (2012) and optical absorption spectra Preciado-Rivas, Torres-Sánchez, and Mowbray (2019); Lyon et al. (2019).
The matrix elements in Eq. (1) may be expressed as Glanzmann et al. (2015)
| (3) |
where the sum is over for the th state centered on atom , are the localized basis functions, so that with coefficients for the th KS wave function, and is the PAW transformation operator Blöchl (1994); Blöchl, Först, and Schimpl (2003); Rostgaard (2006)
| (4) |
where and are the pseudo and all-electron partial waves for state on atom within the PAW formalism, and are the smooth PAW projector functions.
Since the matrix elements of Eq. (3) must already be calculated to obtain the forces at the DFT level, the calculation of using Eq. (1) simply involves the multiplication of previously calculated matrices. For this reason, the calculation of using LCAO-TDDFT-- is very efficient, with scaling of or better Blackford et al. (1997), where is the number of KS wavefunctions and is the total number of basis functions used in the LCAO calculation. This provides a significant speed-up compared to the scaling of the Casida LCAO-TDDFT-- formalism Kuisma et al. (2015); Casida (1995, 2009). We found ten unoccupied KS wave functions per chlorophyll molecule were already sufficient to converge the spectra up to 3.5 eV. This is because local field effects may be safely neglected in the optical limit for gas phase structures Mowbray (2014); Glanzmann et al. (2015).
The optical absorbance from LCAO-TDDFT-- is given by the Fourier transform of the dipole moment, , so that
| (5) |
where is the strength of the “kick” in the direction, and is the peak broadening. The dipole moment is then obtained from the time dependent charge density using
| (6) |
The time dependent charge density is simply , where are the time-dependent KS wave functions which are obtained by propagating
| (7) |
where is the KS Hamiltonian for independent electrons, and is the KS potential functional.
Employing LCAO to represent the time-dependent KS wave functions, we may express Eq. (7) as Kuisma et al. (2015)
| (8) |
After applying the initial kick, the time propagation is performed using the reliable and numerically stable semi-implicit Crank–Nicolson method Crank and Nicolson (1947), as described in Ref. 48.
As was the case for LCAO-TDDFT--, each step of the LCAO-TDDFT-- is very efficient and involves solving the system of linear equations, Eq. (8), with ScaLAPACK Blackford et al. (1997). For this reason, the calculation of using LCAO-TDDFT-- scales as . Although this is worse than the scaling of RS-TDDFT--, where is the number of grid points, the constant prefactor for the grid propagation is so large that even for systems with thousands of electrons it is outperformed by several orders of magnitude by LCAO-TDDFT-- Kuisma et al. (2015).
All spectra have been calculated with intrinsic widths of 50 meV. In the frequency domain we employed an electronic broadening of meV to the individual Lorentzian peaks, while in the real time domain we convoluted the dipole moment with a Gaussian of width fs.
The LCAO-TDDFT-- spectra remained stable with a 0.01 fs time step, which was sufficient to resolve the shape of the dipole spectra. Such a time step is an order of magnitude greater than the 0.002 fs time step required for real space time propagation calculations to maintain stability Jornet-Somoza et al. (2015). We were thus easily able to propagate up to 80 fs, twice that recorded with real space methods Jornet-Somoza et al. (2015).
To provide insight into the spatial distribution of the exciton, we employ the electron hole density difference, , as described in Refs. 31; 44; 45. Here, the electron/hole densities are obtained by averaging the two-particle exciton density , with respect to the hole/electron coordinate . We calculate the electron hole density difference for the first four bright excitations using the transitions from LCAO-TDDFT--. Since these molecular transitions are both well separated and composed of single transitions at the LCAO-TDDFT-- level, we find , where and are the KS orbitals corresponding to the hole and electron, respectively, and is the energy of the transition , including the derivative discontinuity correction of Eq. (2).
III RESULTS AND DISCUSSION
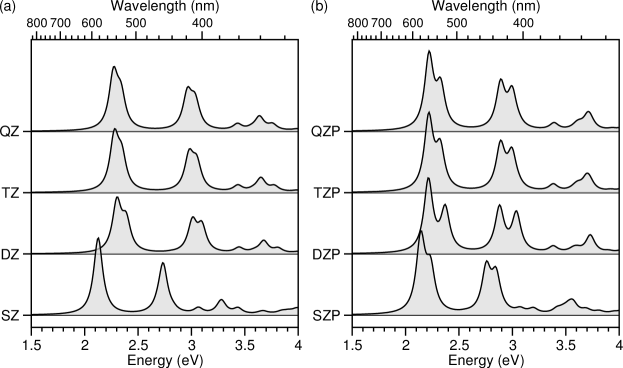
In Figure 3 we show the optical absorption spectrum of the neutral cut structure of Chl a calculated using either multiple- basis sets (SZ, DZ, TZ and QZ) or the polarized versions of the basis sets (SZP, DZP, TZP and QZP) within the LCAO mode of the gpaw code. We systematically increase the number of functions to assess the sensitivity of the optical absorbance and observe that the spectrum converges differently for basis sets with and without polarization functions.
It can be seen in Figure 3(a) that the SZ basis set yields a red-shifted spectrum compared to the other spectra, the TZ and QZ basis sets spectra are almost the same, and the DZ basis set yields the same energies of the Q and Soret bands compared to those of the TZ and QZ but the peaks within the band are more separated than in the TZ or QZ spectra. The polarized multiple- basis sets are shown in Figure 3(b) and we observe that the SZP basis set also yields a red-shifted spectra compared to other spectra and there are more peaks above eV. The spectra obtained using TZP and QZP are nearly identical and the DZP basis set yields the same energy of the Q and the Soret bands although the peaks within the bands are a little bit separated when compared to TZP and QZP.
Even though it seems that the spectrum of Chl a will not change if we increase the number of functions of the basis set, we cannot rely solely on these results to claim that an LCAO basis set will guarantee an accurate description of the optical absorption spectra. This is because LCAO basis sets cannot be systematically converged to the complete basis set limit, for molecules of this size. This is clear from comparing the result of the inclusion of polarization functions with the LCAO basis sets in Figure 3. Although double- basis sets are converged with respect to the number of radial functions, the inclusion of polarization systematically alters the spectra. For this reason, we must compare the spectra of Chl a and Chl b obtained using LCAO and a PW representations of the KS wavefunctions.
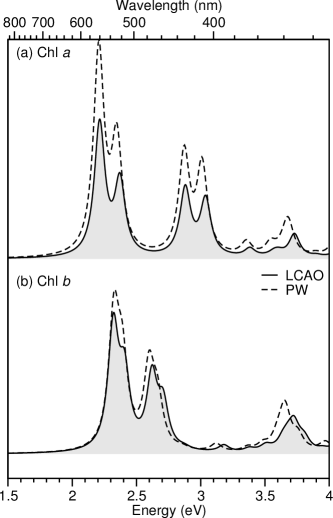
In Figure 4, we show the optical absorption spectra of the cut structures of both Chl a and Chl b calculated using either the DZP basis set within the LCAO mode, or using a PW representation of the KS wavefunctions that ensures converged optical absorption spectra. We find that the DZP basis set yields an optical absorption spectrum with transition energies very close to those of the spectrum calculated using PW. We observe that the LCAO spectra is only slightly (much smaller than the eV DFT accuracy) red-shifted compared to the PW spectra, but underestimates the intensities of the transitions. Nevertheless, we can affirm that the atomic basis set with double- and polarization functions, DZP, is sufficient to ensure semi-quantitative agreement of the optical absorption spectra for the Chl a and Chl b with the PW calculations.
The DZP basis sets have been shown to be sufficient (and often necessary) to converge to the results calculated with PW representations of the KS wavefunctions in other works as well Strange et al. (2008); Larsen et al. (2009). From hereon we shall restrict consideration to the DZP basis set and simply refer to our calculations as LCAO.
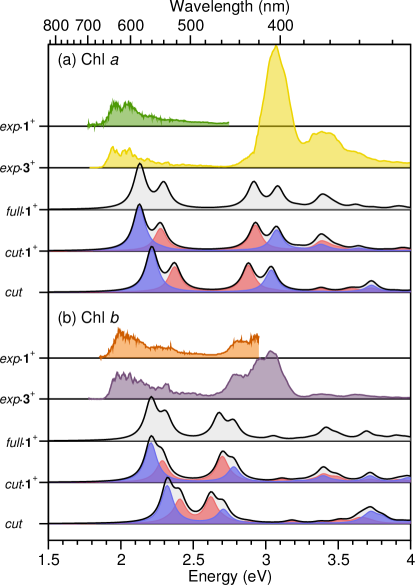
In Figure 5 we plot the spectra obtained from LCAO-TDDFT-- including the derivative discontinuity correction for the Chl a and b monomers shown in Figure 1. The onset of the calculated spectra are in semi-quantitative agreement with the experimental spectra obtained with either the monocationic tetramethylammonium 1+ or acetylcholine 3+ tag. The difference between the maximum of the Q band and the calculated first excitation energy is less than eV and the difference between the maximum of the Soret band and the calculated fourth excitation is less than eV. Also, the spectra of the cut1+ structure shows the same qualitative behavior as the full1+ structure, suggesting that none to negligible changes in the optical absorption spectra are caused by the carbon chain. However, when the charge tag is removed, that is, regarding the cut structure, the Q band peaks are blue shifted and the band gap is widened, whereas the Soret band peaks are red shifted.
For Chl b, Figure 5(b), the calculated spectra for the full1+ structure is also in semi-quantitative agreement with the experimental spectra. Specifically, the peaks of the Q band and the Soret band of the full1+ structure are blue and red shifted, respectively, when compared to the experimental data, with a difference between the Q band maximum and the calculated first excitation of eV and a difference between the Soret band maximum and the calculated fourth excitation of eV. Again, the spectrum of the cut1+ structure is qualitatively the same as the spectrum of the full1+, reinforcing the idea that the carbon chain has no impact in the optical absorbance and that it should be centered on the Mg atom and the chlorin ring. When removing the charge tag (cut structure) the Q band peaks are again blue shifted, and the band gap is widened, whereas the Soret band peaks are red shifted.
The intensities of the excitations of the Soret band are being underestimated about for Chl a and for Chl b, comparing the full1+ to the experimental data. Also, the intensity of the Soret band peaks is less compared to that of the Q band peaks. This is not the case for the experimental data. Although the relative intensities are adjusted, that is, the Soret band peaks intensities are increased by applying the GLLB-SC correction to the spectra following Eq. 1, they are still underestimated.
Such a difference can be explained by the fact that we are neglecting charge transfer excitations at the linear density response level. The higher intensity of these peaks is often attributed in the literature to this type of charge transfer excitation Milne et al. (2015), which we are unable to model at the LCAO-TDDFT-- level. In this way, our underestimation of the Soret band intensity provides indirect insight into the nature of the experimentally observed peaks.
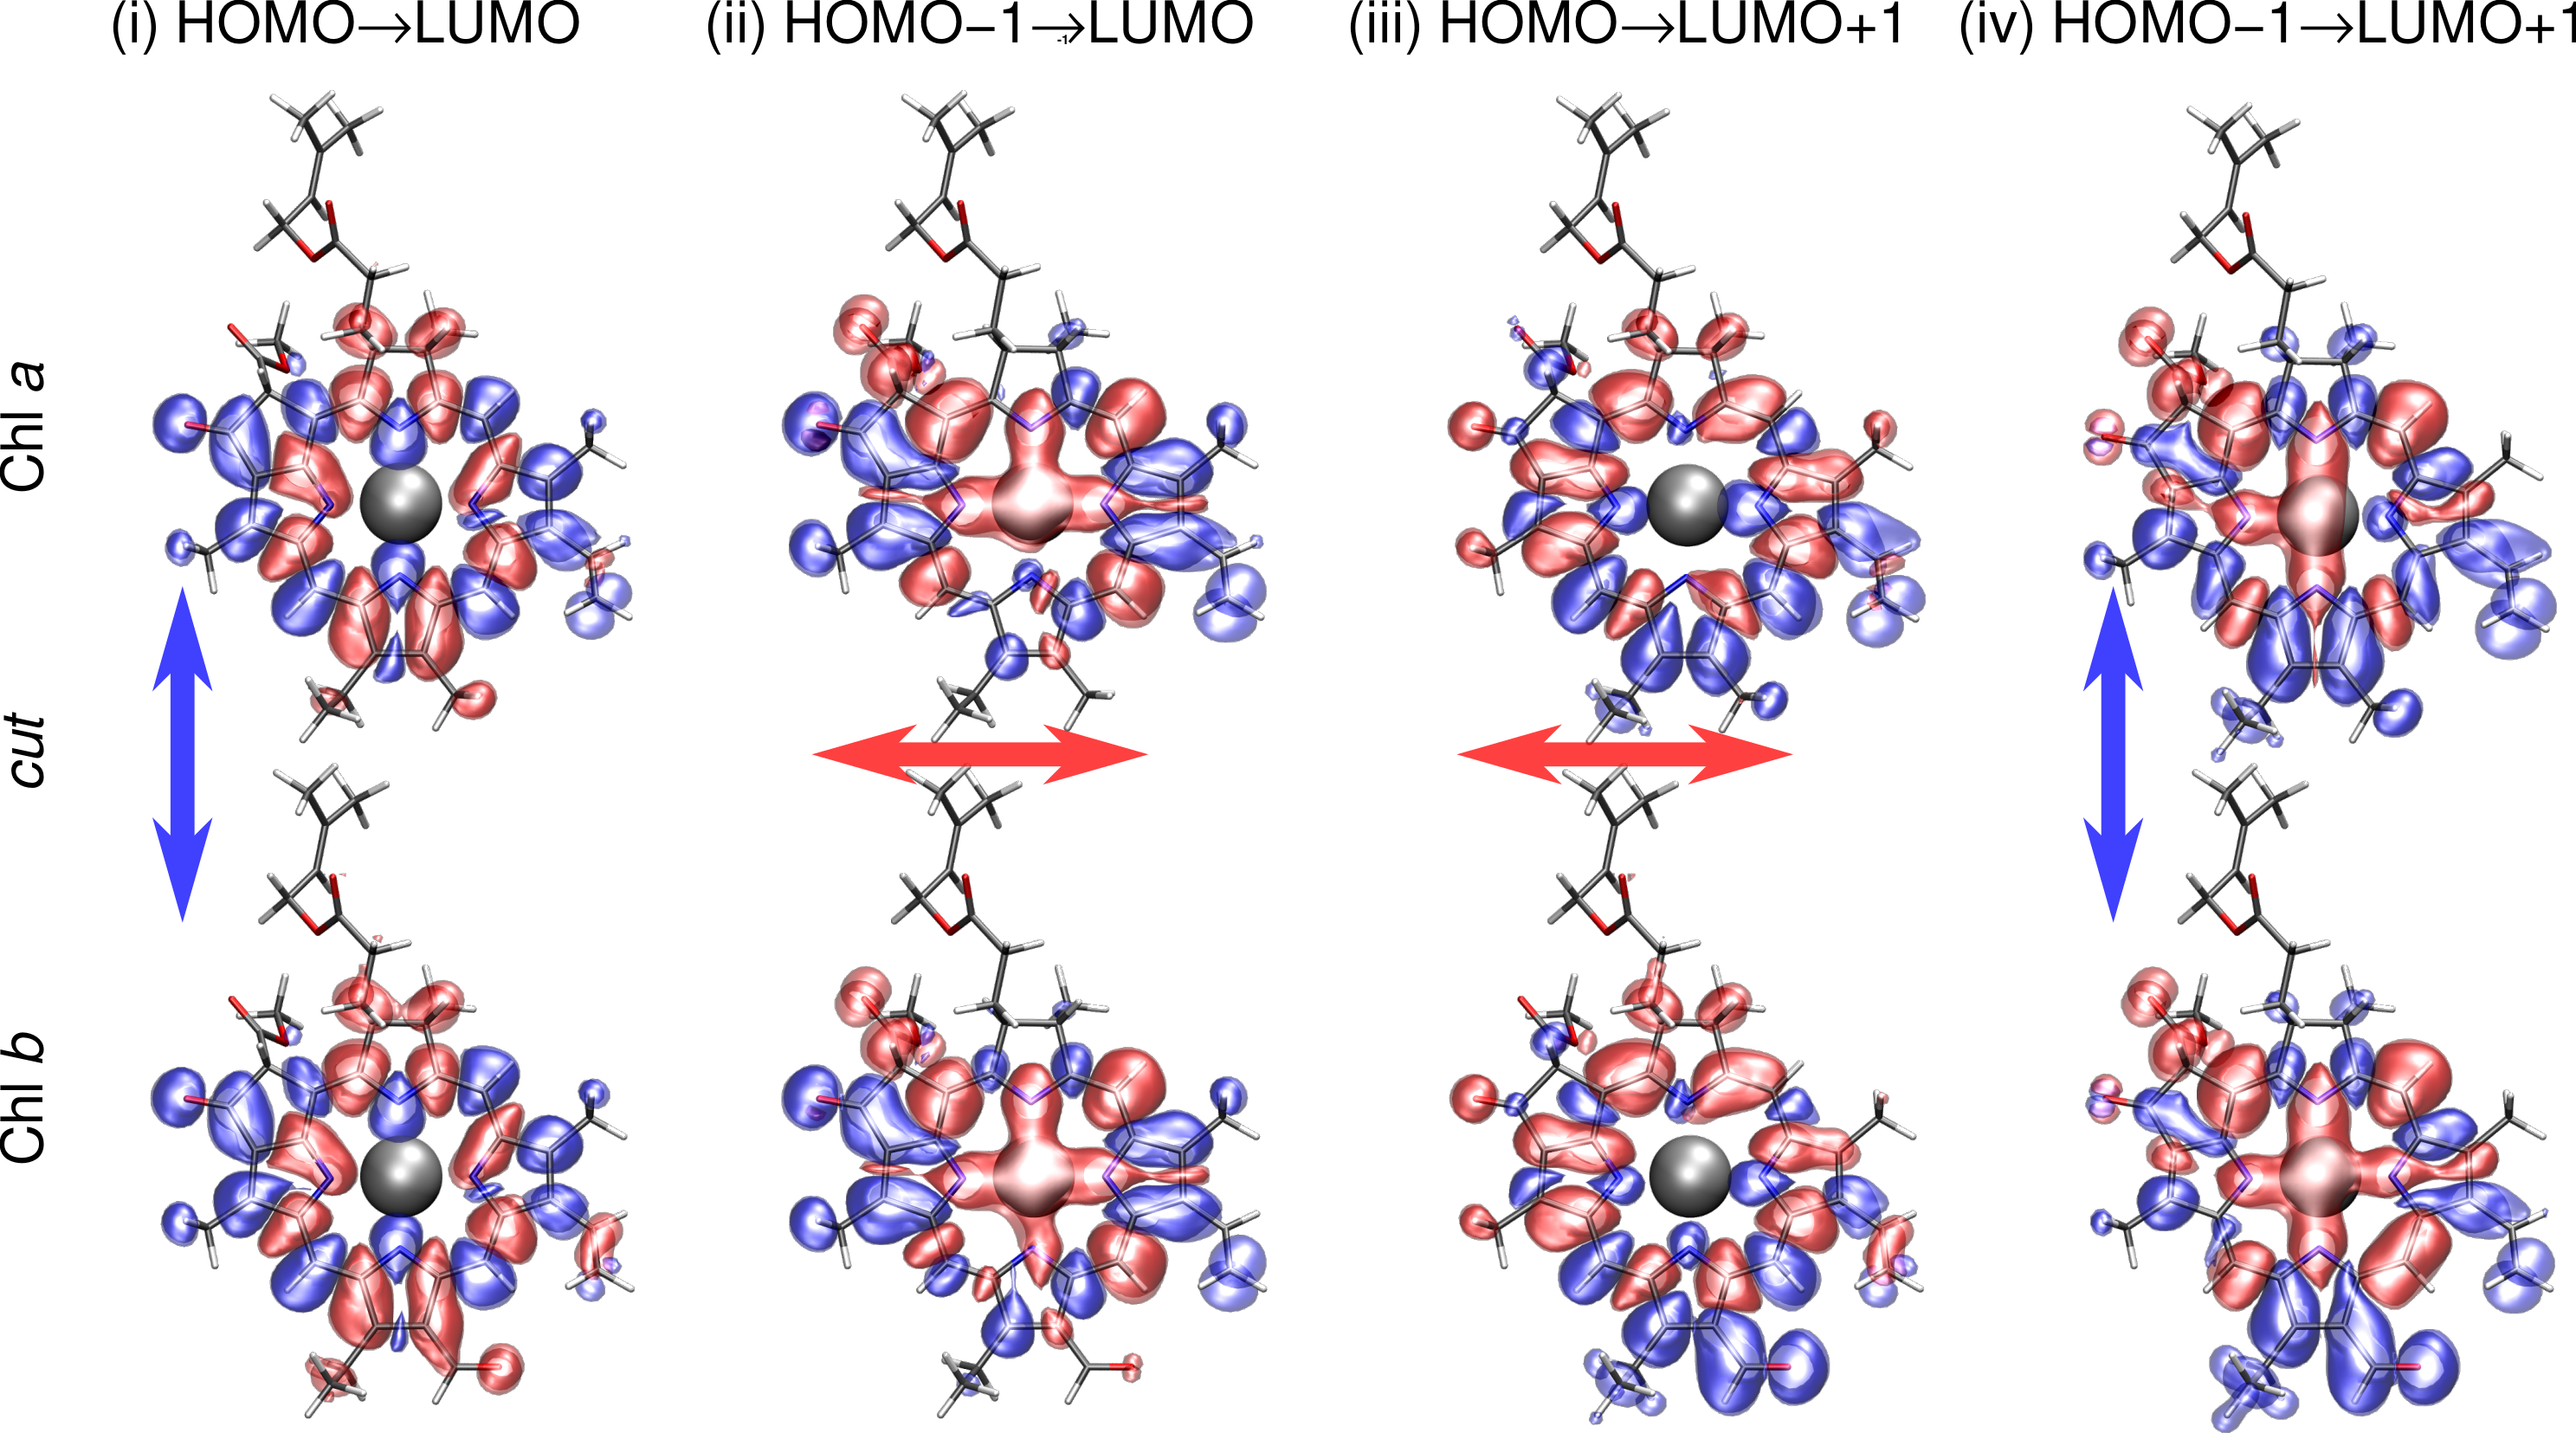
In Figure 6 we plot the spatial distribution of the electron and hole densities for the first four bright transitions of the Chl a and b cut structures. As shown in Figure 5, the first and fourth excitations are induced by optical absorption along the N–Mg–N bond in the polarization direction Moss (1988); Scheer (2006) (blue arrows in Figure 6), while the second and third excitations are induced by optical absorption along the polarization direction Moss (1988); Scheer (2006) (red arrows in Figure 6), as expected. In each case, the excitations are transitions involving the two highest occupied molecular orbitals (HOMOs) and the two lowest unoccupied molecular orbitals (LUMOs).
For both species the electron density of the first and third excitations has weight on the levels of the N atoms parallel to the direction of excitation towards the Mg atom. Conversely, the hole density of the second and third excitations on both Chl a and b has significant weight on the levels of both the N and Mg atoms. Overall, the first and third transitions tend to move charge density from the chlorin ring to either its edges or towards the central Mg atom, whereas the second and fourth transitions tend to move charge from the central Mg atom to the edge of the chlorin ring along the direction of excitation.
Although the excitations for Chl a and b are qualitatively the same, we do notice differences in the region of the methyl/aldehyde. Specifically, the electron of the third and fourth transitions has significantly more weight around the aldehyde group of Chl b compared to the methyl group of Chl a. Also, the hole density of the second and fourth transitions has weight on all four N atoms for Chl b, whereas the electron density has some weight on one of the N atoms perpendicular to the direction of excitation.
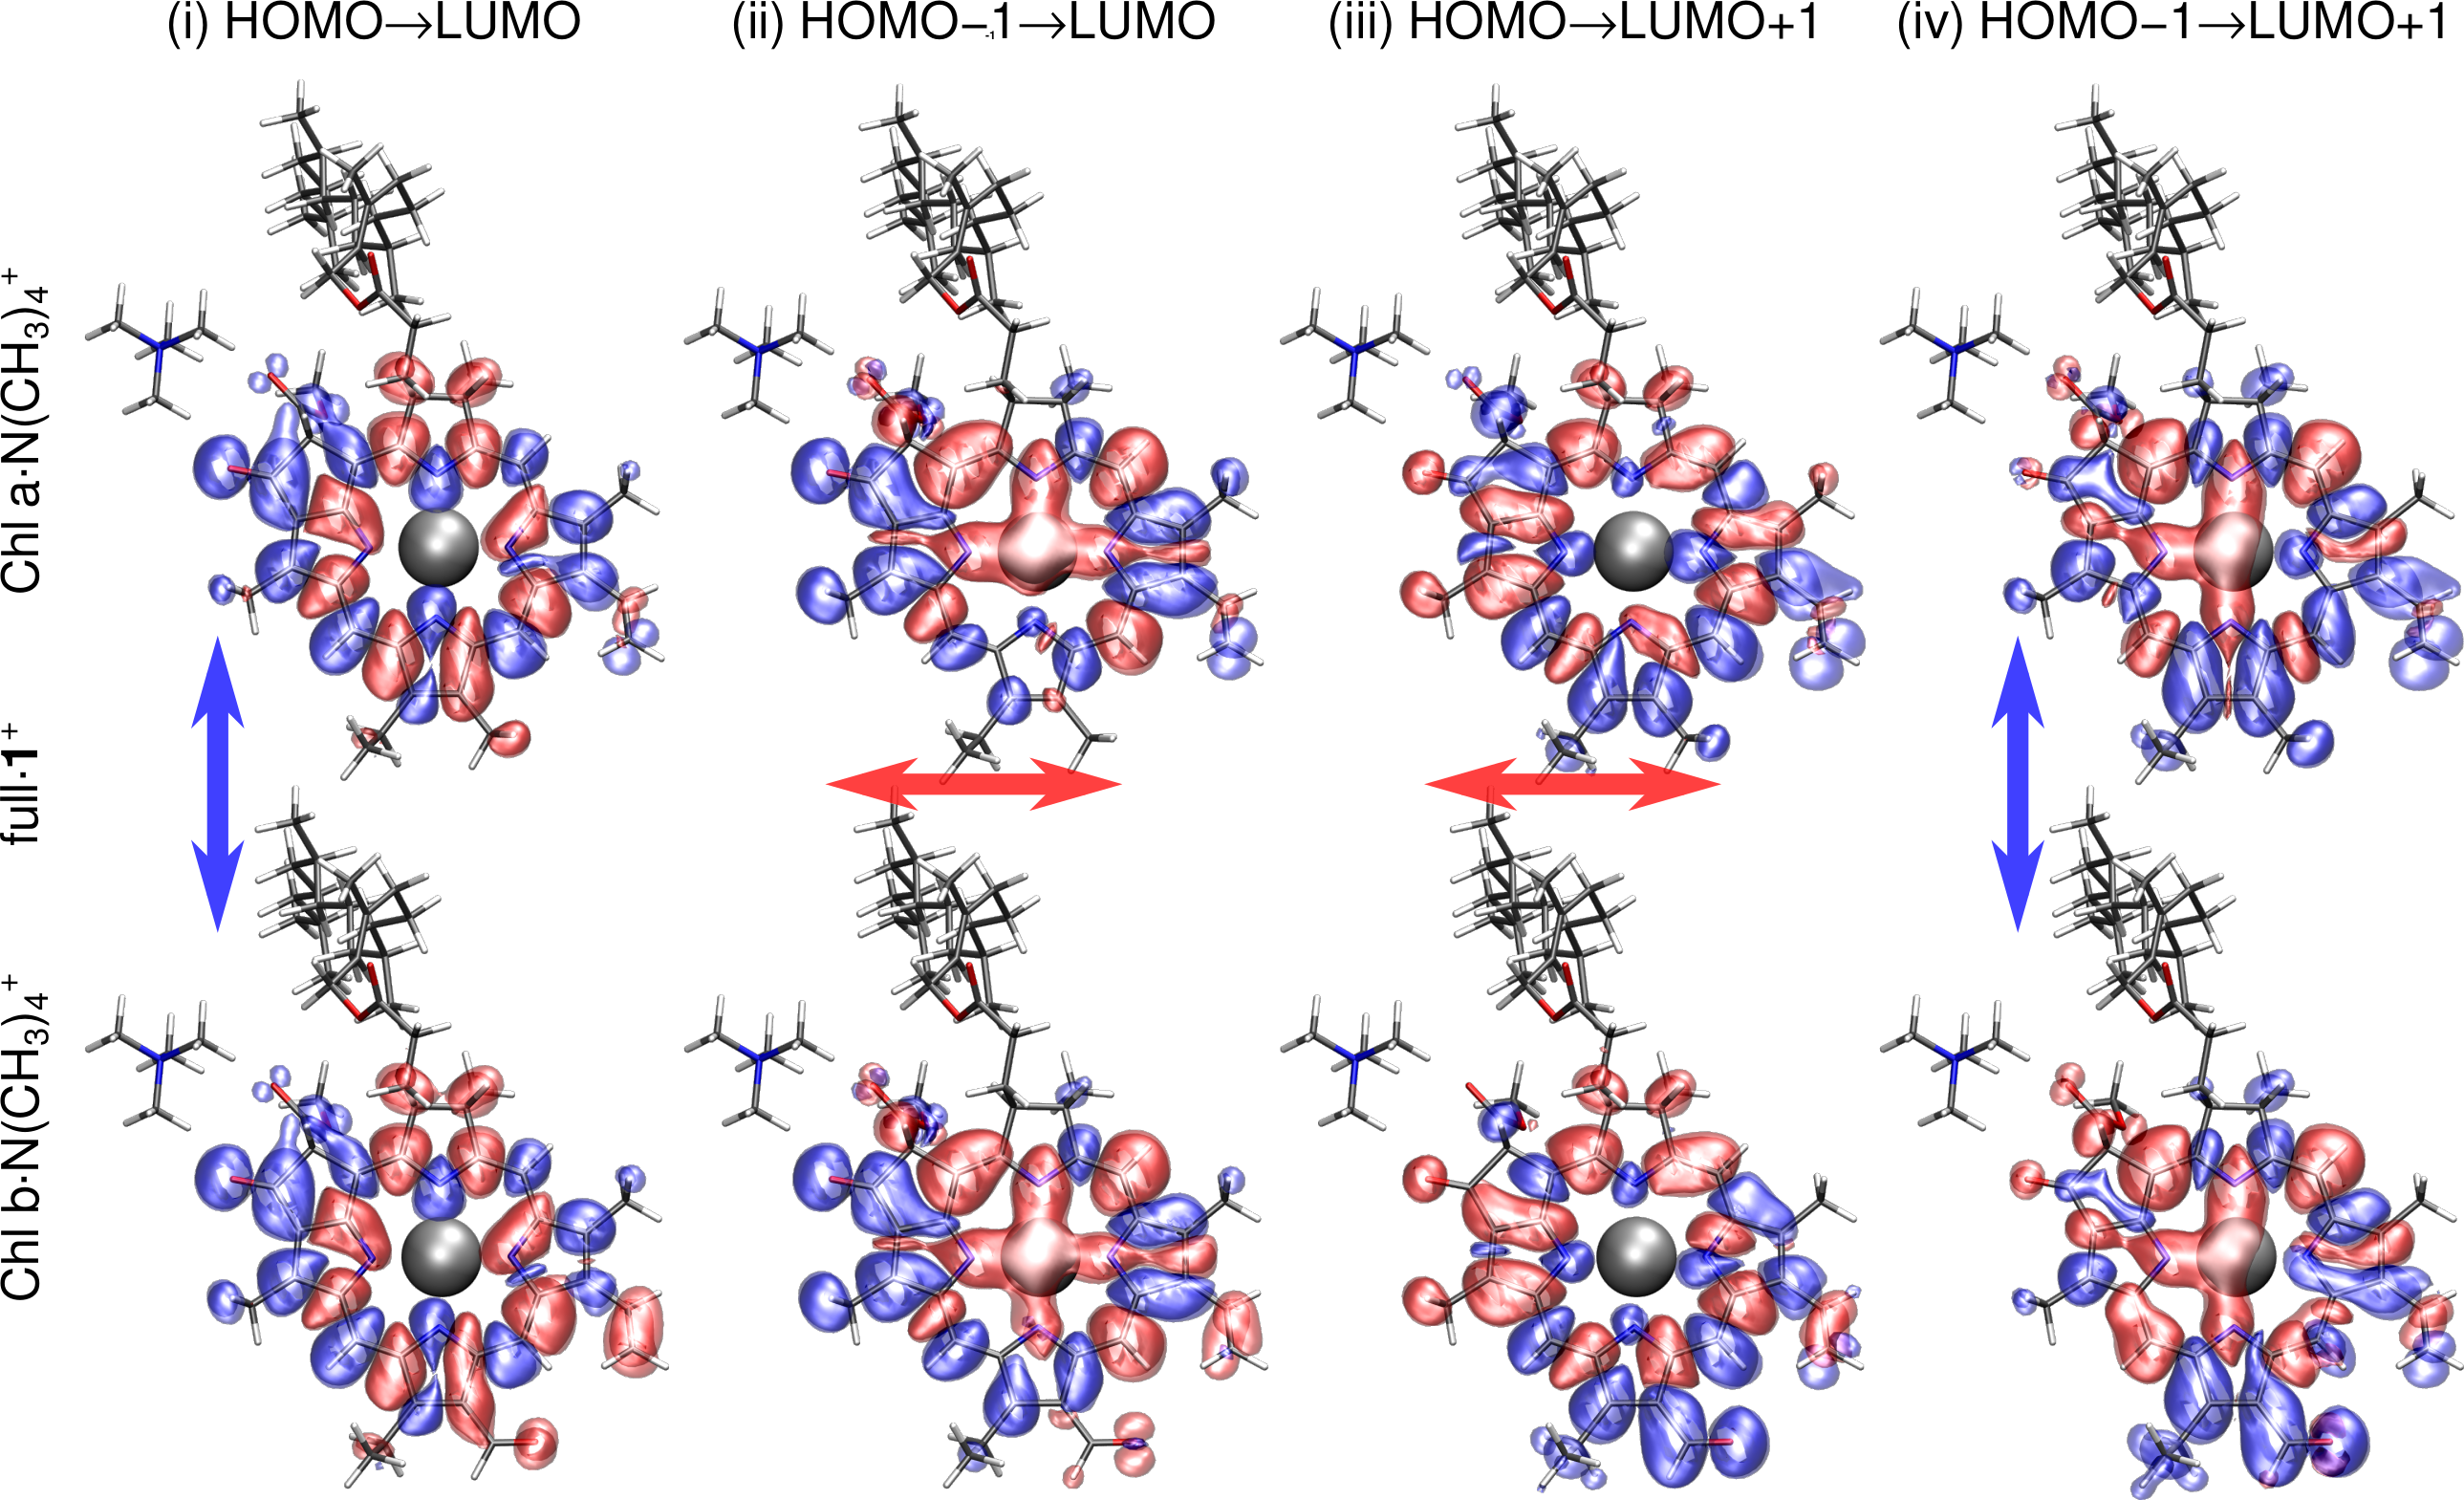
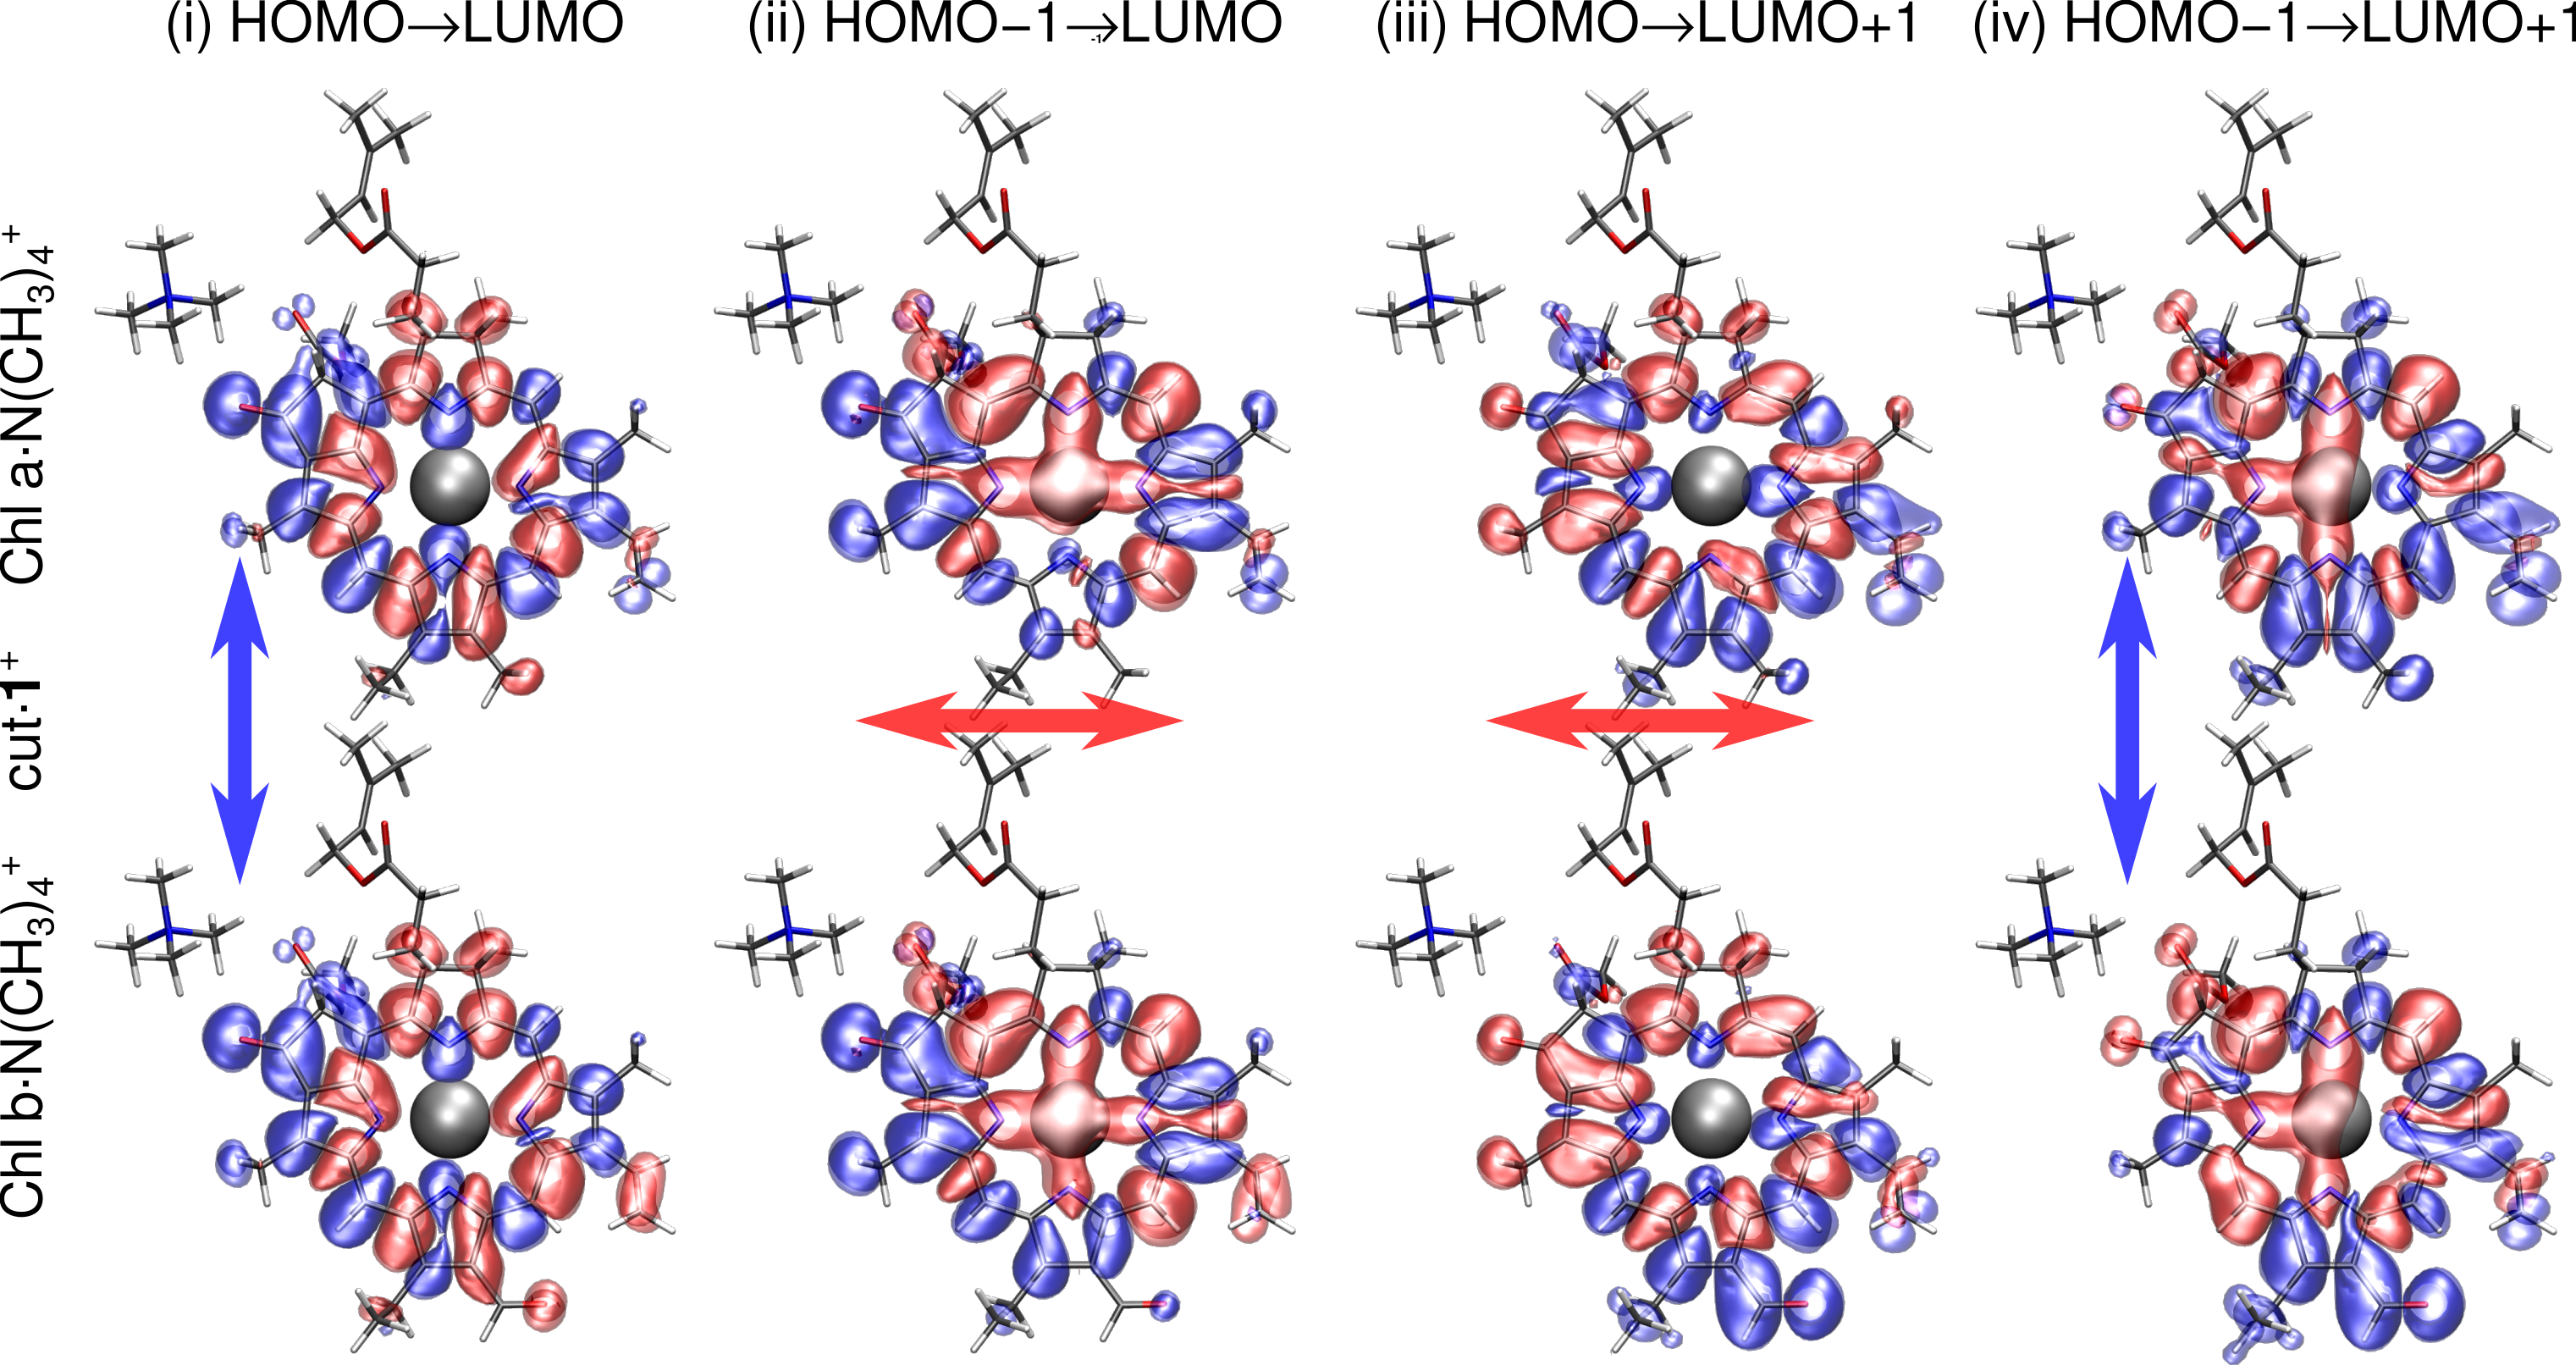
Finally, the excitations of the charge tagged species with a cut (cut1+) and full (full1+) hydrocarbon chain, shown in Figure 7, are basically the same as those for the neutral species (cut shown in Figure 6). This provides additional evidence justifying the experimental use of charge tagged Chl a and b molecules to describe the optical absorption of the neutral isolated species Milne et al. (2015); Stockett et al. (2015).
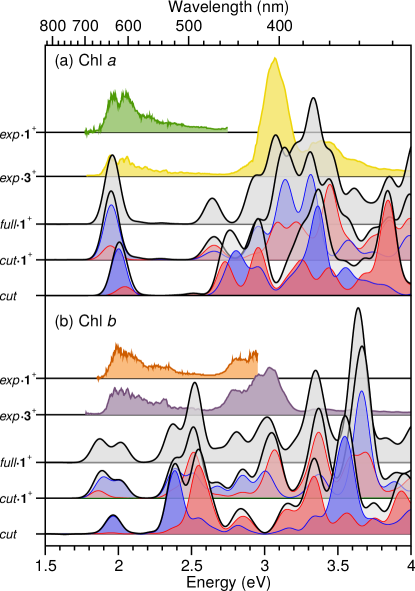
In Figure 8 we directly compare the spectra obtained from LCAO-TDDFT-- for the Chl a and b monomers shown in Figure 1 with those measured experimentally from Refs. 17 and 18. The Q-band energy or onset of the LCAO-TDDFT-- spectra agrees quantitatively with that measured experimentally for both Chl a and b in Refs. 17 and 18. However, whereas we found distinct Q band transitions with polarizations in the and directions for LCAO-TDDFT-- (see Figure 5), with LCAO-TDDFT-- we find the Q band transitions coincide in energy. Moreover, for Chl b cut1+, we find that whereas there are two Q-band peaks, they both have polarization in the direction, from ring B to ring D along the N–Mg–N bond. This splitting of the Q band peak in the direction and the weak Q band peak in the direction are both suppressed once the charge tag is removed (see Figure 8(b) cut).
While we find removing the charge tag induces a blue shift of the Q band for Chl a and b, as was the case for LCAO-TDDFT--, we find the Soret band is less affected by the charge tag with LCAO-TDDFT--. In the region of the Soret band LCAO-TDDFT-- yields many peaks from 2.5–4 eV. This may be related to the difficulty in converging higher energy peaks with TDDFT-, although our time propagation of fs should be sufficient to converge these peaks.
Overall, we find the spectra from LCAO-TDDFT-- provide excellent agreement with the experimentally measured spectra with tetramethylammonium (exp1+) and acetylcholine (exp3+) charge tags. This provides further evidence that the exact structure of the charge tag has little to no impact on the onset of the spectra Milne et al. (2015); Stockett et al. (2015). Moreover, the spectra exhibit rather minor changes upon removing the charge tag, providing further justification for using charge tagged Chl a and b to describe the optical absorption of the neutral isolated species Milne et al. (2015); Stockett et al. (2015).
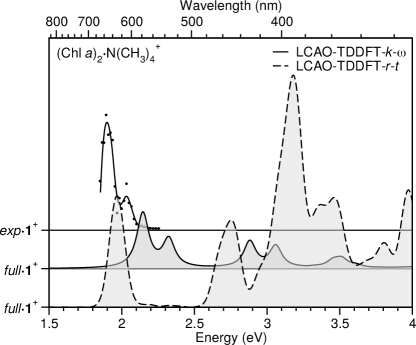
Going beyond the monomer, in Figure 9 we directly compare the optical absorbance spectra for the Chl a dimer measured experimentally from Ref. 19, obtained from LCAO-TDDFT--, , and LCAO-TDDFT--, . In both cases, the experimental onset of the peak is reproduced semi-quantitatively, with the derivative discontinuity corrected LCAO-TDDFT-- results somewhat blue shifted by about eV. However, as was the case for the monomer, the experimentally observed splitting of the Q band is clearly visible with LCAO-TDDFT-- but absent from the LCAO-TDDFT-- Chl a spectrum.
Overall, these results show that increasing the system size, as we go from the monomer to the dimer, LCAO-TDDFT-- and LCAO-TDDFT-- provide the same level of accuracy. For LCAO-TDDFT--, this means that after applying the derivative discontinuity correction eV, the spectra agree semi-quantitatively with the measured spectra for both the Chl a monomer and dimer. For LCAO-TDDFT--, this correction is not required to obtain a quantitative description of the experimental spectra for both the Chl a monomer and dimer. Altogether, this suggests that for even larger systems, such as the LHC II, we may reasonably expect both LCAO-TDDFT-- and LCAO-TDDFT-- to continue to perform well.
| method | structure | (eV) | (nm) | (eV) | (nm) | |
|---|---|---|---|---|---|---|
| Chl a | Chl b | |||||
| PIDa | exp1+ | 1.97 | 629 | 1.99 | 623 | |
| full1+ | 2.08 | 596 | 2.15 | 577 | ||
| full | 2.04 | 608 | 2.13 | 582 | ||
| full1+ | 1.96 | 633 | 1.87, 2.02 | 662, 615 | ||
| cut1+ | 1.95 | 636 | 1.89, 2.00 | 657, 621 | ||
| cut | 2.01 | 618 | 1.96 | 631 | ||
| full1+ | 2.13, 2.30 | 582, 540 | 2.21, 2.31 | 562, 537 | ||
| cut1+ | 2.13, 2.27 | 583, 545 | 2.21, 2.29 | 562, 542 | ||
| cut | 2.21, 2.37 | 561, 524 | 2.32, 2.41 | 534, 515 | ||
| cut | 2.21, 2.35 | 561, 528 | 2.33, 2.39 | 533, 518 | ||
| (Chl a)2 | ||||||
| PIDf | exp1+ | 1.90 | 652 | |||
| full1+ | 2.05 | 605 | ||||
| full1+ | 1.97 | 630 | ||||
| full1+ | 2.15, 2.32 | 578, 534 | ||||
| aPhotoinduced dissociation from Ref. 17. bTD-CAM-B3LYP/Def2-SVP from Ref. 17. cLCAO-TDDFT-- from this work. dLCAO-TDDFT-- from this work. ePW-TDDFT-- from this work. fPhotoinduced dissociation from Ref. 19. gTD-CAM-B3LYP/Def2-SVP from Ref. 19. | ||||||
In Table 1 we provide a direct comparison of the Q-band energy (first and second transitions shown in Figures 6 and 7) for Chl a, Chl b, and (Chl a)2 obtained from PID measurements, TD-CAM-B3LYP/Def2-SVP calculations of the Casida LCAO-TDDFT-- type Casida (1995, 2009) using the imaginary part of the dynamic polarizability (), LCAO-TDDFT-- (), PW-TDDFT-- and LCAO-TDDFT-- (). Overall, we find excellent agreement between PID, LCAO-TDDFT--, and TD-CAM-B3LYP/Def2-SVP. In fact, our LCAO-TDDFT-- calculations perform somewhat better than TD-CAM-B3LYP/Def2-SVP for describing the Q band energies of Chl a, Chl b, and (Chl a)2. These LCAO-TDDFT results, along with its computational speed-up, provide strong motivation for the future use of both LCAO-TDDFT-- and LCAO-TDDFT-- for describing larger systems such as the LHC II.
IV CONCLUSIONS
We have shown that LCAO-TDDFT-- Glanzmann et al. (2015); Preciado-Rivas, Torres-Sánchez, and Mowbray (2019); Lyon et al. (2019) and LCAO-TDDFT-- Kuisma et al. (2015) calculations are both significantly faster than their PW-TDDFT--, TD-CAM-B3LYP/Def2-SVP, and RS-TDDFT-- counterparts and also provide a similar level of accuracy to alternative TDDFT methods in the description of the optical absorption spectrum of the key photosynthetic light-harvesting molecules Chl a and b and the dimeric system (Chl a)2. Specifically, our LCAO-TDDFT-- and LCAO-TDDFT-- calculations provide both a semi-quantitative and qualitative description of the spectra of chlorophyll monomers and dimers, with the former yielding a significant reduction in memory requirements compared to PW-TDDFT-- and the latter yielding an order of magnitude speed-up compared to RS-TDDFT-- calculations due to the increased numerical stability of LCAO-TDDFT--. These results pave the way for future studies applying these highly efficient and accurate LCAO-TDDFT methods to the characterization of biomacromolecules, such as the LHC II, and the full understanding of the physical and chemical processes involved in photosynthesis.
Acknowledgements.
This work employed the Imbabura cluster of Yachay Tech University, which was purchased under contract No. 2017-024 (SIE-UITEY-007-2017), and the Quinde I supercomputer of Public Company Yachay E. P., which was implemented under contract No. 0051-2015, corresponding to Component No. 7 of Group No. 2, Re-YACHAY-018-2015. D.J.M. thanks the management and operation team of the Quinde I Supercomputer for their help and assistance in this project. A.H.L. acknowledges funding from the European Union’s Horizon 2020 research and innovation program under grant agreement no. 676580 with The Novel Materials Discovery (NOMAD) Laboratory, a European Center of Excellence; the European Research Council (ERC-2010-AdG-267374); Spanish grant (FIS2013-46159-C3-1-P); and Grupos Consolidados (IT578-13). The Coimbra Chemistry Centre is supported by FCT, through the Project PEst-OE/QUI/UI0313/2014 and POCI-01-0145-FEDER-007630. B.F.M. thanks the Portuguese Foundation for Science and Technology (projects CENTRO-01-0145-FEDER-000014 and POCI-01-0145-FEDER-032229) and the Donostia International Physics Centre for financial support.References
- Moss (1988) G. P. Moss, “Nomenclature of tetrapyrroles,” Euro. J. Biochem. 178, 277–328 (1988).
- Scheer (2006) H. Scheer, in Chlorophylls and Bacteriochlorophylls: Biochemistry, Biophysics, Functions and Applications, Advances in Photosynthesis and Respiration, Vol. 25 (Springer, Dordrecht, The Netherlands, 2006) Chap. 1, pp. 1–26.
- Siefermann-Harms (1985) D. Siefermann-Harms, “Carotenoids in photosynthesis. I. location in photosynthetic membranes and light-harvesting function,” Biochim. Biophysica Acta - Rev. Bioenerg. 811, 325–355 (1985).
- Long (2014) S. P. Long, “We need winners in the race to increase photosynthesis in rice, whether from conventional breeding, biotechnology or both,” Plant Cell Environ. 37, 19–21 (2014).
- Ray et al. (2013) D. K. Ray, N. D. Mueller, P. C. West, and J. A. Foley, “Yield trends are insufficient to double global crop production by 2050,” PLOS One 8, e66428 (2013).
- Ruban, Johnson, and Duffy (2011) A. V. Ruban, M. P. Johnson, and C. D. P. Duffy, “Natural light harvesting: Principles and environmental trends,” Energy Environ. Sci. 4, 1643–1650 (2011).
- Fleming et al. (2012) G. R. Fleming, G. S. Schlau-Cohen, K. Amarnath, and J. Zaks, “Design principles of photosynthetic light-harvesting,” Faraday Discuss. 155, 27–41 (2012).
- Allakhverdiev et al. (2010) S. I. Allakhverdiev, V. Thavasi, V. D. Kreslavski, S. K. Zharmukhamedov, V. V. Klimov, S. Ramakrishna, D. A. Los, M. Mimuro, H. Nishihara, and R. Carpentier, “Photosynthetic hydrogen production,” J. Photochem. Photobiol. C: Photochem. Rev. 11, 101–113 (2010).
- Krassen et al. (2009) H. Krassen, A. Schwarze, B. Friedrich, K. Ataka, O. Lenz, and J. Heberle, “Photosynthetic hydrogen production by a hybrid complex of photosystem I and [NiFe]-hydrogenase,” ACS Nano 3, 4055–4061 (2009).
- Berardi et al. (2014) S. Berardi, S. Drouet, L. Francas, C. Gimbert-Surinach, M. Guttentag, C. Richmond, T. Stoll, and A. Llobet, “Molecular artificial photosynthesis,” Chem. Soc. Rev. 43, 7501–7519 (2014).
- Searle and Malins (2014) S. Y. Searle and C. J. Malins, “Will energy crop yields meet expectations?” Biomass Bioenergy 65, 3–12 (2014).
- Gong et al. (2017) J. Gong, K. Sumathy, Q. Qiao, and Z. Zhou, “Review on dye-sensitized solar cells (DSSCs): Advanced techniques and research trends,” Renew. Sust. Energ. Rev. 68, 234–246 (2017).
- Agnihotri (2014) N. Agnihotri, “Computational studies of charge transfer in organic solar photovoltaic cells: A review,” J. Photochem. Photobiol. C: Photochem. Rev. 18, 18–31 (2014).
- Ahmad et al. (2016) R. Ahmad, Z. Ahmad, A. U. Khan, N. R. Mastoi, M. Aslam, and J. Kim, “Photocatalytic systems as an advanced environmental remediation: Recent developments, limitations and new avenues for applications,” J. Environ. Chem. Eng. 4, 4143–4164 (2016).
- Li (2009) X. Li, Optoelectronic Devices: Design, Modeling, and Simulation, 1st ed. (Cambridge University Press, New York, NY, USA, 2009).
- Geddes (2016) C. D. Geddes, ed., Reviews in Plasmonics 2016, 1st ed., Reviews in Plasmonics, Vol. 2016 (Springer, 2016).
- Milne et al. (2015) B. F. Milne, Y. Toker, A. Rubio, and S. Brøndsted Nielsen, “Unraveling the intrinsic color of chlorophyll,” Angew. Chem., Int. Ed. Engl. 54, 2170–2173 (2015).
- Stockett et al. (2015) M. H. Stockett, L. Musbat, C. Kjær, J. Houmøller, Y. Toker, A. Rubio, B. F. Milne, and S. Brønsted Nielsen, “The Soret absorption band of isolated chlorophyll a and b tagged with quaternary ammonium ions,” Phys. Chem. Chem. Phys. 17, 25793–25798 (2015).
- Milne et al. (2016) B. F. Milne, C. Kjær, J. Houmøller, M. H. Stockett, Y. Toker, A. Rubio, and S. Brøndsted Nielsen, “On the exciton coupling between two chlorophyll pigments in the absence of a protein environment: Intrinsic effects revealed by theory and experiment,” Angew. Chem., Int. Ed. Engl. 55, 6248–6251 (2016).
- Runge and Gross (1984) E. Runge and E. K. U. Gross, “Density-functional theory for time-dependent systems,” Phys. Rev. Lett. 52, 997–1000 (1984).
- Hedayatifar et al. (2016) L. Hedayatifar, E. Irani, M. Mazarei, S. Rasti, Y. T. Azar, A. T. Rezakhani, A. Mashaghi, F. Shayeganfar, M. Anvari, T. Heydari, A. R. Tabar, N. Nafari, M. A. Vesaghi, R. Asgari, and M. R. Rahimi Tabar, “Optical absorption and electronic spectra of chlorophylls a and b,” RSC Adv. 6, 109778–109785 (2016).
- Linnanto and Korppi-Tommola (2006) J. Linnanto and J. Korppi-Tommola, “Quantum chemical simulation of excited states of chlorophylls, bacteriochlorophylls and their complexes,” Phys. Chem. Chem. Phys. 8, 663–687 (2006).
- Dreuw and Head-Gordon (2004) A. Dreuw and M. Head-Gordon, “Failure of time-dependent density functional theory for long-range charge-transfer excited states: The zincbacteriochlorin–bacteriochlorin and bacteriochlorophyll–spheroidene complexes,” J. Am. Chem. Soc. 126, 4007–4016 (2004).
- Parusel and Grimme (2000) A. B. J. Parusel and S. Grimme, “A theoretical study of the excited states of chlorophyll a and pheophytin a,” J. Phys. Chem. B 104, 5395–5398 (2000).
- Jornet-Somoza et al. (2015) J. Jornet-Somoza, J. Alberdi-Rodriguez, B. F. Milne, X. Andrade, M. A. L. Marques, F. Nogueira, M. J. T. Oliveira, J. J. P. Stewart, and A. Rubio, “Insights into colour-tuning of chlorophyll optical response in green plants,” Phys. Chem. Chem. Phys. 17, 26599–26606 (2015).
- Konig and Neugebauer (2011) C. Konig and J. Neugebauer, “First-principles calculation of electronic spectra of light-harvesting complex II,” Phys. Chem. Chem. Phys. 13, 10475–10490 (2011).
- Kohn and Sham (1965) W. Kohn and L. J. Sham, “Self-consistent equations including exchange and correlation effects,” Phys. Rev. 140, A1133–A1138 (1965).
- Migani et al. (2013) A. Migani, D. J. Mowbray, A. Iacomino, J. Zhao, H. Petek, and A. Rubio, “Level alignment of a prototypical photocatalytic system: Methanol on TiO2(110),” J. Am. Chem. Soc. 135, 11429–11432 (2013).
- Salpeter and Bethe (1951) E. E. Salpeter and H. A. Bethe, “A relativistic equation for bound-state problems,” Phys. Rev. 84, 1232–1242 (1951).
- Onida, Reining, and Rubio (2002) G. Onida, L. Reining, and A. Rubio, “Electronic excitations: Density-functional versus many-body Green’s-function approaches,” Rev. Mod. Phys. 74, 601–659 (2002).
- Mowbray and Migani (2016) D. J. Mowbray and A. Migani, “Optical absorption spectra and excitons of dye-substrate interfaces: Catechol on TiO2(110),” J. Chem. Theor. Comput. 12, 2843–2852 (2016).
- Marques et al. (2006) M. A. L. Marques, C. A. Ullrich, F. Nogueira, A. Rubio, K. Burke, and E. K. U. Gross, eds., Time-Dependent Density Functional Theory (Springer, Berlin, Heidelberg, 2006).
- Yabana and Bertsch (1996) K. Yabana and G. F. Bertsch, “Time-dependent local-density approximation in real time,” Phys. Rev. B 54, 4484–4487 (1996).
- Yabana and Bertsch (1999) K. Yabana and G. F. Bertsch, “Time-dependent local-density approximation in real time: Application to conjugated molecules,” Int. J. Quant. Chem. 75, 55–66 (1999).
- Ghosh et al. (2017) S. Ghosh, A. Andersen, L. Gagliardi, C. J. Cramer, and N. Govind, “Modeling optical spectra of large organic systems using real-time propagation of semiempirical effective hamiltonians,” J. Chem. Theory Comput. 13, 4410–4420 (2017).
- Koh, Nguyen-Beck, and Parkhill (2017) K. J. Koh, T. S. Nguyen-Beck, and J. Parkhill, “Accelerating realtime TDDFT with block-orthogonalized Manby–Miller embedding theory,” J. Chem. Theory Comput. 13, 4173–4178 (2017).
- Casida (1995) M. E. Casida, “Time-dependent density functional response theory for molecules,” in Recent Advances in Density Functional Methods, Part I, edited by D. P. Chong (World Scientific, Singapore, 1995) pp. 155–192.
- Casida (2009) M. E. Casida, “Time-dependent density-functional theory for molecules and molecular solids,” J. Mol. Struct. (Theochem.) 914, 3–18 (2009).
- Yan, Thygesen, and Jacobsen (2011) J. Yan, K. S. Thygesen, and K. W. Jacobsen, “Nonlocal screening of plasmons in graphene by semiconducting and metallic substrates: First-principles calculations,” Phys. Rev. Lett. 106, 146803 (2011).
- Yan et al. (2011) J. Yan, J. J. Mortensen, K. W. Jacobsen, and K. S. Thygesen, “Linear density response function in the projector augmented wave method: Applications to solids, surfaces, and interfaces,” Phys. Rev. B 83, 245122 (2011).
- Mowbray (2014) D. J. Mowbray, “Theoretical electron energy loss spectroscopy of isolated graphene,” Phys. Status Solidi B 251, 2509–2514 (2014).
- Kuisma et al. (2010) M. Kuisma, J. Ojanen, J. Enkovaara, and T. T. Rantala, “Kohn-Sham potential with discontinuity for band gap materials,” Phys. Rev. B 82, 115106 (2010).
- Castelli et al. (2012) I. E. Castelli, T. Olsen, S. Datta, D. D. Landis, S. Dahl, K. S. Thygesen, and K. W. Jacobsen, “Computational screening of perovskite metal oxides for optimal solar light capture,” Energy Environ. Sci. 5, 5814–5819 (2012).
- Preciado-Rivas, Torres-Sánchez, and Mowbray (2019) M. R. Preciado-Rivas, V. A. Torres-Sánchez, and D. J. Mowbray, “Optical absorption and energy loss spectroscopy of single-walled carbon nanotubes,” (2019), arXiv:1907.08036.
- Lyon et al. (2019) K. Lyon, M. R. Preciado-Rivas, V. Despoja, and D. J. Mowbray, “LCAO-TDDFT--: Spectroscopy in the optical limit,” (2019), unpublished.
- Rossi et al. (2015) T. P. Rossi, S. Lehtola, A. Sakko, M. J. Puska, and R. M. Nieminen, “Nanoplasmonics simulations at the basis set limit through completeness-optimized, local numerical basis sets,” J. Chem. Phys. 142, 094114 (2015).
- Glanzmann et al. (2015) L. N. Glanzmann, D. J. Mowbray, D. G. F. del Valle, F. Scotognella, G. Lanzani, and A. Rubio, “Photoinduced absorption within single-walled carbon nanotube systems,” J. Phys. Chem. C 120, 1926–1935 (2015).
- Kuisma et al. (2015) M. Kuisma, A. Sakko, T. P. Rossi, A. H. Larsen, J. Enkovaara, L. Lehtovaara, and T. T. Rantala, “Localized surface plasmon resonance in silver nanoparticles: Atomistic first-principles time-dependent density-functional theory calculations,” Phys. Rev. B 91, 115431 (2015).
- Hohenberg and Kohn (1964) P. Hohenberg and W. Kohn, “Inhomogeneous electron gas,” Phys. Rev. 136, B864–B871 (1964).
- Blöchl (1994) P. E. Blöchl, “Projector augmented-wave method,” Phys. Rev. B 50, 17953–17979 (1994).
- Blöchl, Först, and Schimpl (2003) P. E. Blöchl, C. J. Först, and J. Schimpl, “Projector augmented wave method: Ab Initio molecular dynamics with full wave functions,” Bull. Mater. Sci. 26, 33–41 (2003).
- Rostgaard (2006) C. Rostgaard, Exact Exchange in Density Functional Calculations: An Implementation in the Projector Augmented Wave Method, Master’s thesis, Technical University of Denmark, Kongens Lyngby, Denmark (2006).
- Mortensen, Hansen, and Jacobsen (2005) J. J. Mortensen, L. B. Hansen, and K. W. Jacobsen, “Real-space grid implementation of the projector augmented wave method,” Phys. Rev. B 71, 035109 (2005).
- Enkovaara et al. (2010) J. Enkovaara, C. Rostgaard, J. J. Mortensen, J. Chen, M. Dułak, L. Ferrighi, J. Gavnholt, C. Glinsvad, V. Haikola, H. A. Hansen, H. H. Kristoffersen, M. Kuisma, A. H. Larsen, L. Lehtovaara, M. Ljungberg, O. Lopez-Acevedo, P. G. Moses, J. Ojanen, T. Olsen, V. Petzold, N. A. Romero, J. Stausholm-Møller, M. Strange, G. A. Tritsaris, M. Vanin, M. Walter, B. Hammer, H. Häkkinen, G. K. H. Madsen, R. M. Nieminen, J. K. Nørskov, M. Puska, T. T. Rantala, J. Schiøtz, K. S. Thygesen, and K. W. Jacobsen, “Electronic structure calculations with GPAW: A real-space implementation of the projector augmented-wave method,” J. Phys.: Condens. Matter 22, 253202 (2010).
- Larsen et al. (2009) A. H. Larsen, M. Vanin, J. J. Mortensen, K. S. Thygesen, and K. W. Jacobsen, “Localized atomic basis set in the projector augmented wave method,” Phys. Rev. B 80, 195112 (2009).
- Perdew, Burke, and Ernzerhof (1996) J. P. Perdew, K. Burke, and M. Ernzerhof, “Generalized gradient approximation made simple,” Phys. Rev. Lett. 77, 3865 (1996).
- Bahn and Jacobsen (2002) S. R. Bahn and K. W. Jacobsen, “An object-oriented scripting interface to a legacy electronic structure code,” Comput. Sci. Eng. 4, 56–66 (2002).
- Larsen et al. (2017) A. H. Larsen, J. J. Mortensen, J. Blomqvist, I. E. Castelli, R. Christensen, M. Dułak, J. Friis, M. N. Groves, B. Hammer, C. Hargus, E. D. Hermes, P. C. Jennings, P. B. Jensen, J. Kermode, J. R. Kitchin, E. L. Kolsbjerg, J. Kubal, K. Kaasbjerg, S. Lysgaard, J. B. Maronsson, T. Maxson, T. Olsen, L. Pastewka, A. Peterson, C. Rostgaard, J. Schiøtz, O. Schütt, M. Strange, K. S. Thygesen, T. Vegge, L. Vilhelmsen, M. Walter, Z. Zeng, and K. W. Jacobsen, “The atomic simulation environment—a python library for working with atoms,” J. Phys.: Condens. Matt. 29, 273002 (2017).
- Mowbray et al. (2013) D. J. Mowbray, A. Migani, G. Walther, D. M. Cardamone, and A. Rubio, “Gold and methane: A noble combination for delicate oxidation,” J. Phys. Chem. Lett. 4, 3006–3012 (2013).
- (60) The LCAO-TDDFT-- code is available free of charge from gitlab.com/lcao-tddft-k-omega/lcao-tddft-k-omega.
- Blackford et al. (1997) L. S. Blackford, J. Choi, A. Cleary, E. D’Azevedo, J. Demmel, I. Dhillon, J. Dongarra, S. Hammarling, G. Henry, A. Petitet, K. Stanley, D. Walker, and R. C. Whaley, ScaLAPACK Users’ Guide (Society for Industrial and Applied Mathematics, Philadelphia, PA, 1997).
- Crank and Nicolson (1947) J. Crank and P. Nicolson, “A practical method for numerical evaluation of solutions of partial differential equations of the heat conduction type,” Proc. Camb. Phil. Soc. 43, 50–67 (1947).
- Strange et al. (2008) M. Strange, I. S. Kristensen, K. S. Thygesen, and K. W. Jacobsen, “Benchmark density functional theory calculations for nanoscale conductance,” J. Chem. Phys. 128, 114714 (2008).