On the APOGEE DR14 sodium spread in the Galactic open cluster NGC 188
Abstract
Since several years ago, the search for multiple populations (MPs) in Galactic open clusters (OCs) has become a field of increasing interest, particularly to the light of the general knowledge that MPs are observed in relatively massive clusters ( 5 104 ). I report here measurements of stellar parameters and abundances of 17 different chemical species, including light and iron-peak elements of the old open cluster NGC 188, from the APOGEE DR14 database. I selected 15 bonafide cluster red giants that reveal an spread in [Na/Fe] of 0.16 dex, caused by two different groups of measurements whose mean [Na/Fe] values differ by 0.30 dex. A hint for a subtle anti-correlation with Al and Ti II, which also show relative large [X/Fe] dispersions, is also seen in the data. However, [Na/Fe] abundances have been found to be typically affected by uncertainties of 0.16 dex. Furthermore, I directly compared the available spectra for stars with similar atmospheric parameters and it would seem that they look similar. Therefore, I warn users of large spectroscopic surveys to be extra careful when finding peculiar abundance results. Analysis pipelines that run in an unsupervised fashion may produce bad results which may not be noticed before publication.
1 Introduction
Multiple populations (MPs) is a phenomenon commonly observed among Galactic globular clusters (GCs), which is characterized by the existence of stellar populations with distinctive chemical abundance patterns (Gratton et al., 2004; Bastian & Lardo, 2018; Marino et al., 2019). Some few studied much younger clusters have also shown chemically different stellar populations, which extends the MP phenomenon down to ages of 2 Gyr (Pancino, 2018; Martocchia et al., 2018; Hollyhead et al., 2019; Li & de Grijs, 2019).
As far as Galactic open clusters (OCs) are considered, some searches for MPs have been attempted (see e.g. de Silva et al., 2009; Pancino et al., 2010; Carrera & Martínez-Vázquez, 2013). Bragaglia et al. (2012) studied spectroscopically the 6 Gyr old OC Berkeley 39 and concluded that it is a single-population OC. Other 1.0-2.6 Gyr OCs (NGC 2158, 2420, 2682 and Berkeley 29) have also been studied by Carrera & Martínez-Vázquez (2013), who did not detect any anomalous spreads nor bimodalities in their CN and CH distributions. More recently, Cantat-Gaudin et al. (2014) studied the nearly 300 Myr old OC NGC 6705 as part of the Gaia-ESO survey, and found no sign of the expected MP behaviors between Al, Mg, Si, and Na abundances.
Here I analyze evidence of intrinsic spreads in the abundance of sodium – and to a lesser extent of Al and Si – in the old OC NGC 188 (age = 6.30.2 Gyr, Bonatto, 2019). This finding, would suggest a large age range to the lower limit of appearance of MPs, perhaps modulated by other parameters such as mass and metallicity.
This work is organized as follows. Section 2 describes the observational material employed and the criteria used to select a bonafide sample of red giant members. In Section 3 I analyze the selected data and discuss the observed hints of MPs in NGC 188. Finally, Section 4 summarises the main conclusions of this work.
2 Collected Data
I made use of stellar parameters and element abundances for 19 chemical species publicly available as part of the Sloan Digital Sky Survey IV, in particular of APOGEE DR14 (Blanton et al., 2017; Abolfathi et al., 2018). The aforementioned stellar properties have been determined by the APOGEE Stellar Parameters and Abundances pipeline (ASPCAP, García Pérez et al., 2016) from high-resolution ( = 22.500) near-infrared (1.51-1.69m) spectra and downloaded from the APOGEE webpage111http://www.sdss.org/dr14/. Observed spectra are used by ASPCAP to determine atmospheric parameters and chemical abundances by comparing them to libraries of theoretical spectra, using minimization in a multidimensional parameter space. Firstly, stellar parameters are derived from the entire APOGEE spectral range, and then the determination of individual chemical abundances is done from spectral windows optimized for each element.
I searched for any entry in the allStar-l31c.2 catalogue with the FIELD column containing the string N188. As a result, I gathered 758 stars distributed within a radius of 1.6 from the cluster center and with 2MASS mag down to 12.5 mag. For each star I collected its radial velocity (RV), effective temperature (), surface gravity (log()) and the chemical abundance ratios [C/Fe], [N/Fe], [O/Fe], [Na/Fe], [Mg/Fe], [Al/Fe], [Si/Fe], [P/Fe], [S/Fe], [K/Fe], [Ca/Fe], [Ti II/Fe], [V/Fe], [Cr/Fe], [Mn/Fe], [Co/Fe], [Ni/Fe] and [Fe/H], with their respective uncertainties.
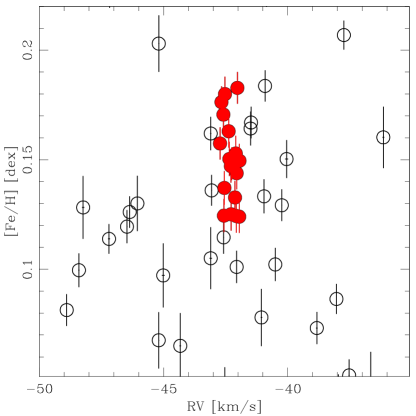
In order to disentangle bonafide cluster members from field stars I used the diagnostic plane [Fe/H] versus RV (see Fig. 1), which clearly highlights a group of stars tightly distributed around the known cluster RV = 42.40.1 km/s (Chumak et al., 2010) and metal content 0.12 [Fe/H] (dex) 0.20 (Hills et al., 2015; Bonatto, 2019)). The resulting mean and dispersion of the 15 selected stars (red filled circles, Table 1) turned out to be RV = -42.30 0.048 km/s, RV = 0.23 0.05 km/s, [Fe/H] = +0.16 0.01 dex and [Fe/H] = 0.02 0.01 dex, respectively. They are red giant stars with 4100 (K) 5000 and 1.5 log() 3.5, distributed within a circle with a radius of 25, which is nearly half of the cluster tidal radius (44.78, Wang et al., 2015).
A search into the Gaia DR2 archive (Gaia Collaboration et al., 2016, 2018) provided for the 15 bonafide members: mas/yr (median=–2.36); mas/yr (median=–0.91); and mas (median=0.51). The mean proper motions and parallax are fully compatible with the ones found in the literature (Platais et al., 2003). I found that there are no apparent subgroups or bi-modalities in the data.
| ID | R.A. () | Dec. (°) |
|---|---|---|
| 2M00320079+8511465 | 8.0032949 | 85.1962433 |
| 2M00415197+8527070 | 10.4665461 | 85.4519730 |
| 2M00444460+8532163 | 11.1858711 | 85.5378723 |
| 2M00454489+8504180 | 11.4370728 | 85.0716934 |
| 2M00463920+8523336 | 11.6633635 | 85.3926849 |
| 2M00533497+8511145 | 13.3957109 | 85.1873856 |
| 2M00533572+8520583 | 13.3988371 | 85.3495483 |
| 2M00541152+8515231 | 13.5480270 | 85.2564316 |
| 2M00542287+8455398 | 13.5953159 | 84.9277420 |
| 2M00543664+8501152 | 13.6526823 | 85.0208817 |
| 2M00571844+8510288 | 14.3268414 | 85.1746750 |
| 2M00581691+8540183 | 14.5704737 | 85.6717606 |
| 2M01003483+8503198 | 15.1451283 | 85.0555344 |
| 2M01015206+8506329 | 15.4669333 | 85.1091614 |
| 2M01025280+8517563 | 15.7200136 | 85.2989655 |
3 Analysis and discussion
Fig. 2 shows the relationships between [X/Fe] ratios for the different chemical species (X) considered. At first glance, it seems that they span different ranges, from a negligible dispersion (e.g., 0, Mg, S, P) up to visible spreads (e.g., Na, Ti II, V, Co). A similarly uneven behavior, especially in the light elements C, N, O, Na, Mg, and Al, is the fingerprint of MPs in GCs: [Na/Fe] is the flagship among these elements as a good indicator of the existence of MPs, with spreads of up to 0.6 dex and more and with no GC having a null spread. Conversely, O, Mg, Si, among others, do not necessary show a spread to make evident the existence of MPs (Carretta et al., 2009; Mészáros et al., 2015; Pancino et al., 2017), especially for metal-rich clusters. Another flagship element is [N/Fe], because it has never a negligible spread in GCs (Pancino et al., 2010; Mészáros et al., 2015), but here I do not see any significant variation, which is puzzling and requires further investigation.
In order to quantify the spreads of our [X/Fe]
ratios, I used the maximum likelihood approach by optimising the probability
that the sample of selected stars with [X/Fe]i ratios and
errors are drawn from a population with mean [X/Fe] and
dispersion W (e.g., Pryor & Meylan, 1993; Walker et al., 2006), as follows:
where the errors on the mean and dispersion were computed from the respective covariance matrices. Table 2 lists the resulting mean [X/Fe] ratios and the respective spreads W. As can be seen, the dispersion derived for Na, and also for Al and Ti II, reveal that there exist spreads. Additionally, some iron-peak elements (V, Co) also resulted with clear spreads in their mean [X/Fe] ratios. In the case of titanium, I note that Ti I does not show any spread ([Ti I/Fe]= 0.020.01 dex, W = 0.000.02 dex), thus casting some doubt on the robustness of the Ti II measurements, also in light of a slight trend observed with Teff. Similar trends are also observed for V and Co, while a flat trend is observed for Na and Al with both Teff and log.
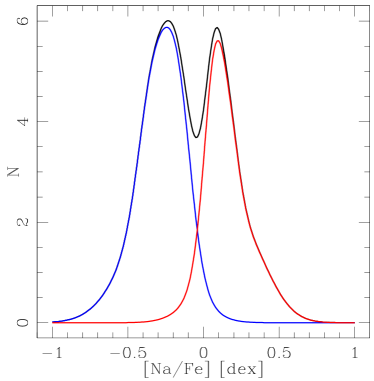
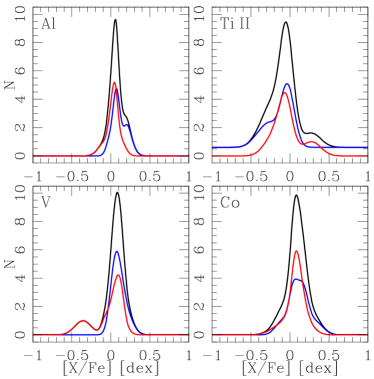
I then built [X/Fe] distributions for Na, Al, Ti II, V and Co by summing all the individual [X/Fe] values. I represented each [X/Fe] value by a Gaussian function with center and full-width half maximum equal to the [X/Fe] value and 2.355 times the associated error, respectively, and assigned to each Gaussian the same mean intensity. Thus, I avoid the problem of the histogram dependence on the bin size and the end points of bin, which frequently lead to a difficulty in interpreting the results. Furthermore, I here take into account the individual [X/Fe] uncertainties. The result is a continuous distribution – instead of a discrete histogram – that allows to appreciate the finest structures. Fig. 3 depicts the resulting [X/Fe] distributions. As can be seen, the [Na/Fe] dispersion derived from the maximum likelihood statistics is indeed bimodal, with two prominent peaks differing by 0.3 dex. I adopted the value [Na/Fe] = -0.05 dex as the boundary to distinguish them, which I will call Na-poor and Na-rich stars, respectively.
I performed additional checks in order to discard any artifacts in the data as responsible of the observed bimodality. I also searched all the ASPCAP flags and the Gaia astrometric flags for peculiarities in our sample stars, and could not find any. The spectra of Na-poor and Na-rich stars span indistinguishably SNR ranges 100-600, they have ASPCAPFLAG and NAFEFLAG values equals to zero, which means that there were no issues in the determination of the stellar parameters, and mean from the ASPCAP fit 8.0. The [Na/Fe] abundances have been derived from two Na features at about 16378 and 16393 Å, respectively (see Table 3 in García Pérez et al., 2016).
Na-poor and Na-rich stars seem to show a suggestive anti-correlation with a possibly bimodal Al distribution (Pearson correlation coefficient = -0.5), while the situation for Ti II, V, and Co is less clear. The derived WV and WCo values (see Table 2) appear to come rather from the presence of one star – a different one for V and Co – that statistically makes wider the [X/Fe] ranges. I discard these chemical species as showing intrinsic spreads due to the small number statistics.
Carretta et al. (2010) showed that there is a minimum (present-day) threshold mass of about a few 104 , for the MP phenomenon to come to the light. Indeed, as far as I am aware, NGC 6535 is the least massive GCs with evidence of MPs. Its estimated mass is 3.4 104 (Bragaglia et al., 2017). In the Galactic open cluster system, Berkeley 39 was targeted by Bragaglia et al. (2012) to explore the robustness of such a minimum mass (see their figure 1). Berkeley 39 is as old as NGC 188 (6 Gyr), with an estimated mass of 2 104 . Finally, they did not detect any trace of MPs, confirming Carretta et al. (2010)’s results.
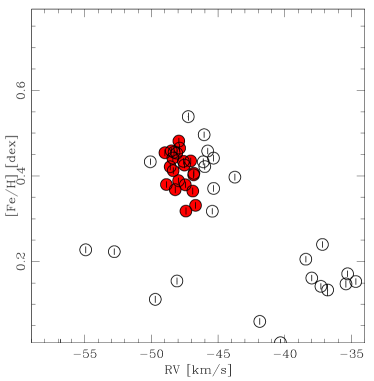
As a comparison, I consider NGC 6791, which is also an old OC (age = 7.70.4 Gyr, mass = 10.21.4 M⊙, Bonatto, 2019) targered by Bragaglia et al. (2014); Cunha et al. (2015) and Villanova et al. (2018) as an MP candidate. None of these three studies found evidence of MPs from the spectroscopic analysis of the observed cluster red giants. I took advantage of the APOGEE DR14 database to search for abundances of chemical elements of stars located in the cluster region. I found 21 stars that satisfy the requirement of having RVs and [Fe/H] metallicities around the OC’s values, namely, RV = -47.37 km/s (Kamann et al., 2019) and [Fe/H] = 0.40 0.07 dex (Heiter et al., 2014). I performed the same analysis carried out for NGC 188 and found no evidence of an spread in [Na/Fe] (see Fig. 4), in full agreement with past studies. Therefore, the observed large Na spread in NGC 188 would not seem to be caused by a general abundance determination problem in ASPCAP.
One of the causes of Na variations could in principle be non-LTE effects. However, according to Cunha et al. (2015), any non-LTE internal Na variation among the stars in our sample should remain well below 0.1 dex, and only a global offset should apply. This would be true for both NGC 188 and NGC 6791.
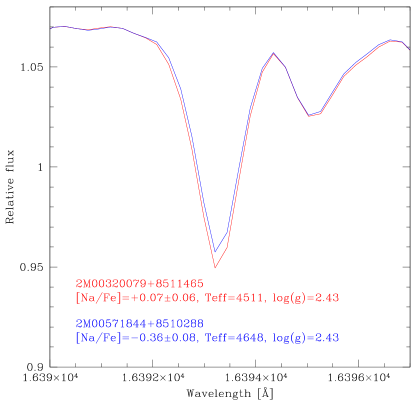
However, the [Na/Fe] abundances have been derived from two weak (in GK-giants) and possibly blended lines at about 16378 and 16393 Å, respectively, for which Jönsson et al. (2018) and Holtzman et al. (2018) showed that the Na uncertainty is of 0.16 dex. Furthermore, I directly compared the available spectra for stars with similar atmospheric parameters and it would seem that they look similar (see an example in Fig. 5). Therefore, I warn users of large spectroscopic surveys to be extra careful when finding peculiar abundance results. Analysis pipelines that run in an unsupervised fashion may produce bad results which may not be noticed before publication.


| Chemical | [X/Fe] | W |
|---|---|---|
| element | (dex) | (dex) |
| C | 0.00 0.01 | 0.03 0.01 |
| N | 0.34 0.01 | 0.03 0.01 |
| O | 0.01 0.01 | 0.00 0.01 |
| Na | -0.04 0.01 | 0.16 0.04 |
| Mg | 0.04 0.01 | 0.00 0.01 |
| Al | 0.06 0.01 | 0.05 0.01 |
| Si | 0.01 0.01 | 0.02 0.01 |
| P | -0.05 0.02 | 0.00 0.04 |
| S | -0.01 0.01 | 0.00 0.01 |
| K | 0.02 0.01 | 0.02 0.01 |
| Ca | -0.02 0.01 | 0.00 0.01 |
| Ti II | -0.07 0.03 | 0.10 0.03 |
| V | 0.06 0.02 | 0.08 0.02 |
| V* | 0.06 0.02 | 0.05 0.02 |
| Cr | 0.01 0.01 | 0.03 0.01 |
| Mn | 0.08 0.01 | 0.02 0.01 |
| Co | 0.10 0.02 | 0.05 0.02 |
| Ni | 0.03 0.01 | 0.02 0.01 |
(*) V values after removal of one very visible outlier in Fig. 2.
4 Conclusions
I exploited the APOGEE DR14 database searching for stellar parameters and element abundances of a wide variety of chemical species of stars in the field of the old OC NGC 188. I aimed at probing the existence of MPs as showed by their different [X/Fe] ratios. MPs are commonly observed in Galactic GCs and in younger clusters down to 2 Gyr old and perhaps younger. However, no galactic OC was confirmed to belong to the family of clusters with MPs so far.
A crucial point for embarking in such a search relies on the availability of accurate chemistry for a reasonable large sample of cluster members. While the accuracy of the [X/Fe] ratios are tied to that of ASPCAP, cluster membership can be assigned on the basis of stellar radial velocities, overall metallicities, Gaia astrometry, and position with respect to the cluster center. With these criteria, I could select a sample of 15 bonafide cluster red giants.
From a simple maximum likelihood statistics of the [X/Fe] ratios for 12 light-elements and 5 iron-peak ones, I found that those for Na, Al, Ti II, V, and Co show dispersions larger than 0.05 dex, and up to 0.16 dex; the remaining ones resulting with nearly null or null values. I noted that [X/Fe] differences between first and second generation stars in GCs also exhibit pattern of null values for some light-elements, while for others a significant difference is observed; Na and N being the most remarkable species that vary significantly in all GCs adequately observed so far.
By building the [X/Fe] distributions of the above mentioned 5 chemical elements, I found that the derived spread in [Na/Fe] is caused by two groups of measurements with a mean difference [Na/Fe] 0.30 dex. The absence of a significant spread in N and a possible anti-correlation with Al – while generally Na and Al correlate in GCs – would need to be fully understood. On the other hand, the resulting distributions for V and Co showed that the derived dispersions come from the presence of one isolated star which widen the whole [X/Fe] range, and thus are not significant. Similarly, the fact that the large Ti II spread is not mirrored by a similar spread in Ti I casts doubts on its significance. Finally, the very similar shapes around the Na lines of the spectra of two stars with similar atmospheric parameters warned me to conclude on any intrinsic spread, but rather to be careful in its interpretation.
References
- Abolfathi et al. (2018) Abolfathi, B., Aguado, D. S., Aguilar, G., et al. 2018, ApJS, 235, 42, doi: 10.3847/1538-4365/aa9e8a
- Bastian & Lardo (2018) Bastian, N., & Lardo, C. 2018, ARA&A, 56, 83, doi: 10.1146/annurev-astro-081817-051839
- Blanton et al. (2017) Blanton, M. R., Bershady, M. A., Abolfathi, B., et al. 2017, AJ, 154, 28, doi: 10.3847/1538-3881/aa7567
- Bonatto (2019) Bonatto, C. 2019, MNRAS, 483, 2758, doi: 10.1093/mnras/sty3291
- Bragaglia et al. (2017) Bragaglia, A., Carretta, E., D’Orazi, V., et al. 2017, A&A, 607, A44, doi: 10.1051/0004-6361/201731526
- Bragaglia et al. (2012) Bragaglia, A., Gratton, R. G., Carretta, E., et al. 2012, A&A, 548, A122, doi: 10.1051/0004-6361/201220366
- Bragaglia et al. (2014) Bragaglia, A., Sneden, C., Carretta, E., et al. 2014, ApJ, 796, 68, doi: 10.1088/0004-637X/796/1/68
- Cantat-Gaudin et al. (2014) Cantat-Gaudin, T., Vallenari, A., Zaggia, S., et al. 2014, A&A, 569, A17, doi: 10.1051/0004-6361/201423851
- Carrera & Martínez-Vázquez (2013) Carrera, R., & Martínez-Vázquez, C. E. 2013, A&A, 560, A5, doi: 10.1051/0004-6361/201322048
- Carrera & Martínez-Vázquez (2013) Carrera, R., & Martínez-Vázquez, C. E. 2013, A&A, 560, A5, doi: 10.1051/0004-6361/201322048
- Carretta et al. (2009) Carretta, E., Bragaglia, A., Gratton, R., D’Orazi, V., & Lucatello, S. 2009, A&A, 508, 695, doi: 10.1051/0004-6361/200913003
- Carretta et al. (2010) Carretta, E., Bragaglia, A., Gratton, R. G., et al. 2010, A&A, 516, A55, doi: 10.1051/0004-6361/200913451
- Chumak et al. (2010) Chumak, Y. O., Platais, I., McLaughlin, D. E., Rastorguev, A. S., & Chumak, O. V. 2010, MNRAS, 402, 1841, doi: 10.1111/j.1365-2966.2009.16021.x
- Cunha et al. (2015) Cunha, K., Smith, V. V., Johnson, J. A., et al. 2015, ApJ, 798, L41, doi: 10.1088/2041-8205/798/2/L41
- de Silva et al. (2009) de Silva, G. M., Gibson, B. K., Lattanzio, J., & Asplund, M. 2009, A&A, 500, L25, doi: 10.1051/0004-6361/200912279
- Gaia Collaboration et al. (2016) Gaia Collaboration, Prusti, T., de Bruijne, J. H. J., et al. 2016, A&A, 595, A1, doi: 10.1051/0004-6361/201629272
- Gaia Collaboration et al. (2018) Gaia Collaboration, Brown, A. G. A., Vallenari, A., et al. 2018, A&A, 616, A1, doi: 10.1051/0004-6361/201833051
- García Pérez et al. (2016) García Pérez, A. E., Allende Prieto, C., Holtzman, J. A., et al. 2016, AJ, 151, 144, doi: 10.3847/0004-6256/151/6/144
- Gratton et al. (2004) Gratton, R., Sneden, C., & Carretta, E. 2004, ARA&A, 42, 385, doi: 10.1146/annurev.astro.42.053102.133945
- Heiter et al. (2014) Heiter, U., Soubiran, C., Netopil, M., & Paunzen, E. 2014, A&A, 561, A93, doi: 10.1051/0004-6361/201322559
- Hills et al. (2015) Hills, S., von Hippel, T., Courteau, S., & Geller, A. M. 2015, AJ, 149, 94, doi: 10.1088/0004-6256/149/3/94
- Hollyhead et al. (2019) Hollyhead, K., Martocchia, S., Lardo, C., et al. 2019, MNRAS, 484, 4718, doi: 10.1093/mnras/stz317
- Holtzman et al. (2018) Holtzman, J. A., Hasselquist, S., Shetrone, M., et al. 2018, AJ, 156, 125, doi: 10.3847/1538-3881/aad4f9
- Jönsson et al. (2018) Jönsson, H., Allende Prieto, C., Holtzman, J. A., et al. 2018, AJ, 156, 126, doi: 10.3847/1538-3881/aad4f5
- Kamann et al. (2019) Kamann, S., Bastian, N. J., Gieles, M., Balbinot, E., & Hénault-Brunet, V. 2019, MNRAS, 483, 2197, doi: 10.1093/mnras/sty3144
- Li & de Grijs (2019) Li, C., & de Grijs, R. 2019, arXiv e-prints. https://arxiv.org/abs/1904.00508
- Marino et al. (2019) Marino, A. F., Milone, A. P., Renzini, A., et al. 2019, arXiv e-prints. https://arxiv.org/abs/1904.05180
- Martocchia et al. (2018) Martocchia, S., Cabrera-Ziri, I., Lardo, C., et al. 2018, MNRAS, 473, 2688, doi: 10.1093/mnras/stx2556
- Mészáros et al. (2015) Mészáros, S., Martell, S. L., Shetrone, M., et al. 2015, AJ, 149, 153, doi: 10.1088/0004-6256/149/5/153
- Pancino (2018) Pancino, E. 2018, A&A, 614, A80, doi: 10.1051/0004-6361/201732351
- Pancino et al. (2010) Pancino, E., Rejkuba, M., Zoccali, M., & Carrera, R. 2010, A&A, 524, A44, doi: 10.1051/0004-6361/201014383
- Pancino et al. (2017) Pancino, E., Romano, D., Tang, B., et al. 2017, A&A, 601, A112, doi: 10.1051/0004-6361/201730474
- Platais et al. (2003) Platais, I., Kozhurina-Platais, V., Mathieu, R. D., Girard, T. M., & van Altena, W. F. 2003, AJ, 126, 2922, doi: 10.1086/379677
- Pryor & Meylan (1993) Pryor, C., & Meylan, G. 1993, in Astronomical Society of the Pacific Conference Series, Vol. 50, Structure and Dynamics of Globular Clusters, ed. S. G. Djorgovski & G. Meylan, 357
- Villanova et al. (2018) Villanova, S., Carraro, G., Geisler, D., Monaco, L., & Assmann, P. 2018, ApJ, 867, 34, doi: 10.3847/1538-4357/aae4e5
- Walker et al. (2006) Walker, M. G., Mateo, M., Olszewski, E. W., et al. 2006, AJ, 131, 2114, doi: 10.1086/500193
- Wang et al. (2015) Wang, J., Ma, J., Wu, Z., Wang, S., & Zhou, X. 2015, AJ, 150, 61, doi: 10.1088/0004-6256/150/2/61