Modeling rotational disruption of grains and microwave emission from spinning dust in AGB envelopes
Abstract
Radio observations of some Asymptotic Giant Branch (AGB) star envelopes show the excess emission at frequencies below 100 GHz which cannot be explained by thermal dust emission (hereafter anomalous microwave emission-AME). Moreover, AGB envelopes are a common place where gas molecules condense to form nanoparticles (e.g., polycyclic aromatic hydrocarbons) and large grains. In this paper, we will study whether electric dipole emission from rapidly spinning nanoparticles can reproduce the AME observed toward AGB stars. To properly model the size distribution of nanoparticles in the AGB envelope, we take into account both the increase of nanoparticles due to rotational disruption of large grains spun-up by radiative torques and the decrease of smallest nanoparticles due to rotational disruption driven by stochastic gas collisions. We then perform detailed modeling of microwave emission from rapidly spinning nanoparticles from both C-rich and O-rich AGB envelopes using the grain size distribution constrained by rotational disruption. We find that spinning dust emission is dominant over thermal dust emission at frequencies below 100 GHz. We attempt to fit the observational data of AME using our spinning dust model and demonstrate that spinning dust can reproduce the observed AME in six AGB stars. Finally, we discuss that microwave emission from spinning dust in AGB envelopes could be observed with high-resolution upcoming radio telescopes such as ngVLA and ALMA Band 1. This would be a major leap for understanding AGB envelopes, formation, evolution, and internal structures of dust. Observations would help to distinguish the carrier of AME from comparing C-rich to O-rich stars, because PAHs are formed in C-rich AGB stars while silicates are formed in O-rich stars.
1 Introduction
Late in their evolution, low- and intermediate-mass stars (1–8 M⊙) reach the Asymptotic Giant Branch (AGB) phase, before they become white dwarfs. During this phase, AGB stars lose most of its material (Lamers & Cassinelli, 1999) because radiation pressure accelerates them to speeds above the star’s escape velocity. Mass-loss builds an expanding circumstellar envelope (CSE) around the star, containing dust and gas (e.g., Olofsson et al. 2010; Ramstedt et al. 2011; Cox et al. 2012). CSEs of AGB stars can be considered as the most significant chemical laboratories in the universe because their effective temperatures are usually low ( 2000 K - 3500 K), and the mass-loss timescale is long, so that molecules can form in the envelope through chemical and physical processes (e.g., Cernicharo et al. 2000; Tenenbaum et al. 2010).
It is well-known that in the AGB envelopes, simple molecules condense to form complex molecules and then tiny nanoparticles including polycyclic aromatic hydrocarbons (PAHs), and finally to submicron-sized grains before being expelled into the ISM due to radiation pressure. Theoretical studies on the formation of PAHs in the evolved star envelope is well studied (see Cherchneff 2011 and references therein). While observation evidence of dust grains from AGB envelopes is well established thanks to infrared emission from dust grains. However, observational evidence for the existence of PAHs which are demonstrated through mid-IR emission features at 3.3, 6.2, 7.7, 8.6, 11.3, and 17 m (Leger & Puget 1984; Allamandola et al. 1985; Smith et al. 2007; Draine & Li 2007) is not yet available (see Tielens 2008 for a review). The underlying reason for that is during the AGB stage, the star temperature is rather low, such that there lacks of UV photons to trigger mid-IR emission of PAHs. One note that prominent PAH features are usually observed at the later stage such as planetary nebula due to higher temperatures of the central star. Therefore, in order to achieve a complete understanding on the formation of dust in AGB star envelopes, it is necessary to seek a new way to observe PAHs/nanoparticles in these environments.
Modern astrophysics establishes that rapidly spinning nanoparticles that have permanent electric dipole moment (e.g., PAHs, nanosilicates, nanoiron particles) can emit electric dipole radiation at microwave frequencies below 100 GHz (Draine & Lazarian 1998; Hoang et al. 2010; Hoang et al. 2016; Hoang, & Lazarian 2016). The rotational excitation of nanoparticles can be achieved in the absence of UV photons, such that microwave emission from spinning dust can be efficient in the environments without UV photons like AGB envelopes and dense shocked regions (Hoang & Tram 2019; Tram & Hoang 2019). Therefore, microwave emission could be a unique way for us to probe nanoparticles in the envelope of AGB stars. In particular, with upcoming advanced radio telescopes, e.g., ALMA Band 1, the Square Kilometer Array (SKA), and next generation VLA (ngVLA), the potential of observing nanoparticles via spinning dust emission is very promising, which would allow us to have a better understanding on their formation and evolution in general.
Interestingly, previous radio observations show the anomalous microwave emission (AME) at frequencies below 100 GHz from the CSEs around some AGB stars that cannot be explained by thermal dust emission, such as from IRC +10216 (Sahai et al. 1989 and Menten et al. 2006), or from VY CMa, IRc +10216, CIT 6 and R Leo (Knapp et al. 1995), or from Her, IRC +10216, IRC +20370, WX Psc, Sco, V Hya (Dehaes et al. 2007). To date, the origin of such excess is not well understood. Therefore, the goal of this paper is to perform detailed modeling of spinning dust emission from nanoparticles in AGB stars and explore whether spinning dust mechanism can explain such AME.
To model the emission from spinning dust, we consider the radiation-driven wind model, which starts from dust-formation zone (i.e., 5-10R∗), where the temperature varying from 1000 K down to 600 K and a total number density varying from to cm-3. Furthermore, dust grains are classified by their spectral features and they correspond to a special kind of envelope properties. Silicates, identified at 9.7 and 18 m are considered as a major feature of oxygen-rich stars () (Kwok 2004). In contrast, in carbon-rich stars (), one expect to observe prominent mid-IR features from PAHs. In this paper, we will model the microwave emission from spinning PAHs for a typical representative of carbon-rich AGB stars (IRC +10216) and from nanosilicates for a typical representative of oxygen-rich AGB stars (IK Tau).
Owing to their large sizes, AGB stars are among the most luminous objects in the sky, with luminosities of order . Thus, the radiation field in their CSEs is remarkable strong. Recently, Hoang et al. (2019) showed that a strong radiation field can torque large dust grains up to revolutions per second, at which rate the centrifugal force can disrupt a large grain into smaller ones. In addition, Hoang & Tram (2019) and Tram & Hoang (2019) showed that very small grains (referred to nanoparticles whose sizes are lower 10 nm) can be spun up to suprathermal rotation by stochastic torques induced by gas bombardment in a dense and hot medium. As a result, smallest nanoparticles are disrupted into smaller tiny fragments when the centrifugal force excesses the material strength, after which dust particles are thermally sublimated into the gas phase (Guhathakurta & Draine 1989). These two disruption mechanisms are then taken into account in our model because they can modify the size distribution of dust grains in AGB envelopes.
The structure of this paper is as follows. Section 2 describes the parametric physical model of AGB envelopes. We constrain the upper limit of size of grains by RATD mechanism in Section 3, and the lower limit of size of nanoparticles by mechanical torques in Section 4. In Section 5, we review the spinning dust model, and calculate the SED from spinning dust for two examples of AGB stars. An extended discussion on implications of our results for explaining AME in AGB envelopes in Section 6. A summary of our main results is presented in Section 7.
2 Physical model of AGB envelopes
During the AGB phase, a star loses most of its mass through stellar winds. Very close to the central star, where it is too hot for dust grains to form, the ejection mechanism is not well unified yet. The pulsation process is believed to accelerate gas above the escape velocity, sending it radially outward (e.g., Hoefner & Dorfi 1997, Willson 2000; and see Tram et al. 2018 for review). Farther from the star, where the gas temperature decreases to the condensation temperatures, dust grain form. Subsequently, dust grains are accelerated by radiation pressure and transfer their momentum to gas molecules through collisions. Collisions result in a drag force (Gilman, 1972) that allows gas beyond the dust-formation distance to overcome the gravitational well of the star. The resulting winds are called dust-driven or radiation-driven winds. Here we briefly describe our parametric physical model of AGB envelopes for a radiation-driven wind, which will be used as the framework for calculating rotational disruption of dust grains and spinning dust emission.
2.1 Gas density profile
Let be the rate of mass loss of an AGB star, and we assume a spherical envelope. The gas density at distance is then given by
| (1) |
where is the expansion velocity of the outflow. The typical mass loss rates are – yr-1. For cold AGB stars, we take amu because hydrogen in the CSE around these stars is predominantly molecular (Glassgold & Huggins 1983; Tram et al. 2018). For hot AGB stars, on the contrary, the atomic form of hydrogen dominate the CSE, therefore we take amu (90% H and 10% He). The critical temperature to distinguish cold or hot AGB stars depends on the density of stellar photosphere, e.g., for stars with density (Tram et al. 2018). The expansion velocity is likely constant for a radiation-driven wind model as demonstrated by Tielens (1983) and Krueger et al. (1994).
2.2 Gas Temperatures
In the envelope beginning at the condensation radius (), where the gas expands adiabatically at constant , the radiative heating is dominant because the gas is weakly or not longer shielded by dust so that the temperature drops gradually with the distance, and we approximate its profile as a power law as: (e.g., Mamon et al. 1988; Agúndez & Cernicharo 2006; Decin et al. 2010; Li et al. 2016):
| (2) |
where , , and are parameters whose values are given in Table 1.
2.3 Grain temperature
The grain temperature evolution is determined by the balance between the heating and cooling rates. Grains are heated by collisions with the gas particles and by absorption of stellar or ambient radiation. Grains are cooled by collisional energy transfer and by thermal radiation. The detailed profile of dust temperature in a realistic envelope can be modeled by solving the radiative transfer equation for a given dust opacity (Winters et al. 1994). But we assume here that the stellar radiation dominates. In the simple case when the grain absorption efficiency can be approximated as a power-law of waveleght , the dust temperature can be derived as (Habing & Olofsson 2003):
| (3) |
where and are the temperature and radius of star. Observations suggest .
2.4 Physical properties of a C-star and an O-star
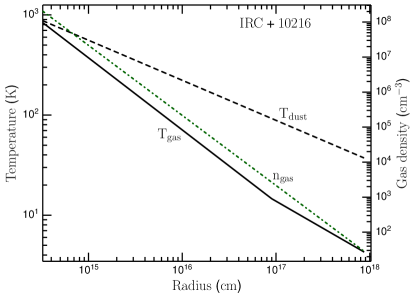
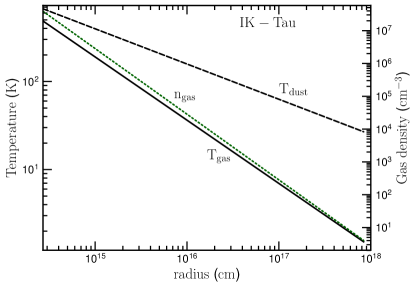
We apply the parametric models described above to calculate the physical properties of the freely expanding wind in CSE around the well-known C-rich AGB stars (namely IRC +10216) and O-rich (namely IK Tau) as illustrated in Figure 1. For IRC +10216, the profile of gas temperature is taken from Mamon et al. (1988), who fitted the power-law to the theoretical results of Kwan & Linke (1982). For IK Tau, we similarly fit the power-law to the gas temperature profile that is derived from observational lines (Decin et al. 2010). Other parameters are listed in Table 1 with the references given.
| Parameters | IRC +10216 | IK Tau |
|---|---|---|
| () | (1)8640 | (9)7700 |
| ( yr-1) | (2)2 | (10) |
| (K) | (3) 2200 | (9,10)2100 |
| (K) | (4)14.6 | (11)707 |
| (cm) | (5) | (10) |
| () | (6)5 | 8.7 |
| () | (4)1385 | (11)5.20 |
| () | (7) | (12) |
| (km s-1) | (8)14.5 | (13)24 |
| (4)0.72 () | (11)0.79 | |
| () | ||
| (pc) | (5)130 | (9)265 |
References. (1) Menten et al. (2012); (2) Crosas & Menten (1997); (3) Matthews et al. (2015), (4) taken from the fit of Mamon et al. (1988) to Kwan & Linke (1982); (5) Tram et al. (2018); (6) Agúndez & Cernicharo (2006); (7) Sahai & Chronopoulos (2010); (8) Knapp et al. (1998); (9) Maercker et al. (2016), (10) De Beck et al. (2010) , (11) fit to Decin et al. (2010), (12) Decin et al. (2010), (13) Justtanont et al. (2012)
2.5 Drift velocity for nanoparticles
Once dust grains have formed, they scatter and absorb stellar photons, leading to a radiative force that pushes them outwards away from the star. The radiation force on a grain of radius at distance due to the central star is given by
| (4) |
where is the speed of light, is the radiation pressure efficiency, and is the wavelength averaged radiation pressure efficiency weighted by the stellar spectrum, and is the total stellar luminosity. Let be the drift velocity of grains through the gas. If the drift speed is much larger than the thermal speed of gas particles, the drag force per unit volume of the gas is , where a is the radius of a single grain.111When the drift velocity is above a percent of the light speed, the drag force decreases with increasing the velocity, as discovered in Hoang (2017). On the other hand, if the drift speed is lower than the thermal speed of the gas, the drag force . To combine those limits, we can express the drag force as follows:
| (5) |
Because the mean free path of the gas is higher than the typical dust radii, and the velocities of gas and dust are different, the grains are not position coupled to the gas. Despite the fact that the grains collide with only a small fraction of the gas particles, Gilman (1972) indicates that the subsequent collisions among the gas molecules allow the momentum that they receive from the radiation field to be transferred to the gas. Gilman (1972) also demonstrates that the small grains rapidly reach the terminal drift velocity. The grains move at the terminal drift velocity when the radiation force balances the drag force:
| (6) |
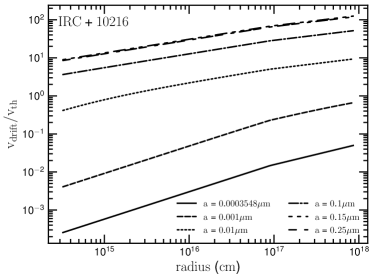
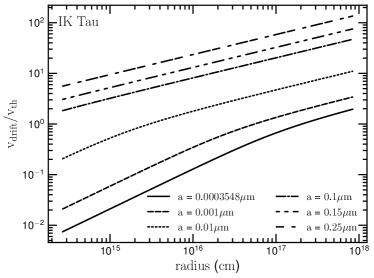
where is the sound speed in the gas. We define the dimensionless drifting parameter . As a limitation, if the thermal speed is much smaller than speed of outflow and the grain size is much smaller than wavelength, and therefore , which means the drift between gas and big dust grains is larger than that of small dust grains.
In Figure 2, we show the normalized grain drift velocity calculated for the different grain sizes. The drift velocity tends to increase with increasing the distance because of the decrease of the gas temperature. Large grains can be accelerated to supersonic motion, while smallest nanoparticles of size nm are mostly moving at subsonic speeds.
2.6 Ionization
In the AGB and post-AGB stages, the star is relatively cool, with K. Therefore, its ionizing radiation is negligible, and the gas remains mostly neutral. In the stage of PN, the star has contracted to a white dwarf with high temperature, and the envelope is ionized. Nanoparticles in the outer envelope will be affected by interstellar UV photons which also ionize gas atoms. The most abundant species in C-rich and O-rich stars are listed in Table 2 with references.
|
|
3 Rotational disruption of large grains by radiative torques
3.1 Radiation field from an AGB star
In this paper, we are considering the radiative-driven wind, which should start from the dust condensation zone. Normally, this zone is located quite far from the central star (e.g., 5 for the case of IRC +10216). Thus we can neglect the angle-dependence of radiation field to dust grain particles. Therefore, the radiation energy density from an AGB star at a distance is:
| (7) |
where , and is the total optical depth. The averaged interstellar radiation field (ISRF) from other Milky Way stars has energy density (Mathis et al. 1983). The relative strength of the radiation field from the AGB star is then
| (8) |
For IRC +10216 at , , whereas at is (neglecting extinction).
3.2 Rotational disruption by radiative torques
As revealed in Hoang et al. (2019), a strong radiation field can spin large grains up to a maximum angular velocity:
| (9) |
where is the grain inertial moment, is the radiative torque (Draine & Weingartner 1996; Lazarian & Hoang 2007; Hoang & Lazarian 2008; Herranen et al. 2019), and is the total damping timescale.
The averaged radiative torque applied on a grain of irregular shape with effective size is (see Hoang et al. 2019 and reference theirin):
| (10) |
where is the degree of anisotropy of the radiation field (), is the average wavelength of the radiation field (i.e., m for IRC +10216 and m for IK Tau). Above, the radiative torque efficiency averaged over the radiation spectrum is approximately for , and for . However, we adopt the maximum of grain size to be m as deduced from observations (Mathis et al. 1977). Therefore, we just consider in this work.
The total rotational damping of dust grains consists of collisional damping due to collisions with gas species (Jones & Spitzer 1967) and the IR damping due to IR emission, and the characteristic damping time is described by (see Hoang et al. 2019):
| (11) |
where the characteristic timescale of collisional damping is
| (12) |
with being the proton number density, and the dimensionless IR damping coefficient
| (13) |
where , and . Here we have assumed that dust grains are in the thermal equilibrium established by radiative heating of starlight and radiative cooling by IR emission.
Equation (3.2) reveals that the rotational rate induced by RATs depends on the term and . Thus, grains at in CSE of IRC +10216, where , can be spun-up to . However, when a grain of size of is rotating at an angular velocity , it develops a centrifugal stress due to the centrifugal force which scales as (Hoang et al. 2019). Then, if the rotation rate increases to a critical limit such that the stress induced by centrifugal force exceeds the tensile strength of the material, grains are disrupted instantaneously. The critical angular velocity for the disruption is given by:
| (15) | |||||
where is the maximum tensile strength of dust material and .222An equivalent unit for the tensile strength is ; in this paper we use the unit of for convenience.
The exact value of depends on the dust grain composition and structure. Compact grains can have higher than porous grains. Ideal material without impurity, such as diamond, can have . Burke & Silk (1974) suggested that for polycrystalline bulk solids (see also Draine & Salpeter 1979). Composite grains as suggested by Mathis & Whiffen (1989) would have much lower strength. In Draine & Salpeter (1979), the value is taken for small graphite grains. In the following, nanoparticles with are referred to as strong materials, and those with are called weak materials.
For each location in the AGB envelope with given , and , one can obtain the critical grain size of rotational disruption by radiative torques by setting .
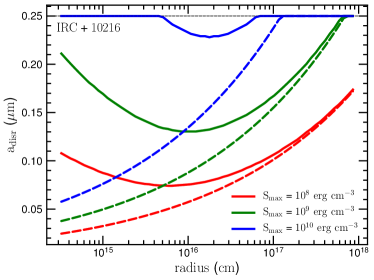
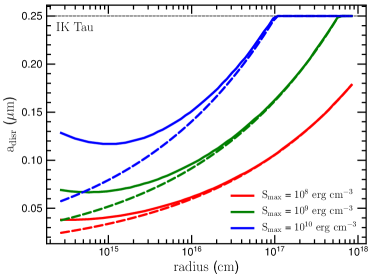
Figure 3 shows the disruption size of dust grains by radiative torques with respect to distance from C-rich star IRC +10216 and O-rich star IK Tau, assuming the different tensile strengths. Very close to the star, rotational damping by gas collisions is very efficient because and and dominates over IR damping (i.e., ), resulting in a very short damping timescale ( yr). As a result, grains lose their angular momentum rapidly and cannot be spun up to critical rotation rates, and large grains can survive rotational disruption. Farther away from the star, the rotational damping rate is decreased due to the rapid decrease of and with distance , large grains can be spun-up to extremely fast rotation by radiative torques and are disrupted into small sub-fragments. The disruption size decreases with increasing distance from the star. Finally, when grains are far enough from the star, the collisional damping is subdominant compared to IR damping, i.e., and and the disruption size of grains can be analytically estimated as (Hoang et al. 2019; Hoang 2019):
| (16) |
which does not depend on the gas properties as shown by the dashed lines.
4 Rotational disruption of nanoparticles by stochastic mechanical torques
4.1 Rotational dynamics of nanoparticles
In dense regions, such as the CSE of AGB stars, Jones & Spitzer (1967) showed that collisions with gas atoms and molecules rotate dust grains. In addition, nanoparticles are directly bombarded by molecules and atoms (including elements heavier than H), and they experience long-distance interactions with passing ions (Draine & Lazarian 1998; Hoang et al. 2010; Hoang & Tram 2019).
Following Jones & Spitzer (1967) and Hoang & Tram (2019), one can define the dimensionless damping and excitation coefficients for interaction processes with respect to the damping and excitation coefficients of purely hydrogen neutral-grain collisions as:
| (17) | |||||
| (18) |
where and are the mean decrease of grain angular momentum along the r-axis and the mean increase of rotational energy per unit time by colliding with pure hydrogen, respectively, and is the thermal angular momentum of grains at temperature . The dimensionless damping () and excitation () coefficients are defined respectively as:
| (19) | |||||
| (20) |
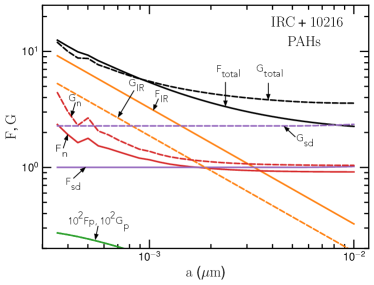
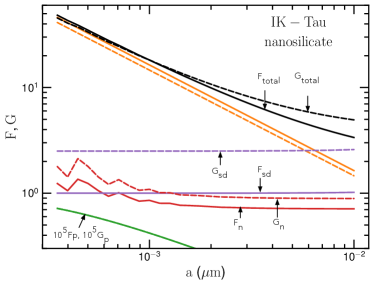
where suffixes , , , , and stand for gas-grain drift, Infrared, neutral, plasma, and ion, respectively. and are computed as in Roberge et al. (1995) (the details are described in Section 3 in Hoang & Tram 2019), whereas other coefficients are computed as described in Sections 4 and 5 in Draine & Lazarian (1998). Note that for grain collisions with purely atomic hydrogen gas. Figure 4 shows the obtained values of and for various processes for PAH and silicates grains. As shown, IR emission is dominant for rotational damping of the smaller grains ( m) and gas-grain drift is dominant for larger grains.
Let be the rotational temperature of spinning nanoparticles, so that . Thus, using the rms angular velocity from Draine & Lazarian (1998), we obtain
| (21) |
where and are the characteristic damping times due to gas collisions and electric dipole emission (see Draine & Lazarian 1998). As (see Hoang et al. 2010), this ratio is much bigger than 1 as long as . Therefore, , i.e., the rotational temperature is only determined by the rotational damping () and excitation () coefficients.
Accordingly, the rotation rate at the rotational temperature is given by
| (22) | |||||
4.2 Rotational disruption of nanoparticles by stochastic mechanical torques
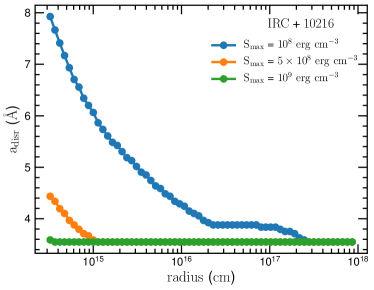
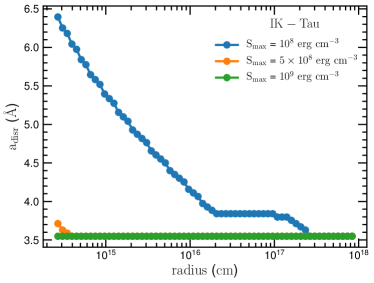
To calculate the smallest size that nanoparticles can withstand the rotational disruption, we compute using the rotational temperature as given by Equation (21) at each radius for a grid of grain sizes from nm and compare it with .
Figure 5 shows the obtained minimum size as a function of radius in CSE for different values of and two AGB models. Strong nanoparticles can survive (green line), while weak nanoparticles can be destroyed (blue and orange lines). The disruption size drops gradually with distance from central star due to the rapid decrease of gas temperature with distance.
5 Spinning dust emission
The emission from spinning dust is detailed in Hoang & Tram (2019). In this section, we briefly recall the principles of this model.
5.1 Size distribution of nanoparticles modified by rotational disruption
In the case without rotational disruption, we assume that dust grains in AGB envelopes consist of two populations, very small grains (nanoparticles) and larger grains, which we refer to as the original dust populations. In the presence of rotational disruption, smallest nanoparticles are removed by mechanical torques, whereas large grains are disrupted into smaller fragments which comprise nanoparticles, corresponding to the modified dust population. The size distribution of these modified dust populations is unknown, and below we adopt a simplified strategy to model their size distributions.
Since disruption by mechanical torques occurs at the lower end of the size distribution and disruption by radiative torques occur at the high end, we can account for these disruption effects separately. As the size distribution of the nanoparticles are poorly known, there is no strong conclusion whether this distribution should be a power-law or a log-normal. The power-law size distribution for nanoparticles was explored by Hensley & Draine (2017). In this work, we assume the size distribution of original nanoparticles to be a log-normal as other studieds (e.g., Draine & Lazarian 1998; Li & Draine 2001; Hoang et al. 2016):
| (23) |
with , the model parameters (see Tabel 1 in Li & Draine 2001), and constant determined by , and (fraction of total silicate () or carbon () abundance contained in grains, see Eq 51 in Hoang & Tram 2019). The effect of rotational disruption by mechanical torques is then to increase the lower cutoff of the log-normal size distribution from to (see Figure 5).
To model the effect of rotational disruption by RATs, we assume that both original large grains and nanoparticles produced by disruption follow a power-law distribution with slope :
| (24) |
where is a normalization constant determined by the dust-to-gas mass ratio () as:
| (25) |
with the upper constraint of grain size (Fig. 3), and the lower cutoff of grain sizes (Fig. 5). Since Equation 25 is invalid for , the alternative expression of the constant A at this singularity is
| (26) |
For example, using a typical value of , , , and m we estimate for carbonaceous grains (as known as the MRN distribution, Mathis et al. 1977). With these parameters, the contribution of the power-law distribution is negligible compared to the log-normal size distribution (see e.g., Draine & Lazarian 1998). In the presence of RATD, large grains are disrupted into smaller ones, so we can extend the power-law to . Hence, the size distribution (Eq. 24) is modified such that the slope becomes steeper, and the contribution of the power-law becomes more important. Therefore, the net size distribution of nanoparticles is given by
| (27) |
Since the slope is unknown, in the following, we will consider several values for . The dust-to-gas mass ratio is likely to vary in practice, e.g., for IRC +10216: Agúndez & Cernicharo (2006) adopted , while Cernicharo et al. (2015) used ; or for IK Tau: Decin et al. (2010) adopted , while Li et al. (2016) used .
5.2 Spinning dust emissivity
At any location in the CSE, the emissivity from a spinning nanoparticle of size is:
| (28) |
where is the power emitted by a rotating dipole moment at angular velocity given by the Larmor formula,
| (29) |
with the angle between spin vector ! and moment vector ¯. Assuming a uniform distribution of , then . The dipole moment for PAHs, and for nanosilicates, in which is the dipole per atom (Hoang et al., 2016). For PAHs, , while nanosilicates are expected to have a large dipole moment depending on selection of molecules (see Table 1 in Hoang et al. 2016). Therefore, we set as a free parameter when calculating spinning emission for nanosilicates grains. The grain angular velocity can be appropriately described by a Maxwellian distribution in high-density conditions where collisional excitations dominate rotation of nanoparticles:
| (30) |
5.3 Emission spectrum of spinning dust
Assuming CSEs are spherically symmetric (see Figure 1 in Sahai & Chronopoulos 2010), which is justified in the intermediate and outer region, i.e., (e.g., , Agúndez & Cernicharo 2006; Decin et al. 2010), the spectral flux density of spinning dust is:
| (32) |
where is the distance from the AGB star to the observer (see Table 1).
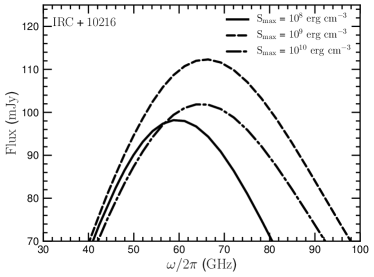
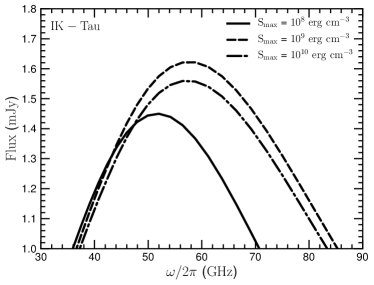
Figure 6 shows the emission spectrum of spinning PAHs in a C-rich star IRC +10216 (top panel) and nanosilicates in O-rich star IK Tau (bottom panel) for different values of material strengths. For strong grains (e.g., ) for which rotational disruption does not occur, the spinning dust emissivity is strong and can peak at high frequencies (see dashed lines). For weaker grains with rotational disruption, both the peak emissivity and peak frequency are reduced significantly because the smallest (and fastest-spinning) nanoparticles are destroyed into molecule clusters (see dashed-dotted and solid lines).
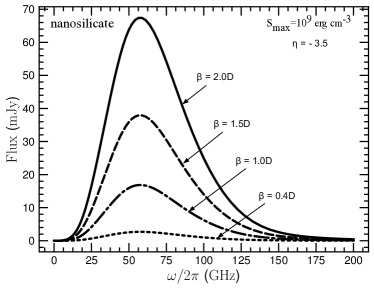
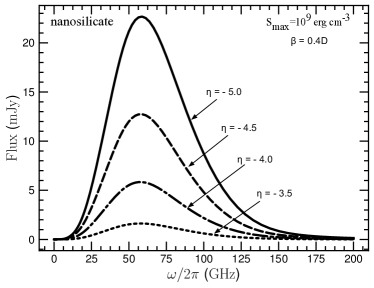
The spectrum of spinning dust emission depends on both the dipole moment and the size distribution. The top panel of Figure 7 shows the increase of the emission flux from spinning nanosilicate grains with increasing the dipole moment because the power emitted by a rotating dipole moment is proportional to . The peak frequency is insensitive to the value because in the dense envelopes, electric dipole damping is subdominant compared to gas damping.
The bottom panel of Figure 7 shows the dependence of spectrum on the slope of size-distribution, . One can see that the peak emission flux tends to increase with increasing the magnitude of slope, but the peak frequency does not change. Note that for the dust in the standard ISM, (Mathis et al. 1977). For circumstellar dust, Dominik et al. (1989) estimated this index to be . The steeper size distribution might be explained by the enhancement of small particles owing to the disruption of large grains due to RATD mechanism. Therefore the constant of the grain-size distribution increases for steeper slope (see Eq. 25) and results in an increment of flux.
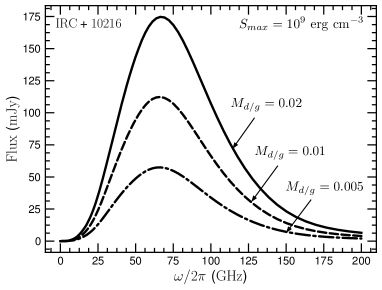
The dust-to-gas mass ratio () also affects on the spectrum of spinning dust emission. Figure 8 shows an example of the variation of spinning spectrum over some values of calculated in the IRC +10216. The higher value of the results the increment of the flux since the constant of the grain-size distribution is proportional to this quantity (see Eq. 25).
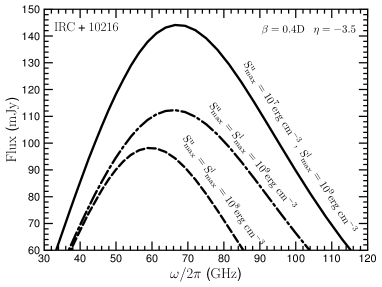
Above, we calculated the emission spectrum of spinning dust by using the same value of for both large grains and small grains. In reality, the structure of small grains, however, would be more compact and that should cause a higher value of than for the large ones. Figure 9 shows the effect of the size-dependent tensile strength on the emission spectrum of spinning grains, in which we assume for the upper constraint on grains sizes by RATD, and for the lower constraint on those by mechanical torques. In this case, the emission flux has higher amplitude (solid line) than the cases of constant . The underlying reason is owing to the enhancement of nanoparticles because weaker large grains (i.e., low value of ) are more easy to be disrupted by RATD. Moreover, comparing to the case of the same (dashed dotted line), one sees that the peak frequency does not change because the disruption effect of smallest nanoparticles by mechanical torques are the same in both cases. So, the peak frequency is much higher when comparing to the case of lower (dashed line) as shown in Figure 6.
.
.
6 Discussion
6.1 Rotational disruption of large grains into nanoparticles by radiative torques
We have studied the rotational disruption of large grains spun-up by radiative torques using the theory developed by Hoang et al. (2019). As shown in Figure 3, owing to their extremely fast rotation, large grains are being disrupted into smaller fragments, including nanoparticles, which places a constraint on the upper limit of the grain size distribution in CSEs around AGB stars. The efficiency of rotational disruption is different for different locations along the radial trajectory of stellar winds (see Sec. 3). In addition, weak grains (i.e., tensile strength ) are quite easily disrupted, while the disruption of stronger grains (i.e., tensile strength ) is less efficient.
6.2 Removal of nanoparticles due to rotational disruption by mechanical torques
Due to stochastic collisions with neutral and ionized gas, plasma drag, and infrared emission, nanoparticles tend to rotate thermally/subthermally ( Draine & Lazarian 1998; Hoang et al. 2010). Nevertheless, due to their small sizes (inertia moment), nanoparticles can rotate extremely fast, at rates more than (see Eq. 22). Subject to a supersonic gas flow induced by shocks (Hoang & Tram 2019; Tram & Hoang 2019) or radiation pressure as shown in this paper, nanoparticles can be spun-up to suprathermal rotation, resulting in the disruption of smallest nanoparticles into molecule clusters because the centrifugal stress exceeds the maximum tensile strength of nanoparticles. This mechanism places a contraint on the lower limit of the grain-size distribution. As shown in Figure 5, the disruption of nanoparticles is strongest near the central star and rapidly decreases outward. Moreover, nanoparticles of strong materials are hardly disrupted by mechanical torques in the AGB envelopes.
6.3 Can spinning dust explain excess microwave emission from AGB envelopes?
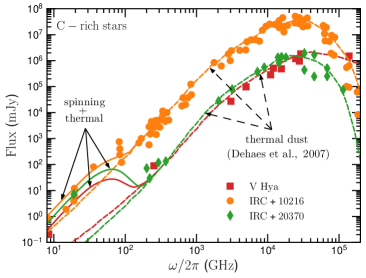
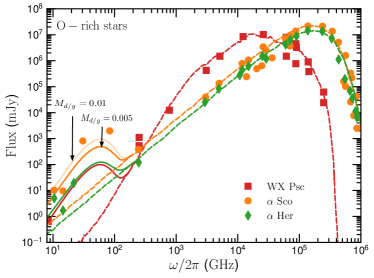
The early detection of cm-wave observations toward to the AGB stars, i.e., at 15 GHz (or 2 cm) and 20 GHz (or 1.5 cm) from IRC+10216 (Sahai et al. 1989), and at 8.4 GHz (or 3.57 cm) from 4 AGB stars over 21 samples (Knapp et al. 1995) cannot be explained by thermal dust emission. Recently, Dehaes et al. (2007) presented the SED observations from a large sample of O-rich and C-rich AGB stars envelopes and showed emission excess at cm wavelengths for many stars, including some post-AGB and supergiants with circumstellar shells. The authors divided them into two groups. Group I could be fitted successfully with thermal dust. Group II, on the other hand, is being fitted very well at optical and IR bands, but not being reproduced at cm-mm bands, including: IRC +10216, Her, IRC +20370, WX Psc, SCo, and V Hya (with central peak at GHz); and AFGL 1922, IRAS 15194-5115 (with central peak at GHz).
As shown in Section 5, the emission of spinning dust is strong and dominant over the thermal emission at the frequency GHz. It is worth to note that the global purpose of this work is to demonstrate the spinning dust is one possible explanation for the AME detections in AGB envelopes so that let us now use our model calculated for IRC +10216 and IK Tau to fit with the observational data of two C-rich and O-rich AGB stars, respectively. To fit the data, we vary three parameters , and while fixing other physical parameters until we obtain the best-fit models. In purpose of showing the whole SED, we combine with the best model of the thermal dust emission provided by Dehaes et al. (2007), which were modelled by DUSTY code (Ivezic et al. 1999) with . Figure 10 shows our best-fit models to observational data for three C-rich (upper panel) and three O-rich (lower panel) stars with given the corresponding set of dim parameters333The best fit parameters are reduced from the model of the spinning dust computed with the physical properties of IRC +10216 and IK Tau. Therefore, the exact parameters can be slightly different for other stars when we use their physical properties properly. in the caption. Apparently, thermal dust and spinning dust are able to reproduce the mm-cm emission for both C-rich star (top panel, Figure 10) and O-rich stars (bottom panel, Figure 10).
We note that some AGB stars such as AFGL 1922, IRAS 15194-5115 exhibit submm emission excess (i.e., at higher frequencies of GHz). Furthermore, Dehaes et al. (2007) also reported the variability at 1.2mm (250GHz) for WX Psc and 1.1mm ( 273GHz) for IRC +10216, and suggested that the variable molecular line emission might explain these large relative variations. However, such submm excess cannot be reproduced by our standard spinning dust model presented here because spinning dust is known to be efficient at microwave frequencies. Very recently, Hoang & Tram (2019) and Tram & Hoang (2019) show that spinning dust can be efficient at GHz in magnetized shocks where nanoparticles can be spun-up to suprathermal rotation by supersonic neutral drift, provided that nanoparticles are strong enough to withstand disruption by centrifugal force. Indeed, termination shocks (or reversed shocks) could occur in CSEs when the stellar wind interact with the surrounding ISM because the terminal velocity of the wind is supersonic (about ). Therefore, we propose that observing both the gas and the dust emission in the AGB envelopes should be crucial in order to have better interpretation to the observable submm emission excess because we could then have a better idea of where the termination shocks occur so that we could take the spinning dust emission from this shock into account.
It is worth to mention that Sahai et al. (2011) suggested that the submm emission excess by means of thermal emission from cold, very large grains (above 1 mm) in post AGB or pre-PN. However, how dust can grow to such big sizes in AGB envelopes is difficult to reconcile, because theoretical calculations show that dust released by AGB outflows is small grains (see, e.g., Jura 1994).
6.4 Implications for future observations
Observations would help to distinguish the carrier of AME by comparing C-rich vs. O-rich stars, because PAHs are formed in C-rich AGB stars while silicates are formed in O-rich stars. The interferometers like ALMA and the VLA are capable of mapping the gas distribution around AGB stars and polarization observations to constrain the dust grain properties in the shell (Khouri et al. 2018; Brunner et al. 2019). Such investigations are few in number, but they could help understand dust nucleation and growth in wind-driven AGB stars.
Figure 10 in this paper presents the spinning dust models fitted to available low-resolution radio observations of AGB stars. The low resolution, i.e., 1 data point (e.g., V Hya, WX Psc, IRC +20370) or few data points (e.g., a Her) makes the difficulty to distinguish whether the(se) excess point(s) resulted by the spinning dust or free-free or synchrotron or chromosphere emissions. High resolution dust continuum observations from ALMA in bands 3, 4, and 5 at 84, 125 and 163 GHz, respectively, can improve the constraints on fitted model parameter much better than done for available low-resolution observations, and the SED fitting can help resolve which mechanism (i.e., free-free, synchrotron, chromosphere, or spinning dust) is responsible for the AMEs in AGB envelopes. Additionally, carbon rich stars such as IRC +10216 can be observed for different transitions of CO molecules (e.g., Cernicharo et al. 2015). The observations covering the ring structure will map the CO gas emission and hence the CSE of the star. Simultaneously, dust continuum observations at comparable resolution will be useful to map the dust shell and hence spatially correlating it with the gas emissions. Multiband observations of AGB stars from VLA with frequencies from 1-40 GHz may help in understanding the dust distribution by investigating the fluxes obtained in these frequencies and fitting SEDs. VLA plays an important role in covering the regimes of frequencies less than 40 GHz (see Figure 10) at much higher resolution than that of available data in literature. Therefore, a combination of VLA and ALMA dust continuum observations in some of the bright AGB shells will help to pin down the dust characteristics using our dust models.
VLA and ALMA also provide unique opportunities to map high resolution dust continuum and line polarization. We can investigate whether wind-swept shell region of these ABG stars is polarized. The polarization measurements in the envelope of AGB stars will help in investigation the dust-grain properties such as size and alignment efficiency.
6.5 Toward constraining internal structure of dust grains with microwave emission
By modeling rotational disruption of grains and resulting microwave emission from spinning dust, we find that microwave emission has strong correlation with the tensile strength of grain materials. Both the peak flux and peak frequency tend to increase with increasing the tensile strength (see Figure 7). This can be a powerful constraint on the internal structure of newly formed dust grains in AGB envelopes, which is still a mystery in dust astrophysics. Recently, Hoang (2019) suggested that the upper cutoff of the grain size distribution in the ISM can be constrained by rotational disruption.
6.6 Model uncertainties
In this section, we would like to stress the uncertainties and the limitations of our model to the readers. First, we neglect the optical depth effect; thus we overestimate the radiation field strength in the envelope that would result in the RATD effect on constraining the upper cutoff of grain size (see Fig. 3) then change the grain size distribution (see Eq. 25). Second, we assume the dust temperature varies as in Habing & Olofsson (2003) (see Eq. 3) deriving from the radiative equilibrium, instead of solving the radiative transfer. This assumption is not correct for the nanoparticles responsible for spinning dust since they should be transiently heated, and their temperature should be higher. However, as spinning dust emission depends mostly on rotation rate, which is different from thermal dust emission, the effect of higher is to increase thermal fluctuations of the principal grain axis with its angular momentum. The thermal fluctuation is ineffective at the high value of dust temperature (Hoang et al. 2011). Third, we adopted the angular velocity follows the Maxwellian distribution to calculate the spinning dust emissivity as Draine & Lazarian (1998) for the sake of simplicity. For more general, Ali-Haïmoud et al. (2009) used the Fokker-Planck equation to derive this distribution, the predictions are not so much different from Draine & Lazarian (1998) nevertheless. Forth, as Draine & Lazarian (1998) and Ali-Haïmoud et al. (2009), our model disregarded the non-sphericity of grains and the anisotropy in the damping and excitation processes (i.e., ignore the magnetic field). Taking them into account, Hoang et al. (2010) indicates that the peak emissivity and the peak frequency of the spinning dust emission increase by a factor of few. Fifth, since we do not know exactly the value of in AGB envelopes, we fix the value of the as an arbitrary parameter in this work within a reference that Li & Draine (2001) indicated the upper limits for in diffuse ISM for amorphous ultra-small silicate grains is 30. Moreover, the effect of has shown in Figure 2 in Hoang et al. (2016), which cause only the variation of the emission flux. These uncertainties can modify the best-fit parameters in Figure 10, which urges the necessary to improve the model, and the specific model for each star is desired.
Despite of these uncertainties, we believe that our model still shows the principle characteristics of spinning dust, and that the spinning dust can be a good mechanism to explain the AME emissions in AGB envelopes.
7 Summary
We have studied rotational disruption of dust grains by radiative and mechanical torques in the AGB envelopes, performed detailed modeling of microwave emission from rapidly spinning nanoparticles, and applied the models to explain the observed excess microwave emission. The principal results are summarized as follows:
-
1
We model the rotational disruption of large grains by centrifugal stress induced by radiative torques from central star. We find that large grains (e.g., ) made of weak materials (tensile strength can be disrupted into nanoparticles within a radius of from the star.
-
2
We also study the disruption of nanoparticles by centrifugal stress due to stochastic collisions of grains with supersonic gas flow driven by radiation pressure and find that smallest nanoparticles of weak materials located close to the star can be destroyed.
-
3
We model microwave emission from spinning PAHs and silicate nanoparticles in C-rich and O-rich envelopes. We find that due to the radial dependence of the gas temperature, the spinning dust emits over a wide range of microwave frequencies.
-
4
We found that microwave emission from either spinning PAHs or spinning nanosilicates can dominate over thermal dust at frequencies GHz in the AGB envelopes.
-
5
By fitting the spinning dust to observed data from mm-cm wavelengths, we find that AME observed in AGB envelopes can be successfully reproduced by microwave emission from carbonaceous or silicate nanoparticles.
-
6
Thanks to the correlation of spinning dust flux with the grain tensile strength, we suggest that internal structure of newly formed dust in AGB envelopes can be probe with microwave emission observations.
References
- Agúndez & Cernicharo (2006) Agúndez, M., & Cernicharo, J. 2006, ApJ, 650, 374
- Akimkin et al. (2013) Akimkin, V., Zhukovska, S., Wiebe, D., et al. 2013, ApJ, 766, 8
- Ali-Haïmoud et al. (2009) Ali-Haïmoud, Y., Hirata, C. M., & Dickinson, C. 2009, MNRAS, 395, 1055
- Allamandola et al. (1985) Allamandola, L. J., Tielens, A. G. G. M., & Barker, J. R. 1985, ApJ, 290, L25
- Brunner et al. (2019) Brunner, M., Mecina, M., Maercker, M., et al. 2019, A&A, 621, A50
- Burke & Silk (1974) Burke, J. R., & Silk, J. 1974, ApJ, 190, 1
- Castellanos et al. (2011) Castellanos, P., Casassus, S., Dickinson, C., et al. 2011, MNRAS, 411, 1137
- Cernicharo et al. (2000) Cernicharo, J., Guélin, M., & Kahane, C. 2000, A&AS, 142, 181
- Cernicharo et al. (2015) Cernicharo, J., Marcelino, N., Agúndez, M., & Guélin, M. 2015, A&A, 575, A91
- Cherchneff (2011) Cherchneff, I. 2011, EAS Publications Series, 46, 177
- Cox et al. (2012) Cox, N. L. J., Kerschbaum, F., van Marle, A.-J., et al. 2012, A&A, 537, A35
- Crosas & Menten (1997) Crosas, M., & Menten, K. M. 1997, ApJ, 483, 913
- De Beck et al. (2010) De Beck, E., Decin, L., de Koter, A., et al. 2010, A&A, 523, A18
- Decin et al. (2010) Decin, L., De Beck, E., Brünken, S., et al. 2010, A&A, 516, A69
- Dehaes et al. (2007) Dehaes, S., Groenewegen, M. A. T., Decin, L., et al. 2007, Monthly Notices of the Royal Astronomical Society, 377, 931
- Dominik et al. (1989) Dominik, C., Gail, H. P., & Sedlmayr, E. 1989, A&A, 223, 227
- Draine & Salpeter (1979) Draine, B. T., & Salpeter, E. E. 1979, ApJ, 231, 77
- Draine & Weingartner (1996) Draine, B. T., & Weingartner, J. C. 1996, ApJ, 470, 551
- Draine & Lazarian (1998) Draine, B. T., & Lazarian, A. 1998, ApJ, 508, 157
- Draine & Li (2007) Draine, B. T., & Li, A. 2007, ApJ, 657, 810
- Fleming & Stone (2003) Fleming, T., & Stone, J. M. 2003, ApJ, 585, 908
- Gilman (1972) Gilman, R. C. 1972, ApJ, 178, 423
- Glassgold & Huggins (1983) Glassgold, A. E., & Huggins, P. J. 1983, MNRAS, 203, 517
- Guhathakurta & Draine (1989) Guhathakurta, P., & Draine, B. T. 1989, ApJ, 345, 230
- Habing & Olofsson (2003) Habing, H. J, & Olofsson, H., Asymptotic giant branch stars (New York, Berlin: Springer)
- Hensley & Draine (2017) Hensley, B. S., & Draine, B. T. 2017, ApJ, 836, 179
- Herranen et al. (2019) Herranen, J., Lazarian, A., & Hoang, T. 2019, ApJ, 878, 96
- Hoang & Lazarian (2008) Hoang, T., & Lazarian, A. 2008, MNRAS, 388, 117
- Hoang et al. (2010) Hoang, T., Draine, B. T., & Lazarian, A. 2010, ApJ, 715, 1462
- Hoang et al. (2011) Hoang, T., Lazarian, A., & Draine, B. T. 2011, ApJ, 741, 87
- Hoang, & Lazarian (2016) Hoang, T., & Lazarian, A. 2016, ApJ, 821, 91
- Hoang et al. (2016) Hoang, T., Vinh, N. A., & Quynh Lan, N. 2016, ApJ, 824, 18
- Hoang (2017) Hoang, T. 2017, ApJ, 847, 77
- Hoang et al. (2019) Hoang, T., Tram, L. N., Lee, H., et al. 2019, Nature Astronomy, 3, 766
- Hoang & Tram (2019) Hoang, T., & Tram, L. N. 2019, ApJ, 877, 36
- Hoang (2019) Hoang, T. 2019, ApJ, 876, 13
- Hoefner & Dorfi (1997) Hoefner, S., & Dorfi, E. A. 1997, A&A, 319, 648
- Ivezic et al. (1999) Ivezic, Z., Nenkova, M., & Elitzur, M. 1999, ascl:9911.001
- Jaeger et al. (1998) Jaeger, C., Molster, F. J., Dorschner, J., et al. 1998, A&A, 339, 904
- Jones & Spitzer (1967) Jones, R. V., & Spitzer, Lyman, J. 1967, ApJ, 147, 943
- Jura (1994) Jura, M. 1994, ApJ, 434, 713
- Justtanont et al. (2012) Justtanont, K., Khouri, T., Maercker, M., et al. 2012, A&A, 537, A144
- Khouri et al. (2018) Khouri, T., Vlemmings, W. H. T., Olofsson, H., et al. 2018, A&A, 620, A75
- Knapp et al. (1995) Knapp, G. R., Bowers, P. F., Young, K., & Phillips, T. G. 1995, Astrophysical Journal v.455, 455, 293
- Knapp et al. (1998) Knapp, G. R., Young, K., Lee, E., & Jorissen, A. 1998, ApJS, 117, 209
- Krueger et al. (1994) Krueger, D., Gauger, A., & Sedlmayr, E. 1994, A&A, 290, 573
- Kwan & Linke (1982) Kwan, J., & Linke, R. A. 1982, ApJ, 254, 587
- Kwok (2004) Kwok, S. 2004, Nature, 430, 985
- Lamers & Cassinelli (1999) Lamers, H. J. G. L. M., & Cassinelli, J. P. 1999, Introduction to Stellar Winds
- Lazarian & Hoang (2007) Lazarian, A., & Hoang, T. 2007, MNRAS, 378, 910
- Leger & Puget (1984) Leger, A., & Puget, J.-L. 1984, A&A, 137, L5
- Li & Draine (2001) Li, A., & Draine, B. T. 2001, ApJ, 550, L213
- Li et al. (2016) Li, X., Millar, T. J., Heays, A. N., et al. 2016, A&A, 588, A4
- Maercker et al. (2016) Maercker, M., Danilovich, T., Olofsson, H., et al. 2016, A&A, 591, A44
- Mamon et al. (1988) Mamon, G. A., Glassgold, A. E., & Huggins, P. J. 1988, ApJ, 328, 797
- Mathis et al. (1977) Mathis, J. S., Rumpl, W., & Nordsieck, K. H. 1977, ApJ, 217, 425
- Mathis et al. (1983) Mathis, J. S., Mezger, P. G., & Panagia, N. 1983, A&A, 500, 259
- Mathis & Whiffen (1989) Mathis, J. S., & Whiffen, G. 1989, ApJ, 341, 808
- Matthews et al. (2015) Matthews, L. D., Gérard, E., & Le Bertre, T. 2015, MNRAS, 449, 220
- Menten et al. (2006) Menten, K. M., Reid, M. J., Krügel, E., Claussen, M. J., & Sahai, R. 2006, Astronomy and Astrophysics, 453, 301
- Menten et al. (2012) Menten, K. M., Reid, M. J., Kamiński, T., & Claussen, M. J. 2012, A&A, 543, A73
- Millar et al. (2000) Millar, T. J., Herbst, E., & Bettens, R. P. A. 2000, MNRAS, 316, 195
- Olofsson et al. (2010) Olofsson, H., Maercker, M., Eriksson, K., Gustafsson, B., & Schöier, F. 2010, A&A, 515, A27
- Ramstedt et al. (2011) Ramstedt, S., Maercker, M., Olofsson, G., Olofsson, H., & Schöier, F. L. 2011, A&A, 531, A148
- Roberge et al. (1995) Roberge, W. G., Hanany, S., & Messinger, D. W. 1995, ApJ, 453, 238
- Sahai et al. (1989) Sahai, R., Claussen, M. J., & Masson, C. R. 1989, Astronomy and Astrophysics (ISSN 0004-6361), 220, 92
- Sahai & Chronopoulos (2010) Sahai, R., & Chronopoulos, C. K. 2010, ApJ, 711, L53
- Sahai et al. (2011) Sahai, R., Claussen, M. J., Schnee, S., Morris, M. R., & Sánchez Contreras, C. 2011, The Astrophysical Journal
- Smith et al. (2007) Smith, J.-D. T., Draine, B. T., Dale, D. A., & et al. 2007, ApJ, 656, 770
- Tenenbaum et al. (2010) Tenenbaum, E. D., Dodd, J. L., Milam, S. N., Woolf, N. J., & Ziurys, L. M. 2010, ApJL, 720, L102
- Tielens (1983) Tielens, A. G. G. M. 1983, ApJ, 271, 702
- Tielens (2008) Tielens, A. G. G. M. 2008, ARA& A, 46, 289
- Tram et al. (2018) Tram, L. N., Lesaffre, P., Cabrit, S., & Nhung, P. T. 2018, arXiv e-prints, arXiv:1808.01439
- Tram & Hoang (2019) Tram, L. N., & Hoang, T. 2019, ApJ, 886, 44
- Willson (2000) Willson, L. A. 2000, in Unsolved Problems in Stellar Evolution, ed. M. Livio, Vol. 12, 227
- Winters et al. (1994) Winters, J. M., Dominik, C., & Sedlmayr, E. 1994, A&A, 288, 255