Five Gas-rich Ultra-faint Dwarf Galaxy Candidates Discovered in WIYN Imaging of ALFALFA Sources
Abstract
We present results from the analysis of WIYN pODI imaging of 23 ultra-compact high-velocity clouds (UCHVCs), which were identified in the ALFALFA Hi survey as possible dwarf galaxies in or near the Local Group. To search for a resolved stellar population associated with the Hi gas in these objects, we carried out a series of steps designed to identify stellar overdensities in our optical images. We identify five objects that are likely stellar counterparts to the UCHVCs, at distances of 350 kpc to 1.6 Mpc. Two of the counterparts were already described in Janesh et al. (2015) and Janesh et al. (2017); the estimated distance and detection significance for one of them changed in the final analysis of the full pODI data set. At their estimated distances, the detected objects have Hi masses from , from , and stellar masses from . None of the objects shows evidence of a young stellar population. Their properties would make the UCHVCs some of the most extreme objects in and around the Local Group, comparable to ultra faint dwarf galaxies in their stellar populations, but with significant gas content. Such objects probe the extreme end of the galaxy mass function, and provide a testbed for theories regarding the baryonic feedback processes that impact star formation and galaxy evolution in this low-mass regime.
1 Introduction
We have undertaken a campaign to obtain deep, wide-field optical imaging of specific sources detected by the ALFALFA blind neutral hydrogen survey (Giovanelli et al., 2005; Haynes et al., 2011) that are called Ultra-Compact High-Velocity Clouds, or UCHVCs (Giovanelli et al., 2010; Adams et al., 2013). These objects have kinematic properties that make them likely to be located in and around the Local Group, but searches of objects in existing optical surveys or catalogs – in particular, the Sloan Digital Sky Survey (SDSS; Eisenstein et al., 2011), Digitized Sky Survey (DSS), or the NASA Extragalactic Database (NED) – reveal no clear optical counterpart. When placed at a fiducial distance of 1 Mpc, UCHVCs have neutral hydrogen properties that are similar to those of gas-rich faint dwarf galaxies like Leo T (Irwin et al., 2007; Ryan-Weber et al., 2008); specifically, their Hi masses are in the range, their dynamical masses are , and their Hi diameters are 23 kpc (Adams et al., 2013). One possibility, explored by Giovanelli et al. (2010) in the paper that first identified UCHVCs as a category of objects, is that the UCHVCs represent a population of so-called “minihalos”. These are low-mass ( ) dark matter halos that surround detectable baryonic material – in this case, of neutral gas and perhaps stars as well.
Of the 30,000 sources detected and cataloged by the ALFALFA survey (Giovanelli et al., 2005; Haynes et al., 2011), 100 have been identified as UCHVCs to date. We have been observing a subsample of the UCHVCs with the WIYN 3.5-m telescope111The WIYN Observatory is a joint facility of the University of Wisconsin– Madison, Indiana University, the University of Missouri, and the National Optical Astronomy Observatory. in order to search for detectable stellar populations and investigate the exact nature of these objects. Our subsample consists of the 56 UCHVCs we deem most likely to host a detectable stellar population (see Section 2 for a discussion of the selection criteria and the detailed properties of these objects). Identifying a stellar component associated with a given UCHVC in our WIYN imaging allows us to determine a distance to the object, which in turn yields crucial information about the properties (e.g., masses, luminosities) and evolutionary status of these nearby galaxy candidates.
The first UCHVC we imaged with WIYN led to the discovery of Leo P, a low-mass, extremely metal-poor dwarf galaxy located at a distance of 1.620.15 Mpc (Giovanelli et al., 2013; Rhode et al., 2013; Skillman et al., 2013; Bernstein-Cooper et al., 2014; McQuinn et al., 2015). Finding other such objects is important for a number of reasons. Identifying and studying nearby gas-rich galaxies allows us to investigate the baryonic feedback processes that govern star formation and galaxy evolution in galaxies at the extreme end of the mass function, and it provides important observational data to compare to galaxy formation model predictions (e.g., Revaz & Jablonka, 2018; Benítez-Llambay et al., 2017; Vandenbroucke et al., 2016; Verbeke et al., 2015). It also enables us to find some of the lowest-metallicity galaxies in the Universe (e.g., Skillman et al., 2013) and to fill in the low-mass end of the Baryonic Tully-Fisher Relation (BTFR; McGaugh, 2012).
This paper is the latest installment in a series of papers presenting the methods and results of our systematic campaign to obtain WIYN imaging of ALFALFA UCHVCs with a wide-field camera first installed at WIYN in 2012 (after the discovery of Leo P). In the first paper, Janesh et al. (2015, hereafter J15), we detailed the observational strategy and the procedures we use to search for and characterize the stellar populations associated with the UCHVC targets. That paper also presented a tentative (92% significance) detection of a stellar population belonging to the UCHVC AGC 198606. We referred to this object as “Friend of Leo T” because of its proximity in position and radial velocity to the dwarf galaxy Leo T (Irwin et al., 2007). The stellar counterpart we identified for AGC 198606 had a distance of 380 kpc, a magnitude of , and a large Hi-to-stellar mass ratio (between 42 and 110; J15, ). The second paper in the series, Janesh et al. (2017, hereafter J17), described the detection of a stellar population associated with the UCHVC AGC 249525 at a higher significance than that of AGC 198606. The stellar counterpart in this case had an estimated magnitude between and and was more distant, at Mpc away. Its Hi-to-stellar mass ratio was also large, but with a wide possible range (between 9 and 144, depending on how the optical magnitude was estimated). Though this object has no clearly associated neighbors, the most likely neighbor is the faint irregular galaxy UGC 9128, which has a distance of 2.3 Mpc (Tully et al., 2013) and is 10 degrees away in sky position.
Searches by other groups for stellar counterparts to the ALFALFA UCHVCs have yielded varying results. The SECCO survey (Bellazzini et al., 2015) observed 25 UCHVCs with the Large Binocular Telescope, detecting a distant ( Mpc) counterpart to AGC 226067 that they dubbed SECCO 1, as well as a marginal stellar overdensity associated with AGC 249283. In Adams et al. (2015), our group presented results from Hi synthesis observations and WIYN pODI imaging of AGC 226067 and argued that it is associated with the Virgo Cluster rather than being a local object. Beccari et al. (2017) used integral field spectroscopy of several Hii regions in SECCO 1; they reiterate that the object indeed likely resides in the Virgo Cluster, and find that it has a much higher metallicity (a mean abundance 12 + log(O/H)) than expected for a dwarf galaxy with a very low mass.
Using publicly available archival imaging, Sand et al. (2015) searched for counterparts to objects from both ALFALFA and the GALFA-HI survey (Peek et al., 2011). Sand et al. (2015) confirmed the counterpart to AGC 226067 discovered by the SECCO survey, and in a subsequent paper (Sand et al., 2017) confirmed a distance of 17 Mpc and a relatively high metallicity ([Fe/H] -0.3) based on HST imaging of this object. Both Beccari et al. (2017) and Sand et al. (2017) conclude that AGC 226067 is a pre-enriched remnant gas cloud that was likely stripped from a more massive Virgo Cluster galaxy. In their search of archival data, Sand et al. (2015) also identified distant (at least 3 Mpc away) counterparts to four HI-detected objects from the GALFA-HI survey, including two previously identified dwarf galaxies, Pisces A and Pisces B (Tollerud et al., 2015). HST imaging of the latter two objects yields a tip of the Red Giant Branch (TRGB) distance of 5.6 and 8.9 Mpc, respectively (Tollerud et al., 2016). The overall result from these other studies is that most of the objects being targeted still have no identified stellar counterpart, and the objects that do have counterparts, while intriguing objects in their own right, are located well outside the Local Group.
In the current paper, we present the entire set of results for the sample of UCHVCs we have imaged with the pODI camera on the WIYN 3.5-m telescope. The pODI camera was mounted on WIYN from 2012 to 2015 and provided a field of view. We observed 23 of the UCHVCs with pODI and now have completed the analysis of the entire pODI data set, finding a total of five dwarf galaxy candidates that we judge to be significant detections and four more candidates that we classify as marginal detections.
Note that as part of this process, we re-analyzed the data for AGC 198606. In the final analysis AGC 198606 is still classified as a significant detection, although the properties and location of the detection in the AGC 198606 field have changed.
The remaining objects in our sample of 56 high-priority UCHVCs are being imaged with the ODI camera, which was installed at WIYN in 2015 and provides a contiguous field-of-view. The analysis of the ODI data is ongoing and the results will be presented in a subsequent paper.
The paper is organized as follows: in Section 2, we describe the selection criteria and the properties of the sample of ALFALFA UCHVCs we chose for optical follow-up. Section 3 contains descriptions of our observations and a summary of our data reduction and analysis procedures. We present our results in Section 4 and discuss their implications in Section 5.
2 The Sample of UCHVCs Observed with WIYN pODI
We assembled a sample of UCHVCs for optical follow-up from the catalogs presented in Adams et al. (2013) and Adams et al. (2016). The primary criteria that define whether a source identified in the ALFALFA survey is a UCHVC are given in Adams et al. (2013); they are:
-
1.
Hi major axis 30′, corresponding to a 2 kpc diameter at 250 kpc, 9 kpc at 1 Mpc, and 22 kpc at 2.5 Mpc. The Hi major and minor axes and are determined by fitting an ellipse to the Hi flux distribution at the level enclosing half of the total flux density (see Adams et al., 2013).
-
2.
ALFALFA signal-to-noise ratio 8, to ensure that the Hi signal is a robust detection.
-
3.
No more than three neighboring Hi structures within 3° on the sky or 15 km s-1 in velocity. A “most isolated” subsample is also defined, including sources with no more than four neighbors within 10°. UCHVCs must also have no less than 15° separation from previously known HVC complexes.
-
4.
Heliocentric radial velocity km s-1 to select objects within the Local Volume.
-
5.
Velocity with respect to the Local Standard of Rest, km s-1 to prevent confusion with Galactic high velocity clouds. Since some similar objects to UCHVCs (e.g., the gas-rich dwarf galaxy Leo T) have km s-1, this criterion is relaxed only if all of the other criteria are met, in order to ensure that we do not miss any legitimate dwarf galaxy candidates.
-
6.
Critically, no clear optical counterparts in SDSS or DSS.
These criteria are intended to select the best possible candidates matching the minihalo hypothesis (Giovanelli et al., 2010). There are 100 objects that meet these criteria, including the sources with the relaxed velocity criterion (#5 in the above list) and Leo P (Giovanelli et al., 2013). We had access to all of the low-velocity cubes from the ALFALFA survey (as described in Haynes et al., 2018), and therefore this list of 100 UCHVCs is unlikely to get larger, unless further investigation leads us to relax or otherwise alter the selection criteria.
In Figure 1, we show the full UCHVC sample, illustrated by each object’s properties derived from the ALFALFA observations. On the vertical axis, we plot the integrated Hi line flux density in Jy km s-1 , and on the horizontal axis we plot the logarithm of the mean column density, log , in atoms cm-2. As an alternate vertical axis we plot the logarithm of the Hi mass in solar masses, log , at a fiducial distance of 1 Mpc. The size of the points is proportional to , the average angular diameter, and UCHVCs belonging to the most isolated subsample are indicated with a square outline. The Hi masses and mean column densities are derived from the equations given in Adams et al. (2013):
| (1) |
| (2) |
where is the measured or assumed distance to the UCHVC.
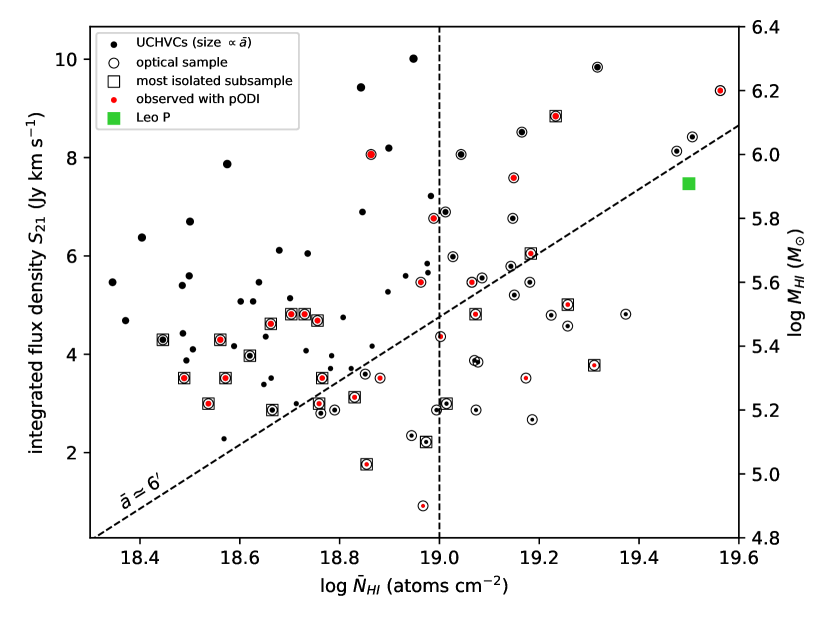
From the full UCHVC sample shown in Figure 1, we selected a subsample of objects to prioritize for deep optical follow-up observations, assuming that the most compact, most isolated, and highest column density objects are more likely to have a stellar counterpart. The objects in this subsample match at least one of the following criteria:
-
1.
Mean Hi column density
-
2.
Mean angular diameter of the half-flux ellipse () ′
-
3.
Object is in the “most isolated” subsample, regardless of its other properties
These criteria are indicated with the vertical and diagonal dashed lines in Figure 1. Added to this list were three UCHVCs that do not otherwise meet the criteria above. These three UCHVCs were selected from a master list of ALFALFA UCHVCs provided by members of our collaboration early in the project. They had already been observed with pODI before we defined the specific criteria used to select the highest-priority subsample. All together, the optical follow-up sample contains 59 UCHVC targets, indicated in Figure 1 with a circle outline. The 23 UCHVCs presented in this work are listed in Table 1. Along with primary and secondary object names, we list the main ALFALFA-derived properties of the UCHVCs: the recessional velocity , the Hi line full-width at half-maximum (FWHM) , the mean column density , the mean angular diameter , the Hi mass at an assumed distance of 1 Mpc, and finally the date the object was observed with pODI. These objects are also marked in red in Figure 1; we note that they approximately span the range of the derived properties of the full UCHVC sample.
| Name | R.A. | Dec. | log | log aaThe Hi mass at an assumed distance of 1 Mpc | Date | ||||
|---|---|---|---|---|---|---|---|---|---|
| [Jy km s] | [km s] | [km s] | [′] | [atoms cm] | [M☉] | Observed | |||
| AGC174540 | 07h45m59.9s | +14d58m37s | 2.08 ±0.21 | 162 | 23 | 7.75 | 19.2 | 5.7 | 2013 Mar |
| AGC198511 | 09h30m13.2s | +24d12m17s | 0.74 ±0.07 | 152 | 15 | 6.93 | 18.8 | 5.2 | 2013 Mar |
| AGC198606 | 09h30m05.5s | +16d39m03s | 6.73 ±0.67 | 53 | 21 | 9.00 | 19.6 | 6.2 | 2013 Mar |
| AGC198831 | 09h59m11.8s | +18d55m35s | 4.24 ±0.42 | 84 | 22 | 16.00 | 18.9 | 6.0 | 2014 Mar |
| AGC208747 | 10h37m06.6s | +20d30m58s | 2.68 ±0.27 | 98 | 23 | 11.00 | 19.0 | 5.8 | 2013 Mar |
| AGC208753 | 10h49m32.4s | +23d56m38s | 4.24 ±0.42 | 65 | 23 | 13.00 | 19.0 | 6.0 | 2014 Apr |
| AGC215417 | 11h40m08.1s | +15d06m44s | 0.70 ±0.07 | 216 | 17 | 9.49 | 18.5 | 5.2 | 2013 Mar |
| AGC219656 | 11h51m24.3s | +20d32m20s | 0.85 ±0.08 | 192 | 21 | 8.00 | 18.8 | 5.3 | 2013 Mar |
| AGC226067 | 12h21m54.7s | +13d28m10s | 0.93 ±0.09 | -128 | 54 | 4.47 | 19.3 | 5.3 | 2013 Mar |
| AGC227987 | 12h45m29.8s | +05d20m23s | 5.60 ±0.56 | 265 | 26 | 12.00 | 19.2 | 6.1 | 2014 Mar |
| AGC229326 | 12h27m34.7s | +17d38m23s | 0.85 ±0.08 | 242 | 23 | 8.00 | 18.8 | 5.3 | 2013 Apr |
| AGC238626 | 13h03m51.1s | +12d12m23s | 0.34 ±0.03 | 211 | 36 | 4.00 | 19.0 | 4.9 | 2013 Mar |
| AGC238713 | 13h30m43.8s | +04d13m38s | 1.25 ±0.13 | 308 | 26 | 10.95 | 18.7 | 5.5 | 2013 Mar |
| AGC249000 | 14h07m21.7s | +15d45m26s | 1.69 ±0.17 | 66 | 31 | 9.00 | 19.0 | 5.6 | 2014 Apr |
| AGC249282 | 14h23m21.2s | +04d34m37s | 1.44 ±0.14 | 203 | 40 | 5.92 | 19.3 | 5.5 | 2013 Mar |
| AGC249320 | 14h06m00.0s | +06d07m36s | 0.85 ±0.08 | 59 | 24 | 5.00 | 19.2 | 5.3 | 2014 Mar |
| AGC249323 | 14h19m48.6s | +07d11m15s | 1.34 ±0.13 | 246 | 20 | 10.82 | 18.7 | 5.5 | 2013 Apr |
| AGC249525 | 14h17m50.1s | +17d32m52s | 6.73 ±0.67 | 48 | 24 | 9.00 | 19.6 | 6.2 | 2013 Apr |
| AGC258237 | 15h07m23.0s | +11d32m56s | 1.34 ±0.13 | 155 | 23 | 7.07 | 19.1 | 5.5 | 2013 Mar/Apr |
| AGC258242 | 15h10m00.6s | +11d11m27s | 0.70 ±0.07 | 207 | 21 | 7.35 | 18.8 | 5.2 | 2013 Mar |
| AGC258459 | 15h04m41.3s | +06d12m59s | 1.34 ±0.13 | 149 | 24 | 10.49 | 18.7 | 5.5 | 2014 Mar |
| AGC268069 | 16h05m32.6s | +14d59m20s | 1.14 ±0.11 | 132 | 29 | 7.07 | 19.0 | 5.4 | 2013 Mar/Apr |
| AGC268074 | 16h24m43.4s | +12d44m12s | 1.28 ±0.13 | 107 | 23 | 9.95 | 18.8 | 5.5 | 2014 Apr |
3 Observations, Data Reduction, & Analysis
Using WIYN and pODI, we observed the targets listed in Table 1 between 2013 March and 2014 October, with the bulk of the observations being completed in 2013 March-April. The pODI instrument consisted of nine orthogonal transfer arrays (OTAs) in a configuration that were used for observing targets, and four additional OTAs at larger distances from the field center used for guiding. The central array of OTAs imaged a area on the sky with a pixel scale of 0.11″ per pixel. For each target we obtained nine 300s exposures in each of two filters, SDSS and . The exposures were sequenced in a dither pattern intended to provide uniform coverage across the small gaps between the individual CCD detectors and the larger gaps between the OTAs.
A detailed discussion of the data reduction and analysis methods used for this project is presented in J15, but is summarized here for clarity. The raw images are processed using the QuickReduce pipeline (Kotulla, 2014) to remove the instrumental signature, including corrections for bias, flat-fielding, dark current, persistency, fringing in the images, and the WIYN pupil ghost. To create a final combined image, the QuickReduce-processed images are illumination-corrected (see Janowiecki et al., 2015), reprojected to a common pixel scale, scaled to a common flux level, and stacked. The combined images are then aligned and trimmed to a common size of 11,000 pixels by 11,000 pixels () to remove the high-noise regions on the edges of the dither pattern.
For each pair of and images, we then construct a stellar catalog. First, sources in each image are detected using daofind in IRAF222IRAF is distributed by the National Optical Astronomy Observatory, which is operated by the Association of Universities for Research in Astronomy (AURA) under a cooperative agreement with the National Science Foundation., with a threshold level typically 3.5 times the standard deviation of the background counts in each image. Then sources are matched in the two filters to eliminate spurious detections.
We eliminate extended sources by first measuring the instrumental magnitude within an aperture with radius equal to the average FWHM PSF of the image and another aperture set to twice that value. For unresolved sources of a given instrumental magnitude, the difference between the measured magnitude within these two apertures () will be approximately constant. We compute these values for each set of images, then in a series of instrumental magnitude bins, select only the sources within three standard deviations of the relevant value. The extended source cut described here differs from that described in J15, and allows us to apply a consistent and predictable correction using the statistical method rather than a by-eye selection of point sources. By using the characteristics of known bright point sources, we can more easily reject extended sources at fainter magnitudes. The data presented in J15 have been reanalyzed in this work for consistency with the rest of the optical follow-up sample.
We carry out photometry of all the remaining point sources with a small aperture, apply an aperture correction, and calculate calibrated and magnitudes by determining calibration coefficients (zero points and color terms) based on SDSS stars in each image and applying them to the instrumental magnitudes we measure. Finally, we apply a Galactic extinction correction to the final photometry of the stellar sources. The Galactic extinction correction is calculated by applying the Schlafly & Finkbeiner (2011) coefficients to the Schlegel et al. (1998) values for the center of the field since the UCHVCs are at high Galactic latitudes and exhibit small variations in reddening across the field.
We also perform a series of artificial star experiments – adding artificial point sources with a range of magnitudes to each image and then executing the same detection and photometry steps – in order to quantify the detection completeness as a function of magnitude for the final stacked and images of each object. The detection completeness is indicated in each of the color-magnitude diagrams (CMDs) shown in the figures in Section 4, as described in the captions.
With a catalog of stellar sources in the field in hand, we then search for a resolved stellar counterpart using a CMD filter, following a similar strategy to that of Walsh et al. (2009). The CMD filter is constructed using isochrones from Girardi et al. (2004), selected to represent old (8-14 Gyr), metal-poor () populations. Stars are selected by the CMD filter in color-magnitude space at a range of distance moduli, then their positions are spatially binned into a two-dimensional (2D) histogram with 8″ 8″ bins. The 2D histogram grid is then smoothed using a Gaussian kernel with a 2′ – 3′ FWHM, approximately the range of expected angular sizes for dwarf galaxies over the range of distance moduli. The 2D histogram is then normalized so that the final values in the grid are expressed in standard deviations from the mean; we use this information to identify stellar overdensities.
We quantify the significance, , of the overdensities we find by performing a Monte-Carlo style test, generating 25,000 random, uniformly spatially distributed sets of points, with the number of points set equal to the number of stars that are selected by the CMD filter. Applying the same smoothing and normalization technique to the random datasets allows us to construct a probability distribution of their “most significant” overdensities, to which we can compare the overdensities selected in the real data. We express in terms of the cumulative distribution function – e.g., a of 90% means that 90% of the “most significant” overdensities in the random datasets are as many or fewer standard deviations from the mean than the overdensity from the real data. Overdensities with a high significance () are unlikely to be due to random superpositions of stars and are instead likely to be true collections of stars that are physically associated. We also find both the minimum and maximum distance that an overdensity with is detected at the same sky position. We then assume the distance error to be the greater of the differences between the distance of the highest significance overdensity and the minimum and maximum distances.
To classify the overdensities, we consider other information in addition to their significance. The position of the overdensity relative to the Hi detection is of particular interest. We compute an angular distance from the center of the overdensity to the ALFALFA Hi centroid, , as a first-order indicator of the coincidence, and also visually inspect the position relative to the ALFALFA Hi column density contours, and when available, contours from higher-resolution Hi synthesis imaging (e.g., the Hi synthesis observations of a subset of UCHVCs from the Westerbork Synthesis Radio Telescope presented in Adams et al., 2016). It is reasonable to expect that the detected stellar overdensities that are spatially coincident with the Hi gas distribution are more likely to be stellar populations genuinely associated with the UCHVCs. We also consider the proximity of the overdensities and UCHVCs to nearby galaxies and galaxy groups with available literature values for recessional velocity and distance. Detecting a stellar population at a distance similar to a nearby galaxy or group that has a recessional velocity similar to the UCHVC is another indicator that the stellar population is a dwarf galaxy actually associated with that group or galaxy.
The robustness of a detection is also a factor in its classification. We consider four individual overdensities when determining whether a detection is robust: the highest significance overdensity with a smoothing cell size of 2′, the highest significance overdensity with a smoothing cell size of 3′, and the highest significance close overdensity () at 2′ and 3′ smoothing cell sizes. We select the highest significance overdensity of these as the primary detection, then use the remaining three as supporting detections. To be a robust overdensity, the primary and at least two of the supporting detections must be located at the same spatial position or within fewer than five bins (40″) in the smoothed 2D histogram, have individual significances greater than 90%, and be located within the set of overdensities used to determine the distance error for the primary detection. Detections that are more than 8′ from the Hi centroid are considered non-robust.
When we do detect an overdensity that we think is a stellar population genuinely associated with a UCHVC, we then estimate the optical and Hi properties of the UCHVC based on the distance at which the overdensity was detected. The gas properties – Hi mass, dynamical mass, and physical size – are directly proportional to the distance, but estimating the optical properties requires further analysis of the WIYN imaging data. We obtain two estimates of the apparent magnitude of the stars in the overdensity. The first estimate, which is essentially a minimum brightness, is derived by summing the flux from the individual stars that lie within the 2′ smoothing cell centered on the peak of the overdensity. The second estimate, which amounts to a maximum brightness, is derived by performing photometry within a large (2′) aperture centered on the overdensity, after masking out any sources that are obviously not part of a potential dwarf galaxy counterpart (e.g., resolved background galaxies, bright foreground stars). The uncertainties on these measurements are based solely on the magnitude errors from the photometry of either the individual stars or the large apertures themselves. We combine these minimum and maximum brightness estimates with the distance to the object to estimate the possible absolute magnitude range, including calculating the value in order to facilitate comparison to literature values. With an estimate of the luminosity and color of the object, we can determine its mass-to-light ratio using the relations given in Bell et al. (2003). The mass-to-light ratio can then be used to compute a stellar mass and an HI-to-stellar mass ratio.
4 Results
| Name | log | aaSee Section 3 for description for methods of determining limits on optical properties. | log aaSee Section 3 for description for methods of determining limits on optical properties. | aaSee Section 3 for description for methods of determining limits on optical properties. | ||||||||
|---|---|---|---|---|---|---|---|---|---|---|---|---|
| (faint)aaSee Section 3 for description for methods of determining limits on optical properties. | (bright) | (faint) | (bright) | (bright) | (faint) | |||||||
| - | [kpc] | [kpc] | [%] | [kpc] | [kpc] | [M☉] | [mag] | [mag] | [M☉] | [M☉] | - | - |
| AGC198606 | 880 | 20 | 97.9 | 1.4 | 1.2 | 6.1 ±0.1 | -4.0 ±0.01 | -6.7 ±0.13 | 3.8 ±0.01 | 5.5 ±0.10 | 3.8 | 205.0 |
| AGC215417 | 350 | 20 | 98.2 | 0.3 | 0.5 | 4.3 ±0.1 | -1.4 ±0.03 | -5.2 ±0.10 | 2.6 ±0.02 | 4.0 ±0.04 | 5.3 | 145.5 |
| AGC219656 | 900 | 200 | 99.9 | 0.7 | 1.0 | 5.2 ±0.2 | -3.9 ±0.02 | -7.0 ±0.09 | 3.6 ±0.01 | 4.7 ±0.02 | 3.3 | 36.9 |
| AGC249525bbValues from J17 | 1600 | 450 | 98.4 | 0.4 | 2.1 | 6.5 ±0.3 | -4.5 ±0.02 | -7.1 ±0.07 | 4.3 ±0.10 | 5.6 ±0.06 | 9.0 | 144.0 |
| AGC268069 | 700 | 100 | 99.9 | 0.9 | 0.7 | 5.1 ±0.1 | -2.8 ±0.03 | -6.9 ±0.08 | 3.4 ±0.02 | 5.2 ±0.05 | 0.8 | 48.8 |
Note. — This table lists the highest significance detection at any distance in the pODI image for each UCHVC. As described in Section 3, these objects are robust overdensities with and .
| Name | log | |||||
|---|---|---|---|---|---|---|
| - | [kpc] | [kpc] | [%] | [kpc] | [kpc] | [M☉] |
| Non-Robust Overdensities with and | ||||||
| AGC198831 | 410 | 20 | 92.0 | 0.2 | 1.0 | 5.2 |
| AGC249320 | 1140 | 70 | 95.2 | 2.6 | 0.8 | 5.4 |
| AGC258242 | 1020 | 100 | 90.3 | 2.3 | 1.1 | 5.2 |
| AGC268074 | 260 | 100 | 90.5 | 0.2 | 0.4 | 4.3 |
| Corner and Edge Overdensities () | ||||||
| AGC174540 | 1100 | 250 | 99.1 | 2.8 | 1.2 | 5.8 |
| AGC198511 | 2230 | 300 | 99.0 | 8.7 | 2.3 | 5.9 |
| AGC208747 | 520 | 100 | 99.9 | 2.1 | 0.8 | 5.2 |
| AGC208753 | 270 | 40 | 99.8 | 0.8 | 0.5 | 4.9 |
| AGC226067 | 880 | 60 | 98.3 | 2.2 | 0.6 | 5.2 |
| AGC227987 | 820 | 250 | 99.9 | 2.8 | 1.4 | 5.9 |
| AGC229326 | 250 | 20 | 99.7 | 1.0 | 0.3 | 4.1 |
| AGC238626 | 450 | 20 | 99.6 | 1.7 | 0.3 | 4.2 |
| AGC238713 | 1740 | 200 | 97.8 | 4.7 | 2.8 | 6.0 |
| AGC249000 | 1900 | 700 | 99.0 | 6.1 | 2.5 | 6.2 |
| AGC249282 | 630 | 160 | 99.5 | 1.7 | 0.5 | 5.1 |
| AGC249323 | 1900 | 100 | 97.2 | 4.8 | 3.0 | 6.1 |
| AGC258237 | 2400 | 200 | 96.3 | 6.0 | 2.5 | 6.3 |
| AGC258459 | 1340 | 200 | 97.3 | 3.7 | 2.0 | 5.8 |
The results of our analysis of the sample of UCHVCs observed with WIYN pODI are shown in Figures 2, 3, 4, and 5, and summarized in Tables 2 and 3. For each UCHVC, we present here the highest significance overdensity detected. In the Figures, we show the CMD filtering process at the given distance and the smoothed stellar density map.
Each overdensity detected is assigned a category depending on its significance and location in the image relative to the Hi distribution. Table 2 includes robust detections () within 8′ of the Hi centroid. We report the distance and its error , measured as the range of distances at which an overdensity with a significance occurs at the same location; the significance ; the distance of the overdensity from the ALFALFA Hi centroid , converted to kpc at the distance of the detection; the mean half-flux radius from ALFALFA , converted to kpc at the distance of the detection; the logarithm of the Hi mass at the measured distance log ; and the derived optical properties as described in Section 3.
Table 3 includes non-robust detections ( between 90% and 97%) within 8′ of the Hi centroid, and corner or edge detections, which may be highly significant but are more than 8′ away from the Hi centroid and are thus on the edge of the pODI image. The 8′ radius also corresponds to the largest-sized UCHVC in the sample presented in this paper. We argue later in this section that it is unlikely that a detection of an overdensity that is located several arcminutes away, in the far corner or edge of the image, is truly associated with the UCHVC target identified by ALFALFA. In Table 3, we report the same values as in Table 2, but do not estimate the optical properties of these objects. We discuss our results for each of these categories below, giving more detail on individual targets when appropriate.
4.1 Overdensities with
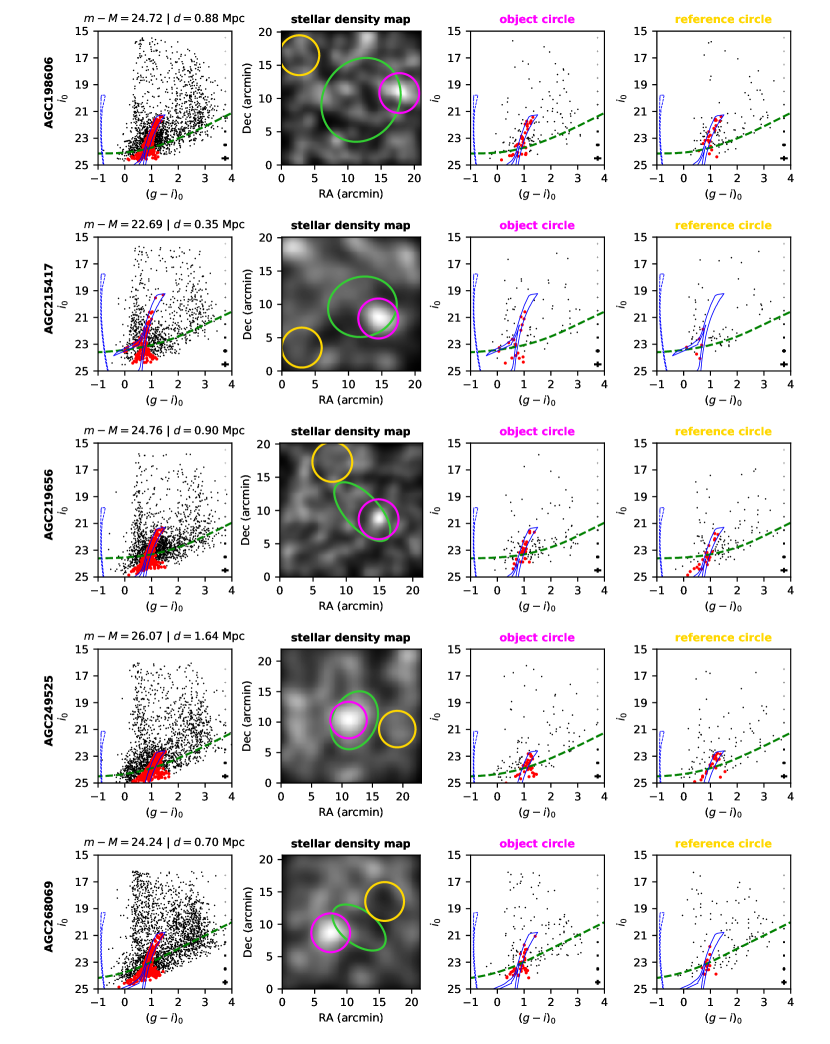
Five objects have values in the range 97.9-99.9%, distances between 350 kpc and 1.6 Mpc, and are located anywhere from 1.0′ to 5.6′ from the centroid of the Hi emission, and often within the Hi distribution as characterized by the half-flux ellipse (see Figure 2). They have stellar masses between and , Hi-to-stellar-mass ratios between 0.8 and 145, and absolute magnitudes between -1.4 and -7.1. The estimated magnitude and stellar mass values are consistent with the range found in nearby UFDs, but the values are large, whereas UFDs are typically gas-poor. Unlike Leo P, these objects appear to contain very few blue stars or stars nearby to the young stellar population isochrones, typically only as many as three or four, when considering the CMDs shown in Figure 2, indicating that they have not undergone recent star formation.
One of the high-significance detections listed in Table 2 is associated with AGC 249525. Results for this object were presented previously in J17 and are included in the results presented here. This overdensity is directly coincident with the highest density Hi contour derived from Westerbork Synthesis Radio Telescope (WSRT) synthesis imaging, and additionally shows evidence for an overdensity of RGB stars in the center of the image, without using a CMD filter to select a population at a particular distance.
As explained in Section 1, we also previously reported the detection of a stellar population associated with AGC 198606 in J15, and nicknamed this object “Friend of Leo T”. At the time, our search algorithm detected the highest significance overdensity () at kpc. In this work, we have applied a different algorithm to remove extended sources from our photometric catalog and reanalyzed the data (see the description of this method in Section 3). Figure 6 compares the J15 results with the reanalysis in this work. The left panel shows the stars in the field, with highlighted CMD filter-selected stars composing the overdensity described in J15, as well as stars in the same region from the reanalyzed data selected using an identical CMD filter at the same distance. Stars in common between both J15 and this work are identifiable by overlapping symbols. Nearly all of the stars composing the J15 overdensity are not present in the reanalysis, having been removed by the revised extended source cut algorithm. The right panel shows the difference in the results of the extended source cut for this portion of the pODI images, showing all the point sources with the stars selected by the CMD filter highlighted, in the region from the left panel. The extended source cut used in the reanalysis allows more faint sources with higher FWHM values, while the J15 extended source cut allows for more faint sources with lower FWHM values.
Using the different extended source cut algorithm, we identify a different overdensity as the most significant in the field, located 9′ to the West of the previously reported overdensity at a distance of 880 kpc. At a significance of this overdensity is still potentially associated with the Hi distribution, overlapping the half-flux ellipse. This stellar overdensity is now approximately twice the distance of Leo T, though our argument in J15 that AGC 198606 could be associated with Leo T based on the kinematics of the gas still applies, with the line of sight separation between the gas distributions remaining the same.
AGC 215417 is located at 350 kpc with a significance of . At this distance it is the lowest mass object among the robust detections and is also extremely faint. It is also unlikely to be associated with any of the known galaxies with similar radial velocities ( km s-1 ) within 10° on the sky since they are all located at much greater distances (at least 1 Mpc). AGC 215417 was observed in Bellazzini et al. (2015) as their object “L”. Though their analysis did not consider it to be an optical counterpart, their smoothing algorithm detected a region of higher point source density at approximately the same sky position as our overdensity.
AGC 268069 shares the highest significance in our sample (), at a distance of 700 kpc. There are no cataloged galaxy neighbors within 10 degrees that have similar systemic radial velocities ( km s-1 ; Adams et al., 2013) or distances; however, ten other ALFALFA sources with radial velocities between km s-1 and km s-1 are located less than 6° away on the sky. AGC 268069’s upper limit estimated stellar mass is the second highest of the UCHVCs in Table 2, at . AGC 268069 was observed in Bellazzini et al. (2015) as their object “W”, and was not associated with an optical counterpart in that work. If the imaging data from Bellazzini et al. (2015) is centered on the ALFALFA Hi centroid of AGC 268069, the overdensity we have identified here is outside of the footprint of those images.
AGC 219656 is the other highest significance detection in the sample (), and is located at a distance of 900 kpc. It has a recessional velocity of 192 km s-1 , and no obvious neighbors within 10° of its position that also have a recessional velocity km s-1 . AGC 219656 is included in the sample of UCHVCs observed with WSRT in Adams et al. (2016), but was not selected as a good candidate for follow-up based on the higher-resolution WSRT data.
4.2 Overdensities with
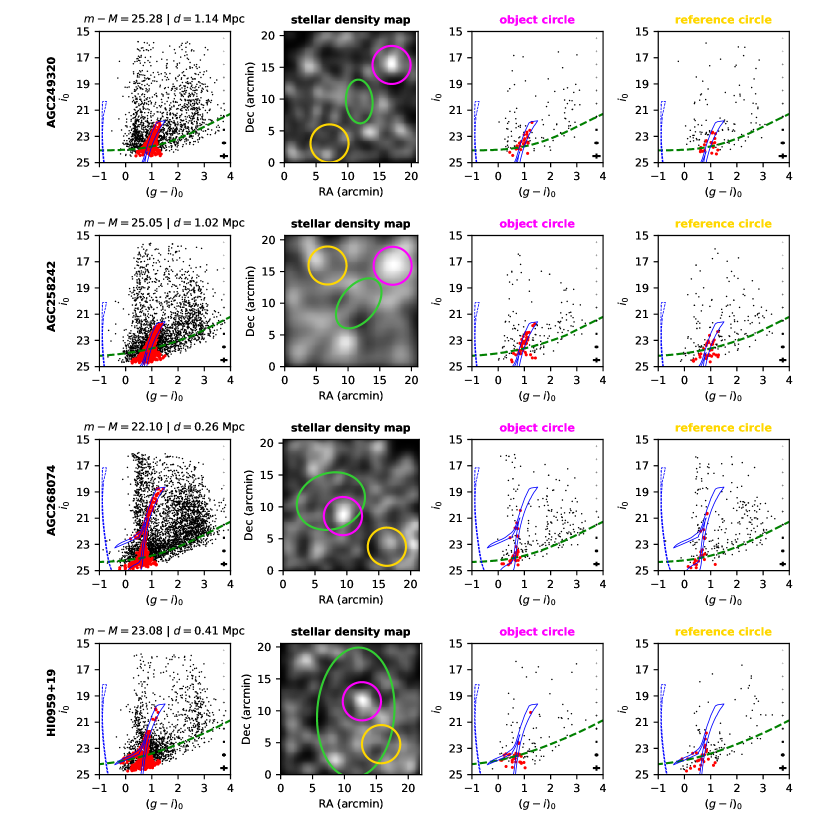
Four of the objects are classified in Table 3 as non-robust close overdensities and shown in Figure 3. These objects all have relatively low significances between and but are located within 8′ of the center of the Hi distribution. While they do not meet the criteria for robust detections because of their lack of supporting overdensities, these marginal detections are still potential stellar counterparts.
Two of these objects were observed by Bellazzini et al. (2015), AGC 258242 and AGC 268074. Neither of these objects had significant stellar overdensities in the Large Binocular Telescope images from that work, though the footprint of those images is smaller () than that of the pODI images. Our detection for AGC 258242 would be well outside that footprint, assuming the LBT image is centered on the Hi centroid. In the case of AGC 268074, the object detected in our pODI images would likely fall within the LBT image footprint, but Bellazzini et al. (2015) do not detect an overdensity in their data for this UCHVC.
4.3 Corner and Edge Overdensities
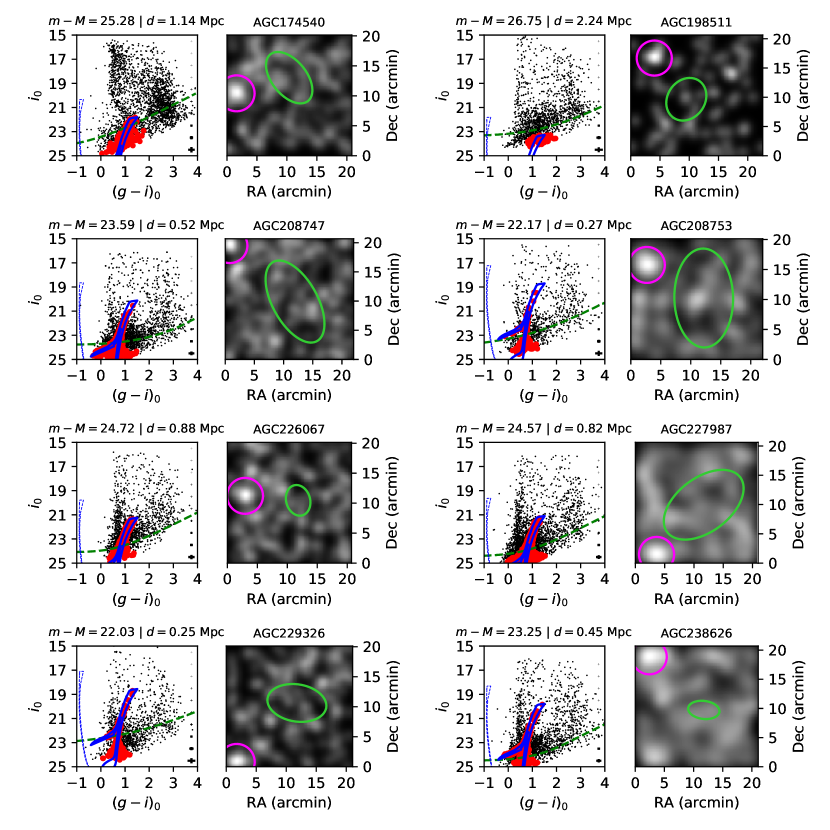
For fourteen of the UCHVCs we imaged with the pODI camera, the most significant overdensity in the field was located in the corner or on the edge of the image. These overdensities had significances ranging from to . While these overdensities are statistically significant when compared to a random distribution of objects, we do not consider them to be detections of stellar counterparts to the UCHVCs because they are too distant (approximately 9′ to 14′ away from the Hi detection) to be reliably associated with the gas. To be fair, these overdensities could represent stellar populations that did once “belong” to the UCHVCs, but the gas and stars have been separated by some process. This hypothesis would be impossible to confirm without detailed follow-up observations. It seems more likely that the overdensities we have detected are groupings of unresolved, redshifted background galaxies. We emphasize that in order to assess the significance of our detections, we compare them to random spatial distributions, and objects in the universe are of course not spread over the sky randomly but instead tend to be clustered. Thus the Corner/Edge detections represent real overdensities of objects, but their distance from the Hi centroid makes it unlikely that they are actually associated with the UCVHCs. These fourteen objects are listed in the last grouping in Table 3 and, for completeness, we have included the CMDs and smoothed density maps for these objects in Figures 4 and 5, but we do not carry out further analysis of these specific sources in this work.
One of the objects that is listed as a Corner / Edge detection only is AGC 226067. This object was classified as a UCHVC in ALFALFA and we observed it with WIYN pODI, but we did not find a high-significance overdensity of point sources associated with the Hi gas distribution in the pODI images. Instead we detect an overdensity of point sources in the corner of the image only, from the Hi centroid. There is, however, a diffuse blue object without any resolved stars near the center of the pODI images that we interpret as the optical counterpart to this UCHVC. In Adams et al. (2015), our group presented Hi synthesis mapping of AGC 226067 and showed that the area around this object includes a system with multiple components, some with Hi only and others with both Hi and optical emission. It was argued in that paper that the diffuse blue object that is an optical counterpart to AGC 226067 is at a distance comparable to the Virgo Cluster, in part because the stars in the object were unresolved in the pODI images. As described in the Introduction, the optical emission from AGC 226067 has been studied in detail by other groups and was found to likely be a pre-enriched remnant gas cloud stripped from another Virgo Cluster galaxy (Beccari et al., 2017; Sand et al., 2017).
5 Discussion
5.1 Comparison to Known Galaxies
The optical counterparts listed in Table 2 have absolute magnitudes that span the range of dwarf galaxies in the local Universe. Segue 1 (; Belokurov et al., 2007), an ultra-faint dwarf galaxy, is at the low end of the range, with a similar magnitude to the faint limit for one candidate galaxy in our sample, AGC 215417. The range defined by the faint and bright magnitude limits for our candidate dwarf galaxies is . A few dozen other dwarf galaxies, including some of the long-known “classical” dwarf spheroidal satellites in the Local Group, fall within this range (McConnachie, 2012). The eight candidate dwarf galaxies discovered in early Dark Energy Survey (DES) data (Bechtol et al., 2015) also have magnitude estimates consistent with the range of our dwarf galaxy candidates, though nearly all of the classical satellites and UFDs discovered by wide-field surveys like SDSS and DES are within 350 kpc of the Milky Way.
A more relevant comparison may be to known gas-rich low-mass dwarf galaxies. Leo T (Irwin et al., 2007) has gas properties similar to those of the UCHVCs and an absolute magnitude of (de Jong et al., 2008), and Leo P is a UCHVC itself with (McQuinn et al., 2015). The M31 satellite LGS 3 has an Hi mass consistent with the UCHVCs ( ), but is brighter than any candidate galaxy presented in this paper at (McConnachie, 2012). Pisces A (Tollerud et al., 2015) is also a UCHVC analog, with an absolute magnitude , a stellar mass , and an Hi mass (Tollerud et al., 2016). Pisces A was cataloged by ALFALFA as AGC 103722 (Haynes et al., 2018) and it is part of the final sample of the Survey of Hi in Extremely Low-mass Dwarfs (SHIELD; Cannon et al., 2011), an ALFALFA follow-up program to explore gas-rich dwarf galaxies with Hi masses between and and distances between 3 and 8 Mpc. Crucially, all four of these galaxies have evidence of recent or ongoing star formation, unlike the UCHVCs presented in this paper. A number of other galaxies with significant gas content, but without star formation, exist in the local Universe – Antlia, Aquarius, KKR 3, KKH 86, and Phoenix all have at least of Hi gas, but with absolute magnitudes between , all are brighter than the galaxy candidates described here (McConnachie, 2012). We also note that the Hi distribution in Phoenix is offset from the stellar distribution by about 6′, though the two distributions still overlap (Young et al., 2007).
A wide range of stellar masses has been observed in extremely faint galaxies. Several of the nearby UFDs discovered in SDSS, and all of the DES galaxy candidates, have stellar masses between and , while the more gas-rich galaxies described above have stellar masses between and . Though the observed mass function of gas-rich galaxies does not reach as low in mass as the UFDs, it does not preclude the existence of lower stellar mass gas-rich galaxies in the Local Group. UFDs within the virial radius of the Milky Way are extremely unlikely to have retained any of their gas due to ram pressure stripping (Spekkens et al., 2014), but more distant, gas-rich galaxies are less likely to have undergone such interactions. Since the galaxy candidates presented in this paper are located between 350 kpc and 2.2 Mpc, and are relatively isolated, it seems likely that they represent at least a portion of such a population of galaxies.
We can also compare the kinematic properties of the UCHVC galaxy candidates to other known galaxies of similar mass. Figure 7 shows the UCHVCs with tentative optical counterparts in the context of the baryonic Tully-Fisher relation (BTFR; Tully & Fisher, 1977; McGaugh, 2012), an observed tight correlation between the baryonic mass of a galaxy and its maximum rotation velocity. In order to place the UCHVCs on this relation, we use the value from ALFALFA divided by a factor of two as a proxy for maximum rotational velocity. Given the uncertainty in the total stellar content of these galaxies depending on how the stellar luminosity is calculated (see Section 3), and the fact that the galaxies are nearly always gas-dominated, we use the sum of the total neutral gas mass (the Hi mass multiplied by a factor of 1.33 to correct for Helium abundance) and the mean stellar mass to represent the total baryonic mass, while the range of stellar mass and distance error both contribute to the error on the total mass.
The two UCHVCs shown in red in Figure 7, AGC 198606 and AGC 249525, have resolved Hi data from WSRT, including position-velocity slices along a clear velocity gradient that were used to constrain the maximum rotational velocity (Adams et al., 2016). In Figure 7 we show both the BTFR and the gas-dominated galaxy sample from McGaugh (2012), and we add SHIELD galaxies (McNichols et al., 2016) and Leo P (Bernstein-Cooper et al., 2014) to populate the region between the McGaugh galaxies and the UCHVCs. The UCHVCs are broadly consistent with the BTFR, indicating that this relation may continue to the lowest baryonic masses and the extreme end of the distribution of galaxies that form in the Universe. However, below a rotational velocity of km s-1 , galaxies are no longer rotationally supported (Dalcanton, & Stilp, 2010; McNichols et al., 2016), making the placement of the UCVHCs on the BTFR potentially inappropriate. The nature of the UCHVCs is still poorly understood, so additional Hi synthesis imaging will be crucial in order to investigate the gas distribution and dynamics and thus the interactions between the gas and stars, as well as to better determine the mass of the underlying dark matter halo.
5.2 Incidence Rate of Stellar Counterparts
Of the 23 UCHVCs we observed with WIYN pODI, five () were found to have a stellar counterpart that appears to be associated with the Hi source (97.9% to 99.9% significance, and with a location close to the Hi centroid and/or within the Hi distribution). Four more UCHVCs had stellar populations detected at slightly lower confidence (92-95%) but also in proximity to the Hi. Without higher resolution Hi synthesis imaging of all the UCHVCs, we cannot localize high peak column density regions that would be more likely to form stars. Therefore, we cannot make specific predictions about which UCHVCs should contain stellar populations.
Using hydrodynamic simulations of galaxy formation, Sawala et al. (2016) predict that fewer than 10% of all halos with dynamical mass will have a luminous component. We can therefore make a general prediction about the number of UCHVCs that contain a stellar population, since all of the UCHVCs appear to have a dynamical mass . Using Figure 1 as a guide, we count the number of objects in the optical follow-up sample as a function of their mean column density: there are 9 UCHVCs with atoms cm-2 and 14 with atoms cm-2. If 10% of these objects have a luminous component, following the prediction of Sawala et al. (2016), we could expect 1 out of the 9 UCHVCs with atoms cm-2, and 1 to 2 out of the 14 UCHVCs with atoms cm-2, to have an associated stellar counterpart. Our current study indicates that the presence of a stellar counterpart in low mass halos is much more common, at least for gas-bearing halos. We find that three of the nine UCHVCs with atoms cm-2 have stellar populations detectable in our images, and 5 out of 23 overall, substantially above the 10% fraction of halos with luminous components predicted in the Sawala et al. (2016) models. Since the Sawala et al. (2016) model predictions are for all halos, and not just halos containing a gaseous component, it might be that the neutral gas in these halos, and/or their isolation, helps explain the higher incidence rate.
Further, while the two highest column density sources in the pODI sample, AGC 198606 and AGC 249525, both have a significance detection of an associated stellar population, the lowest column density source, AGC 215417, also has a detection. As a group, the high-significance detections evenly span the range of mean column density. However, localized regions of higher column density can exist in the gas distribution, even if the mean column density is measured to be below observed thresholds for star formation (e.g., van Zee et al., 1997). Indeed, Leo P, which has current star formation, has an ALFALFA-measured mean column density similar to that of the highest column densities in our sample ( atoms cm-2), though when observed with VLA, an order of magnitude higher peak column density was observed ( atoms cm-2; Giovanelli et al., 2013; Bernstein-Cooper et al., 2014). Leo T, with recent but not active star formation, has a peak column density twice that of Leo P, atoms cm-2 (Adams & Oosterloo, 2017). Though star formation may be unexpected in these isolated, low gas density systems, it clearly does occur in the local Universe, at least in some cases.
5.3 Implications for Galaxy Formation Scenarios
A growing population of extremely faint, gas rich galaxies in the Local Group and its environs presents an opportunity to test recent predictions about the formation of such systems. Because their optical properties are similar to those of the UFDs, one might speculate that the stellar components of the UCHVCs that we have identified could represent a progenitor class of galaxies to the UFDs. This is not a unique idea; Willman et al. (2006) and Martin et al. (2007) both speculate that the UFDs could be the end result of a tidal interaction between a dwarf galaxy and the Milky Way. Bovill & Ricotti (2011) used -body and semi-analytic models to show that the population of isolated UFDs in the Local Volume should be larger than previously observed, though they predicted most of these objects would be gas-poor as a result of stellar feedback effects or stripping. UCHVCs containing stars are even within the realm of simulation: Oñorbe et al. (2015) used high-resolution hydrodynamic simulations to predict the existence of objects with properties similar to the UCHVCs presented in this paper, with stellar masses between and , and high gas-to-stellar mass ratios. Verbeke et al. (2015) and Vandenbroucke et al. (2016) inserted feedback from Population III stars into -body/hydrodynamical simulations, by injecting more energy from supernovae into the simulated interstellar medium while holding the metal yields for the supernovae constant. Those simulations produced several galaxies similar to the candidates presented here – gas-dominated galaxies with stellar masses , Hi masses , and absolute magnitudes .
Clearly, further simulations and observations are needed to fully understand the UCHVCs as a population of faint dwarf galaxies. With no evidence of recent star formation in any of the candidate galaxies in this paper, a convincing explanation for turning off the star formation mechanisms while still retaining a significant reservoir of gas is necessary. The models outlined in Verbeke et al. (2015) and Vandenbroucke et al. (2016) relating to Population III stars have come the closest, though as those authors point out, the astrophysics of Population III stars are still poorly understood due to lack of observational evidence.
In addition to further investigation of the origin and evolution of these objects, observational confirmation of the stellar populations associated with the UCHVCs is clearly needed. Observations with a larger-aperture ground-based telescope may be helpful for producing a deeper CMD and further investigating the veracity of the potential stellar counterparts we have identified. Spectroscopic observations of the stars in the overdensities, while only feasible with current capabilities for stars brighter than , would also be useful for confirming the association between the Hi gas and stars in the UCHVCs. Ideally, we would obtain space-based observations, similar to the deep HST imaging of Leo P (McQuinn et al., 2015), in order to explore the stellar content and star formation histories of these dwarf galaxy candidates. Finally, many more UCHVCs have already been observed with WIYN/ODI. Based on the incidence rate of candidates in this paper, we would expect to detect roughly two to six additional candidates in the ODI imaging data we have already acquired.
References
- Adams et al. (2013) Adams, E. A. K., Giovanelli, R., & Haynes, M. P. 2013, ApJ, 768, 77
- Adams et al. (2015) Adams, E. A. K., Faerman, Y., Janesh, W. F., et al. 2015, A&A, 573, LL3
- Adams et al. (2016) Adams, E. A. K., Oosterloo, T. A., Cannon, J. M., Giovanelli, R., & Haynes, M. P. 2016, A&A, 596, A117
- Adams & Oosterloo (2017) Adams, E. A. K., & Oosterloo, T. A. 2017, arXiv:1712.06636
- Beccari et al. (2017) Beccari, G., Bellazzini, M., Magrini, L., et al. 2017, MNRAS, 465, 2189
- Bechtol et al. (2015) Bechtol, K., Drlica-Wagner, A., Balbinot, E., et al. 2015, ApJ, 807, 50
- Bell et al. (2003) Bell, E. F., McIntosh, D. H., Katz, N., & Weinberg, M. D. 2003, ApJS, 149, 289
- Bellazzini et al. (2015) Bellazzini, M., Beccari, G., Battaglia, G., et al. 2015, A&A, 575, A126
- Belokurov et al. (2007) Belokurov, V., Zucker, D. B., Evans, N. W., et al. 2007, ApJ, 654, 897
- Benítez-Llambay et al. (2017) Benítez-Llambay, A., Navarro, J. F., Frenk, C. S., et al. 2017, MNRAS, 465, 3913
- Bernstein-Cooper et al. (2014) Bernstein-Cooper, E. Z., Cannon, J. M., Elson, E. C., et al. 2014, AJ, 148, 35
- Bovill & Ricotti (2011) Bovill, M. S., & Ricotti, M. 2011, ApJ, 741, 18
- Cannon et al. (2011) Cannon, J. M., Giovanelli, R., Haynes, M. P., et al. 2011, ApJ, 739, L22
- Dalcanton, & Stilp (2010) Dalcanton, J. J., & Stilp, A. M. 2010, ApJ, 721, 547.
- de Jong et al. (2008) de Jong, J. T. A., Harris, J., Coleman, M. G., et al. 2008, ApJ, 680, 1112-1119
- Eisenstein et al. (2011) Eisenstein, D. J., Weinberg, D. H., Agol, E., et al. 2011, AJ, 142, 72
- Giovanelli et al. (2005) Giovanelli, R., Haynes, M. P., Kent, B. R., et al. 2005, AJ, 130, 2598
- Giovanelli et al. (2010) Giovanelli, R., Haynes, M. P., Kent, B. R., & Adams, E. A. K. 2010, ApJ, 708, L22
- Giovanelli et al. (2013) Giovanelli, R., Haynes, M. P., Adams, E. A. K., et al. 2013, AJ, 146, 15
- Girardi et al. (2004) Girardi, L., Grebel, E. K., Odenkirchen, M., & Chiosi, C. 2004, A&A, 422, 205
- Haynes et al. (2011) Haynes, M. P., Giovanelli, R., Martin, A. M., et al. 2011, AJ, 142, 170
- Haynes et al. (2018) Haynes, M. P., Giovanelli, R., Kent, B. R., et al. 2018, ApJ, 861, 49.
- Irwin et al. (2007) Irwin, M. J., Belokurov, V., Evans, N. W., et al. 2007, ApJ, 656, L13
- Janesh et al. (2015) Janesh, W., Rhode, K. L., Salzer, J. J., et al. 2015, ApJ, 811, 35
- Janesh et al. (2017) Janesh, W., Rhode, K. L., Salzer, J. J., et al. 2017, ApJ, 837, L16
- Janowiecki et al. (2015) Janowiecki, S., Leisman, L., Józsa, G., et al. 2015, ApJ, 801, 96.
- Kotulla (2014) Kotulla, R. 2014, Astronomical Society of the Pacific Conference Series, 485, 375
- Martin et al. (2007) Martin, N. F., Ibata, R. A., Chapman, S. C., Irwin, M., & Lewis, G. F. 2007, MNRAS, 380, 281
- McConnachie (2012) McConnachie, A. W. 2012, AJ, 144, 4
- McGaugh (2012) McGaugh, S. S. 2012, AJ, 143, 40
- McNichols et al. (2016) McNichols, A. T., Teich, Y. G., Nims, E., et al. 2016, ApJ, 832, 89
- McQuinn et al. (2015) McQuinn, K. B. W., Skillman, E. D., Dolphin, A., et al. 2015, ApJ, 812, 158
- Oñorbe et al. (2015) Oñorbe, J., Boylan-Kolchin, M., Bullock, J. S., et al. 2015, arXiv:1502.02036
- Peek et al. (2011) Peek, J. E. G., Heiles, C., Douglas, K. A., et al. 2011, ApJS, 194, 20
- Revaz & Jablonka (2018) Revaz, Y., & Jablonka, P. 2018, arXiv:1801.06222
- Rhode et al. (2013) Rhode, K. L., Salzer, J. J., Haurberg, N. C., et al. 2013, AJ, 145, 149
- Ryan-Weber et al. (2008) Ryan-Weber, E. V., Begum, A., Oosterloo, T., et al. 2008, MNRAS, 384, 535
- Sand et al. (2015) Sand, D. J., Crnojević, D., Bennet, P., et al. 2015, ApJ, 806, 95
- Sand et al. (2017) Sand, D. J., Seth, A. C., Crnojević, D., et al. 2017, ApJ, 843, 134
- Sawala et al. (2016) Sawala, T., Frenk, C. S., Fattahi, A., et al. 2016, MNRAS, 456, 85
- Schlegel et al. (1998) Schlegel, D. J., Finkbeiner, D. P., & Davis, M. 1998, ApJ, 500, 525
- Schlafly & Finkbeiner (2011) Schlafly, E.F. & Finkbeiner, D.P. 2011, ApJ, 737, 103
- Skillman et al. (2013) Skillman, E. D., Salzer, J. J., Berg, D. A., et al. 2013, AJ, 146, 3
- Spekkens et al. (2014) Spekkens, K., Urbancic, N., Mason, B. S., Willman, B., & Aguirre, J. E. 2014, ApJ, 795, L5
- Tollerud et al. (2015) Tollerud, E. J., Geha, M. C., Grcevich, J., Putman, M. E., & Stern, D. 2015, ApJ, 798, L21
- Tollerud et al. (2016) Tollerud, E. J., Geha, M. C., Grcevich, J., et al. 2016, ApJ, 827, 89
- Tully et al. (2013) Tully, R. B., Courtois, H. M., Dolphin, A. E., et al. 2013, AJ, 146, 86
- Tully & Fisher (1977) Tully, R. B., & Fisher, J. R. 1977, A&A, 54, 661
- van Zee et al. (1997) van Zee, L., Haynes, M. P., Salzer, J. J., & Broeils, A. H. 1997, AJ, 113, 1618
- Vandenbroucke et al. (2016) Vandenbroucke, B., Verbeke, R., & De Rijcke, S. 2016, MNRAS, 458, 912
- Verbeke et al. (2015) Verbeke, R., Vandenbroucke, B., & De Rijcke, S. 2015, ApJ, 815, 85
- Walsh et al. (2009) Walsh, S. M., Willman, B., & Jerjen, H. 2009, AJ, 137, 450
- Willman et al. (2006) Willman, B., Masjedi, M., Hogg, D. W., et al. 2006, arXiv:astro-ph/0603486
- Young et al. (2007) Young, L. M., Skillman, E. D., Weisz, D. R., et al. 2007, ApJ, 659, 331.