A Triple AGN in a Mid-Infrared Selected Late Stage Galaxy Merger
Abstract
The co-evolution of galaxies and the supermassive black holes (SMBHs) at their centers via hierarchical galaxy mergers is a key prediction of CDM cosmology. As gas and dust are funneled to the SMBHs during the merger, the SMBHs light up as active galactic nuclei (AGNs). In some cases, a merger of two galaxies can encounter a third galaxy, leading to a triple merger, which would manifest as a triple AGN if all three SMBHs are simultaneously accreting. Using high-spatial resolution X-ray, near-IR, and optical spectroscopic diagnostics, we report here a compelling case of an AGN triplet with mutual separations 10 kpc in the advanced merger SDSS J084905.51+111447.2 at . The system exhibits three nuclear X-ray sources, optical spectroscopic line ratios consistent with AGN in each nucleus, a high excitation near-IR coronal line in one nucleus, and broad Pa detections in two nuclei. Hard X-ray spectral fitting reveals a high column density along the line of sight, consistent with the picture of late-stage mergers hosting heavily absorbed AGNs. Our multiwavelength diagnostics support a triple AGN scenario, and we rule out alternative explanations such as star formation activity, shock-driven emission, and emission from fewer than three AGN. The dynamics of gravitationally bound triple SMBH systems can dramatically reduce binary SMBH inspiral timescales, providing a possible means to surmount the “Final Parsec Problem.” AGN triplets in advanced mergers are the only observational forerunner to bound triple SMBH systems and thus offer a glimpse of the accretion activity and environments of the AGNs prior to the gravitationally-bound triple phase.
1 Introduction
Observational campaigns and theoretical studies have shown both that supermassive black holes (SMBHs) reside at the centers of most galaxies and that galaxy interactions are ubiquitous in the Universe. As a result, galaxies grow and evolve hierarchically through collisions (e.g. Toomre & Toomre, 1972; Schweizer, 1982; Barnes & Hernquist, 1992; Schweizer, 1996; Hibbard & van Gorkom, 1996; Rothberg & Joseph, 2004), during which gravitational torques drive gas reservoirs toward the centers of each galaxy, potentially fueling the SMBHs at their centers (Barnes & Hernquist, 1992; Mihos & Hernquist, 1996; Hopkins et al., 2008; Blecha et al., 2018). Recent simulations predict that late-stage galaxy mergers — with nuclear pair separations 10 kpc — facilitate the most rapid black hole growth and represent the merger stage during which both SMBHs are expected to begin accreting as active galactic nuclei (AGNs) (Hopkins et al., 2008; Blecha et al., 2018). Such dual AGNs are predicted to be highly obscured by gas and dust, consequently exhibiting red mid-infrared colors (Blecha et al., 2018). Indeed, observational studies have demonstrated that late stage galaxy mergers (pair separations 10 kpc) and post-mergers host higher fractions of dust obscured AGNs than do isolated galaxies in rigorously matched control samples, and in fact mid-infrared selection identifies a larger quantity of obscured AGNs in mergers than traditional optical selection techniques (Satyapal et al., 2014; Weston et al., 2017; Ellison et al., 2019). Despite their important role in black hole and galaxy evolution, however, dual AGNs are rare systems, and less than 30 have been robustly verified in the literature (see Table 8 in Satyapal et al., 2017 and references therein). The rarity of dual AGNs emphasizes the need for efficient selection methods when conducting systematic searches for dual AGNs.
In our previous studies of dual AGNs, we preselected the late stage galaxy mergers (pair separations 10 kpc) based upon their mid-infrared WISE colors (Satyapal et al., 2017; Pfeifle et al., 2019), selecting systems that exhibit a WISE color, a color cut that has been demonstrated in simulations to be the most effective at identifying AGNs in late-stage mergers (Blecha et al., 2018). We obtained follow-up high spatial resolution X-ray observations of these mergers with the Chandra X-ray Observatory (Chandra) and longslit near-infrared spectroscopic observations with the Large Binocular Telescope (LBT) to look for dual nuclear X-ray sources and high ionization coronal emission lines. Not only did a majority of the mergers host dual AGNs or dual AGN candidates (Ellison et al., 2017; Satyapal et al., 2017; Pfeifle et al., 2019), but one system exhibited three nuclear X-ray sources and — upon closer inspection — was realized as a clear case of a triple merger: SDSS J084905.51+111447.2 (henceforth SDSS J0849+1114).111In Pfeifle et al. (2019), two systems were reported as having triple nuclear X-ray sources: SDSS J0849+1114 and SDSS J1306+0735. While the morphology of SDSS J0849+1114 is easily discerned, it is still unclear — despite its three X-ray sources — if SDSS J1306+0735 is a triple merger; a separate investigation is needed to better characterize this latter system. This study demonstrated the effectiveness of using mid-infrared colors as a pre-selection strategy for finding AGNs in advanced mergers.
Dual AGNs in advanced mergers represent the most observationally accessible progenitors of the SMBH binary phase, which likely produces the main source of gravitational waves (GWs) (Wyithe & Loeb, 2003; Sesana et al., 2004; Mingarelli et al., 2017; Kelley et al., 2017) detectable by Pulsar Timing Array campaigns (Verbiest et al., 2016) and future spaced-based observations from the Laser Interferometer Space Antenna (LISA) (Amaro-Seoane et al., 2017). However, SMBH binaries in realistic astrophysical environments can stall on parsec-scale orbits, resulting in merger timescales that exceed the age of the Universe. An intruding third SMBH has been shown to significantly shorten coalescence time scales (Ryu et al., 2018) and can also result in slingshot ejections of one of the black holes from the host, resulting in either ejected or wandering SMBHs (e.g. Hoffman & Loeb, 2007; Bonetti et al., 2018, 2019). Triple mergers are therefore of particular interest, because recent cosmological simulations predict 16% of binary SMBHs resulting from major mergers will undergo an interaction with a third SMBH prior to coalescing (Kelley et al., 2017). Triple AGN-hosting mergers are exceedingly rare, with only a handful of triple AGN candidates in mergers reported in the literature (Liu et al., 2011; Koss et al., 2012; Kalfountzou et al., 2017) so far.222Schawinski et al. (2012) reported the detection of a triple AGN candidate, but — as stated by the authors — given its high redshift, it is unclear if this system resides in a clumpy galaxy where the black holes are forming in situ, or if it is a merging system.,333Deane et al. (2014) reported the detection of a triple AGN in the system SDSS J1502+1115 based on 1.7 GHz and 5 GHz observations from VLBI, however higher resolution follow-up observations presented in Wrobel et al. (2014) suggest that this system more likely hosts a dual AGN where one of the AGNs exhibits radio hotspots.
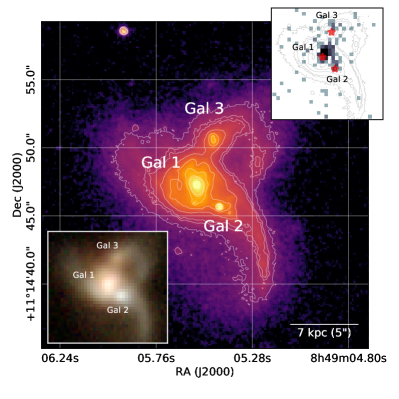
In this work we present a suite of multiwavelength observations providing convincing evidence for a triple AGN in the merging system, SDSS J0849+1114. SDSS J0849+1114 is a late stage merger at a distance of 350 Mpc () comprising three interacting galaxies, with nuclear pair separations of 2.3′′ (3.4 kpc, ), 3.6′′ (5.3 kpc, ), and 5.0′′ (7.3 kpc, ) based upon archival (PI: X. Liu) Hubble Space Telescope (HST) imaging data (Figure 1). Morphologically, the system exhibits strong tidal features indicative of an advanced merger. With an integrated 8-1000m infrared luminosity of , this merger falls within the class of Luminous Infrared Galaxies (LIRGs). Based on the all-sky Wide-field Infrared Survey Explorer (WISE), it displays a strong mid-infrared continuum with colors () often associated with powerful AGN (Stern et al., 2012), and was therefore included in our previous dual AGN sample. As reported in Pfeifle et al. (2019), SDSS J0849+1114 exhibited three nuclear X-ray sources with luminosities in excess of that expected by star formation contributions, and a high ionization [SiVI] coronal emission line was identified in the near-infrared spectrum of Galaxy 1. Furthermore, the system exhibited signs of high absorption along the line of sight based on its X-ray spectral properties.
Interestingly, this object was also selected independently in a catalog of optically selected AGN pairs in Liu et al. (2011), and was identified as a triple AGN candidate. We combine the archival Chandra data from this program with our own in this analysis.
In this manuscript, we present new NuSTAR hard X-ray observations and X-ray spectral fitting results, new LBT optical spectroscopic observations along with archival SDSS optical spectra, we refine the source statistics using the combined Chandra datasets, and we show for the first time the near-IR spectra for all three galaxy nuclei. The manuscript is laid out as follows: In Section 2 we provide details on the observations and data reduction steps. In Section 3 we discuss the results obtained from the X-ray, near-IR, and optical spectroscopic observations. In Section 4 we explore alternative scenarios for the observed data and discuss this target in the broader context of our mid-infrared selection technique. In Section 5 we summarize our conclusions. Throughout this paper we adopt km s-1 Mpc-1, , and .
2 Observations and Data Reduction
During our original dual AGN campaign, we obtained Chandra X-ray observations and near-infrared spectroscopy from the LBT of SDSS J0849+1114. As part of a follow-up effort we also obtained hard X-ray NuSTAR observations and longslit optical spectroscopic observations from the LBT.444For our LBT spectroscopic observations, we were careful to obtain observations in optimal seeing conditions () and extracted the spectra in apertures small enough (, see Section 2.4) to ensure measurements are restricted to each respective nucleus. During this analysis, we also retrieved the archival HST and Chandra observations. The Chandra data were reduced using the same procedure outlined in-depth in Pfeifle et al. (2019). Here we describe all other observations.
2.1 NuSTAR Imaging Observations
The 31ks NuSTAR observation was taken on 1 March 2017 (PI: Satyapal) and processed using the NuSTAR Data Analysis Software (NuSTARDAS). To obtain level 2 data products, we ran nupipeline version 0.4.6 with the latest caldb and clock correction update files. Due to the moderate angular resolution of NuSTAR (FWHM 18′′), we used a 30′′ radius aperture for source extraction and a 30′′ aperture for background extraction in the immediate vicinity of the source region. We then created the level three data products using nuproducts. The spectra generated for fpma and fpmb were then grouped by 1 count per bin, due to the low number of counts in the spectra, using grppha.
2.2 Chandra and NuSTAR Spectral Analysis
All simulations and X-ray spectral fitting for the Chandra and NuSTAR observations were conducted using the xspec (Arnaud, 1996) X-ray spectral fitting package version 12.9.1 with Cash statistics (C-Stat; Cash, 1979). We employed a physically motivated model, borus (Baloković et al., 2018), for reprocessed emission along with model components for photoelectric absorption and Compton scattering. This model has 4 free parameters and is represented by: constant phabs(borus02 + zphabs cabs cutoffpl + constant cutoffpl).
Due to the difference in the angular resolution limits of Chandra (PSF FWHM 0.5′′) and NuSTAR, any hard X-ray photons from the three sources would be confused within the NuSTAR extraction aperture. Before any simultaneous fitting of the observations was performed we first attempted to deconvolve these signals. We began by simulating the keV spectra of the three Chandra sources using the borus model described above (with ), in each case adjusting the normalization such that the model returned the same keV fluxes. We simulated the spectra for a range of column densities (22.0 log() 25.0 in increments of log() and then derived the associated keV fluxes. We then fit the NuSTAR spectra with the same borus model; based upon the derived NuSTAR flux and the simulated fluxes of the three Chandra sources, it appeared that only Galaxy 1 contributes appreciably to the observed NuSTAR flux. We therefore fit the NuSTAR data simultaneously with the Chandra spectrum of the Galaxy 1 source, only. It is not possible to constrain whether the two remaining AGN are Compton-thick, and it is still possible that they contribute a non-negligible fraction of the NuSTAR flux.
2.3 LBT Near-Infrared Spectroscopic Observations
Observations were obtained using LUCI-2 for Galaxy 1 and 2 on 30 January 2018 simultaneously (total of 1440 seconds) using a single slit position with a position angle (PA) of 49.4∘ and for Galaxy 3 on 03 January 2018 (total of 2400 seconds) using the same PA. All observations used a 1′′.5 wide slit and the low-resolution G200 grating with HKspec filter. This provides a wavelength coverage of 1.46m 2.34m and R 570-920. The seeing was 1′′ for all observations. The data were reduced using customized IRAF scripts for flat-fielding, wavelength calibration, and rectification of the spectra. Galaxies 1 and 2 were extracted in a 3-pixel (0′′.75) wide slit and a 4.8 pixel (1′′.2) wide slit for Galaxy 3. The spatial apertures were selected to be larger than the seeing to maximize signal-to-noise. Telluric corrections and flux calibration was performed on each galaxy using Version 4.0 of Xtellcor (Vacca et al., 2003).
2.4 LBT Optical Spectroscopic Observations
Binocular Multi-Object Double Spectrograph (MODS) observations of Galaxy 1 and 2 were obtained simultaneously on 28 November 2018 using a single slit position with PA = 230∘. MODS-1 was configured with the dual grating (blue and red channels) and MODS-2 configured with the blue channel only. Observations were obtained with a 1′′.2 wide slit and a total of 3600 seconds for the red channel and 7200 seconds combined for the two blue channels. The average seeing during the observations was 1′′. The data were reduced first using Version 2.04 of the modsCCDRed python scripts and then flat-fielded, wavelength calibrated, rectified, and flux-calibrated using customized IRAF scripts. A 1D spectrum for each galaxy was extracted in a 1′′ wide spatial diameter based on the same criteria as the near-IR spectra.
2.5 LBT Optical Spectral Fitting to Determine Fluxes and Stellar Velocity Dispersion
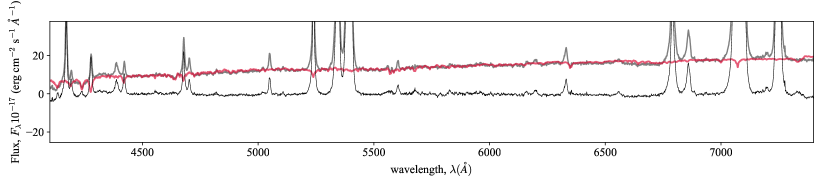
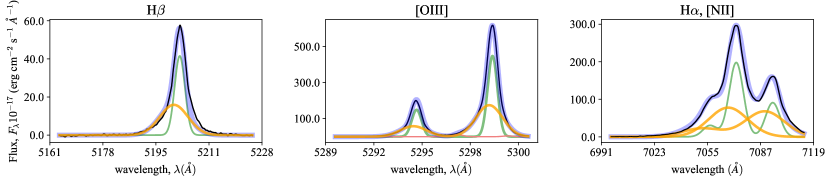
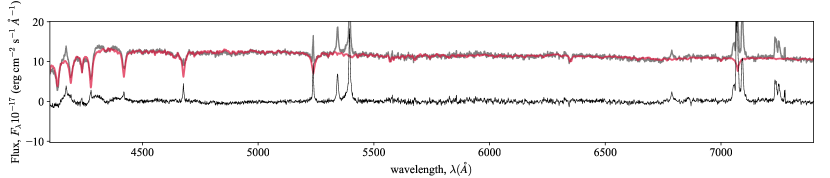
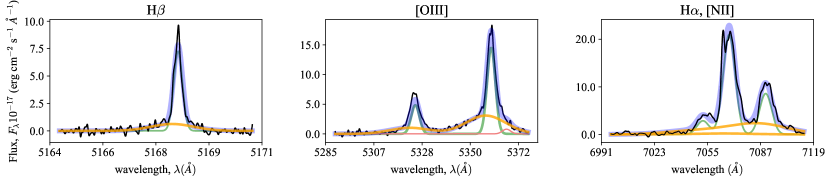
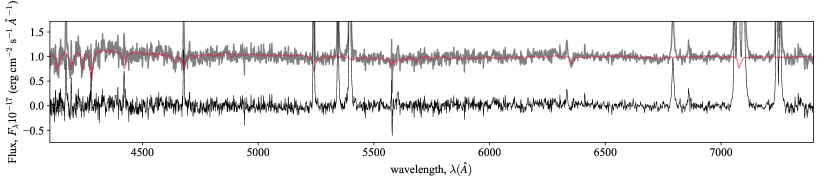
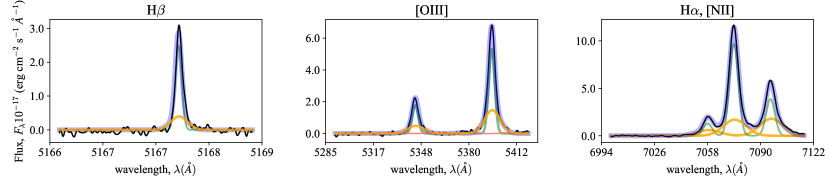
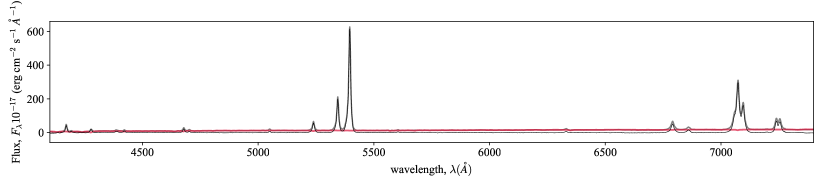
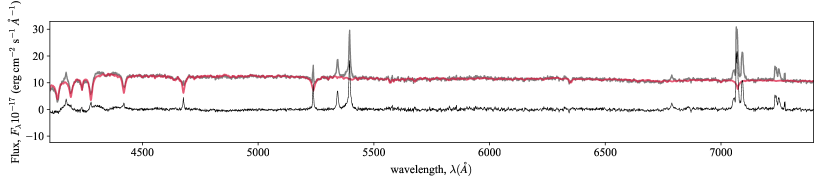
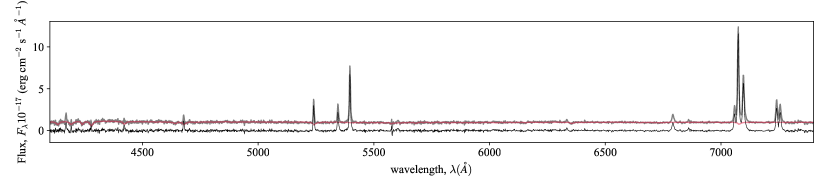
In order to measure accurate line fluxes, it is necessary to account for stellar absorption, which primarily affects the Balmer lines. The Penalized Pixel-Fitting method (pPXF; Cappellari, 2017) is an algorithm developed to extract stellar kinematics using a maximum penalized likelihood approach to match stellar spectral templates to absorption features in galaxy spectra. A large () number of stellar templates of various spectral type were chosen from the Indo-US Library of Coudé Feed Stellar Spectra (Valdes et al., 2004) in order to decrease the possibility of template mismatch. To ensure that the Balmer absorption is adequately constrained, we model the stellar population using the full spectrum (4000-7500Å) with pPXF. After subtracting the best-fitting stellar population model (red, see Figure 2)555See the Appendix for a figure illustrating the full dynamic range of the optical spectra. from the continuum, the residual emission lines were fit using Gaussian models. Broadened wing components, which can be indicative of high-velocity gas outflows, are present in narrow lines of all three objects, and thus an additional Gaussian component is added (see Figure 2 for examples of emission line decompositions). The presence of Fe emission can also affect measurements of the stellar population and [O III]4959,5007 doublet, and therefore we include the Fe II template from Véron-Cetty et al. (2004) and Fe I lines from the NIST Atomic Spectra Database in our fits. Fitting was performed using a custom maximum-likelihood routine implemented in Python, which uses the affine-invariant MCMC ensemble sampler emcee (Foreman-Mackey et al., 2013). Line fluxes are determined from the best-fit Gaussian models of the emission lines. Stellar-velocity dispersions were fit using a similar method described, except we fit the region from 4400-5800Å, which includes the Mg Ib region used to estimate stellar velocity dispersion. The [OIII] doublet is best fit by a combination of two Gaussian components. The line widths from the [OIII] doublet fit are then used to constrain the widths of the rest of the emission lines (Rodríguez Zaurín et al., 2013), so careful modeling of their profiles is necessary. The fitting routine can actually overestimate the flux and width of the broad component of the [OIII]5007 emission line due to contaminating flux from the Fe I 4985, 4986, 5016 emission lines. To address this contamination, we model the Fe lines with independent amplitudes and with widths equal to that of the narrow component of [OIII] (Manzano-King et al., 2019).
3 Results
3.1 Chandra/ACIS-S Imaging Results
We combined our 2016 observation with an archival 2013 observation (PI: X. Liu), and assessed source significance using the binomial no-source probability statistic (PB) (Lansbury et al., 2014) which is suitable for the low-count regime; we point the reader to Pfeifle et al. (2019) for further discussion. The Chandra source statistics are reported in Table 1. The Galaxy 1, 2, and 3 sources were detected with a statistical significance of 13.8 [log(P], 3.5 [log(P], and 2.9 [log(P], and based upon the derived PB values it is highly unlikely that these sources are the result of spurious background activity.666These significance values differ slightly from those reported in Pfeifle et al. (2019) due to the fact that here we quote the statistical significance derived from the combined Chandra statistics, whereas previously the statistical significance was derived from only the 2016 Chandra dataset. We used the ciao modelflux package to uniformly estimate the hard keV (rest frame) luminosities for the sources, assuming and correcting for only Galactic along the line of sight. Galaxies 1, 2 and 3 exhibit keV luminosities of erg s-1, erg s-1, erg s-1 respectively.
| Galaxy | Counts | Counts | Counts | HR | log | ||||
|---|---|---|---|---|---|---|---|---|---|
| ( cm-2) | keV | keV | keV | ||||||
| 1 | 3.80 | 8h49m05s.529 | +11∘14′47′′.876 | -0.14 | 13.8 | -371.6 | |||
| 2 | 3.80 | 8h49m05s.381 | +11∘14′45′′.747 | -0.76 | 3.5 | -17.3 | |||
| 3 | 3.80 | 8h49m05s.448 | +11∘14′51′′.646 | -0.84 | 2.9 | -12.0 |
| Camera | Counts | Counts | Counts | |||
|---|---|---|---|---|---|---|
| keV | keV | keV | ||||
| FPMA | 3.80 | 8h49m05s.510 | +11∘14′47′′.260 | |||
| FPMB | 3.80 | 8h49m05s.510 | +11∘14′47′′.260 |
3.2 Chandra/ACIS-S and NuSTAR Spectral Analysis Results
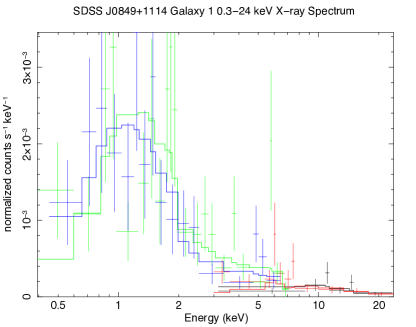
Simultaneously fitting the Chandra and NuSTAR data for Galaxy 1 (see Figure 3), we find an absorbing column of log(/cm-2) , photon index , and a scattered fraction %.777NC = Not constrained Correcting for the intrinsic absorption, we find an unabsorbed keV luminosity of erg s-1. We also report the NuSTAR source statistics in Table 2. To measure the equivalent width of the Fe K line, we repeated the fitting process with the phenomenological model from Pfeifle et al. (2019), which includes a Gaussian emission line component to account for the iron line fluorescent emission. Due to the S/N of our X-ray data, we conservatively quote here only an upper limit for the Fe K emission. We find an equivalent width upper limit of keV for the Fe K line, which is consistent with the high absorbing column along the line of sight (Brightman & Nandra, 2011).
While we do find different values for the spectral parameters here than those reported in Pfeifle et al. (2019), this is not entirely surprising; in this manuscript we are fitting both sets of Chandra and NuSTAR observations simultaneously, and it is well known that NuSTAR observations aid significantly in constraining the values for spectral parameters such as the photon index, , and the equivalent width of the Fe K line (Marchesi et al., 2018), in some cases leading to refined values significantly different than those found with data in the keV energy range.
As we discussed above in Section 2.2, it is not possible to constrain whether the two remaining AGNs are Compton-thick, and it is still possible they contribute appreciably to the observed hard X-ray flux since they would fall within the NuSTAR extraction aperture. In any case, this does not affect our X-ray spectral fitting results; the results are consistent with the picture of mergers hosting obscured AGNs, as found by previous studies (Kocevski et al., 2015; Ricci et al., 2017, 2016; Lanzuisi et al., 2018; Goulding et al., 2018; Donley et al., 2018; Koss et al., 2018).
3.3 LBT Spectroscopic Results
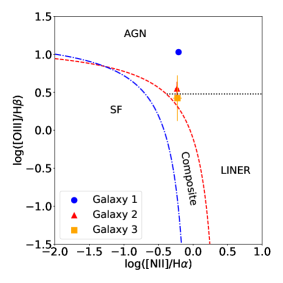
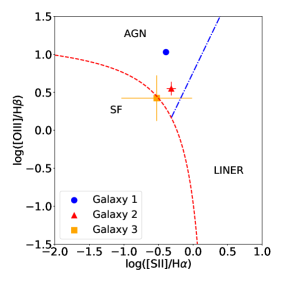
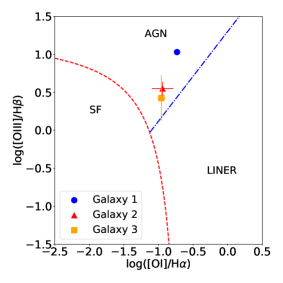
To determine the nature of the photoionizing sources observed in the LBT optical spectroscopy, we employ "Baldwin, Phillips, & Terlevich" (BPT) optical spectroscopic diagnostic diagrams, shown in Figure 4. The optical emission in each nucleus is consistent with AGN photoionization, complementing the X-ray and near-IR observations discussed above, and is consistent with the presence of a triple AGN in this merger. We list the logarithmic emission line ratios in Table 3.
Following the procedure outlined in Section 2.5, we derived stellar and gas velocity dispersions for each nucleus, which we report in Table 3. Gas velocity dispersions were measured from the narrow component of the [OIII] emission line while the stellar velocity dispersions were measured by fitting the Mg Ib region in the spectral range Å. We find very similar values for the stellar and gas velocity dispersions within each respective nucleus (see Columns in Table 3), but these values differ between the three nuclei; these similarities further suggest that each of the three regions are more-or-less dynamically independent — that is, the gas and stellar components are well-coupled — especially for Galaxies 1 and 3.888We caution the reader that the interpretation of velocity dispersions is highly uncertain in merging systems (Stickley & Canalizo, 2014). We list these dispersions here simply to support the scenario of three kinematically distinct nuclei.
We observe strong blue-wing components [OIII]5007 emission lines in Galaxy 1 and 2 with FWHMs on the order of km s-1, which is suggestive of strong galactic-scale outflows (Heckman et al., 1981; Nelson & Whittle, 1996; Woo et al., 2016). Galaxy 3 shows a slightly redshifted wing in the [OIII]5007 emission, with a FWHM on the order of km s-1. Many of the lower ionization emission lines show broad-wing components as well.
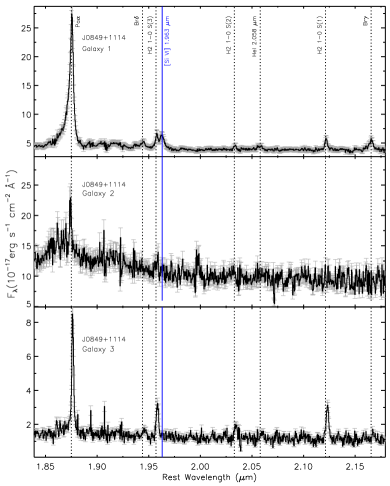
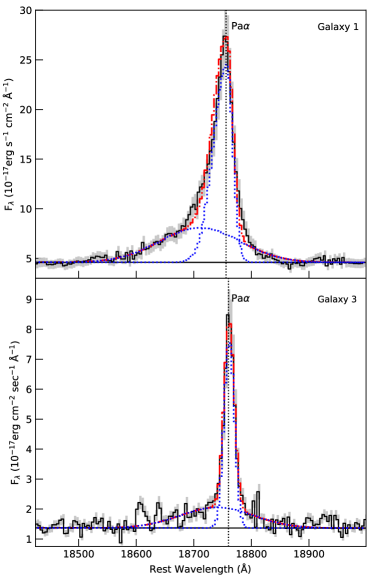
The LBT near-IR spectra revealed high excitation [SiVI] (Pfeifle et al., 2019) coronal line emission () in the nucleus of Galaxy 1, providing robust confirmation for the AGN in that nucleus (see Figure 5). Moreover, the near-infrared spectra of Galaxy 1 and Galaxy 3 reveal broad components (FWHM km s-1) in the Pa emission (see Figure 6), significantly in excess of the blue-shifted components observed in the [OIII] emission. These detections offer additional evidence for the existence of black hole accretion in these galaxies. We point out that this accretion activity is likely missed in the optical due to large obscuring columns along the line of sight. An exhaustive analysis of the possible outflows observed in the optical spectra is, however, beyond the scope of this paper, but will be featured in a future publication focusing on the environmental impacts of AGNs in mergers.
| Galaxy | log([OIII]5006/H) | log([NII]/H) | log([SII]6717,6733/H) | log([OI]6302/H) | ||
|---|---|---|---|---|---|---|
| km s-1 | km s-1 | |||||
| 1 | ||||||
| 2 | ||||||
| 3 |
4 Discussion and Implications
While our multiwavelength observations point to each nucleus hosting an AGN, we considered alternative scenarios which might explain the observed characteristics of this system.
In order to rule out star formation as an alternative explanation for the observed X-ray emission, we calculated star formation rates (SFRs) and possible X-ray contributions from a population of X-ray binaries using the Pa emission observed in the LBT near-IR spectra. We refer the reader to Satyapal et al. (2017) and Pfeifle et al. (2019) for a discussion of the SFR and XRB contribution calculations. With this calculation, we estimate an upper limit for the star formation activity in the merger nuclei; in reality, since the nuclei all exhibit BPT AGN-like optical spectroscopic line ratios, some fraction of the Pa emission is in fact attributable to the AGNs and therefore the true star formation rate, and hence stellar contribution to the X-rays, is much lower.
We obtained SFRs of 13.16 M⊙ yr-1, 0.48 M⊙ yr-1, and 1.79 M⊙ yr-1 and predicted hard keV X-ray luminosities of erg s-1, erg s-1, and erg s-1 for Galaxy 1, 2, and 3, respectively. Contrasting these values with the observed X-ray emission (uncorrected for intrinsic absorption) in Galaxy 1, 2, and 3 (see Section 3.1), there is a clear order of magnitude disparity between the observed and predicted values, strongly suggestive of three AGNs. Once again we note that in reality — due to the expected contributions from the AGNs to the Pa flux — we are likely overestimating the X-ray contributions from SF. Moreover, we are underestimating the observed X-ray fluxes of the three sources as the quoted luminosities are not corrected for absorption; as indicated by our joint NuSTAR-Chandra spectral fitting results, any absorption corrections made to the observed X-ray luminosities are expected to be large.
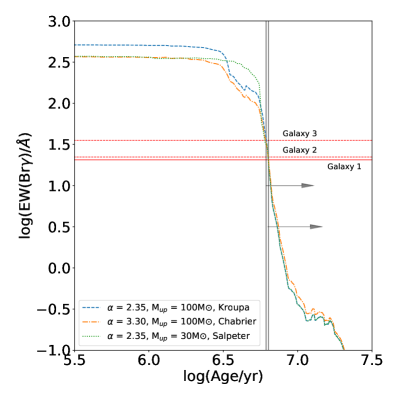
While we have confirmed the AGN in Galaxy 1 via the detection of near-IR coronal lines, Galaxy 2 and 3 require closer examination. If the SFR within Galaxy 2 and 3 were indeed 30 M⊙ yr-1 and 9 M⊙ yr-1, respectively — a requirement to explain the observed X-ray emission — the optical spectra should be dominated by a very young (10 Myr) and blue stellar population, when the population of high mass X-ray binaries (HMXBs) is expected to be high (von der Linden et al., 2010). The most luminous source of X-ray emission in galaxies arises from HMXBs.999Ultraluminous X-ray Sources (ULXs) can be more luminous than HMXBs, however the vast majority of these objects exhibit unabsorbed keV luminosities between erg s-1 (Sutton et al., 2012), which fall below the absorbed luminosities of the sources presented here. Additionally, ULXs are not generally associated with mid-infrared AGN colors (Secrest et al., 2015). Our near-infrared spectra allow us to also test this hypothesis by constraining the ages of the nuclear stellar populations. Specifically, the equivalent width of hydrogen recombination lines show a steep decline as the most massive stars evolve off the main sequence, causing a simultaneous decrease in the ionizing photon flux and an increase in the K-band continuum flux (Leitherer et al., 1999). However, the equivalent width of the Br- line (or upper limit in the case of Galaxy 2 and 3), a strong indicator of the starburst age (Leitherer et al., 1999, 2014), suggests that the stellar population in all three galaxies is greater than 6 million years (Figure 7), well after the time when the population of HMXBs is expected to drop dramatically (von der Linden et al., 2010).
We also considered the possibility that the optical emission lines are produced by ionizing shocks powered by starburst driven winds or tidal flows (Veilleux et al., 2002; Colina et al., 2005). Shocks are known to arise in mergers and become an increasingly important component of the optical emission lines as a merger progresses (Rich et al., 2011), generating [OIII]/H and [NII]/H ratios consistent with AGN when in fact only star formation is present (Allen et al., 2008). However, shock models have shown that when there is a significant contribution from shocks to the ionization, it often results in enhanced [OI]/H and [SII]/H emission line ratios compared to AGN photoionization models (Dopita & Sutherland, 1995; Allen et al., 2008), which is not seen in any of the three nuclei. Furthermore, detection of three X-ray point sources coincident with the nuclei supports an AGN origin rather than the result of shock-heated gas.
Finally, we explored the possibility that there are less than three distinct sources of ionization (one located at each galactic nucleus). In particular, given the [OIII] luminosities of each nucleus, the typical narrow line region (NLR) size is expected to be comparable to the nuclear pair separations between Galaxy 1 and Galaxy 2 (Bennert et al., 2006; Hainline et al., 2013, 2014), raising the possibility that only one AGN is ionizing the gas at both locations. However the detection of three separate luminous X-ray sources at the location of each nucleus makes this scenario unlikely. Further, the velocity offset of the [OIII] lines between the two nuclei is consistent with the velocity offset measured for the H lines, suggesting a lack of ionization stratification (Zamanov et al., 2002) expected for a single AGN, and therefore also favoring a scenario in which there are two independent sources of ionization. Moreover, each galaxy has unique, well-coupled gas and stellar velocity dispersions, suggesting three kinematically distinct sources consistent with galaxy nuclei.
We note that SDSS J0849+1114 was targeted for multiwavelength follow-up as a result of mid-infrared color preselection (Satyapal et al., 2014, 2017; Pfeifle et al., 2019). While optical preselection strategies (Comerford et al., 2015; Liu et al., 2011) are extensively used in campaigns to identify dual AGNs, these strategies have yielded very few confirmed cases. In fact, very few late stage galaxy mergers are known to host dual AGNs (see Table 8 from Satyapal et al. 2017), most of which have been discovered serendipitously or through hard X-ray surveys (Koss et al., 2012). While there have been a couple of triplet quasars reported in the literature (Djorgovski et al., 2007; Farina et al., 2013), they are at much larger separations and it is unclear if they are hosted in mergers. A few candidate triple AGNs in mergers have been reported (Koss et al., 2012; Liu et al., 2011; Kalfountzou et al., 2017) but thus far there have been no cases exhibiting triple X-ray point sources and optical narrow line signatures consistent with AGNs. Emission from the nuclei of advanced mergers at these pair separations are expected to be highly absorbed (e.g. Kocevski et al., 2015; Ricci et al., 2017; Blecha et al., 2018), making it difficult to identify dual AGNs using traditional techniques. While it is true that SDSS J0849+1114 exhibits optical signatures of AGNs in each nucleus, it is unlikely that all triple AGNs will exhibit such optical spectroscopic signatures. In contrast, mid-infrared preselection has proven an effective strategy in finding dual AGNs and now a triple AGN candidate in follow-up multiwavelength studies (Satyapal et al., 2017; Ellison et al., 2017; Pfeifle et al., 2019), suggesting that similar cases to SDSS J0849+1114 can be found in future studies.
5 Conclusion
In this investigation, we employed a suite of multiwavelength diagnostics which yield a compelling case for the existence of an AGN triplet in the triple galaxy merger SDSS J0849+1114. This merger, preselected in our dual AGN campaign for follow-up observations based on its WISE mid-infrared colors, was only later realized as a triple AGN candidate (Pfeifle et al., 2019). The nature of SDSS J0849+1114 can be summarized as follows:
-
1.
Chandra revealed three nuclear X-ray point sources which exhibit luminosities in excess of any expected contributions from stellar activity.
-
2.
High excitation [SiVI] coronal line emission was detected in the nucleus of Galaxy 1 via the near-infrared longslit spectra obtained with the LBT. We also find evidence for broad components in the near-IR Pa emission of Galaxy 1 and 3, with significantly greater widths than those observed in the broad components of the optical [OIII] emission.
-
3.
New longslit optical spectroscopic measurements shown for the first time here for Galaxy 1 and Galaxy 2, along with the archival SDSS spectrum for Galaxy 3, reveal optical spectroscopic emission line ratios consistent with AGN photoionization in all three nuclei.
-
4.
Simultaneous spectral fitting of the Chandra and new NuSTAR observations confirms at least one of the nuclei (Galaxy 1) hosts a heavily absorbed AGN and we further refine our previously reported spectral parameters: log(/cm-2) , photon index , scattered fraction %, and Fe K equivalent width upper limit of keV. We find an unabsorbed keV luminosity of erg s-1.
-
5.
Based upon our multiwavelength diagnostics, alternative scenarios — such as star formation activity, shock-driven emission, or photoionization by fewer than three AGNs — cannot effectively explain our observations.
Follow-up radio observations of SDSS J0849+1114 obtained with Very Long Baseline Interferometry (VLBI) are presented in Gabanyi et al., (in preparation).
The presence of triple AGNs in hierarchical galaxy mergers is a natural consequence of CDM predictions. Since late stage mergers are predicted to be highly obscured (Hopkins et al., 2008; Blecha et al., 2018), the apparent dearth of dual and triple AGNs may in fact be due to the pre-selection strategy adopted to find them. With the serendipitous identification of one compelling case for a triple AGN originally selected using our WISE preselection strategy, the natural next step is to extend our study to identify further cases of triple AGNs using mid-infrared color selection. In a forthcoming investigation, we hope to examine a sample of WISE selected () triple mergers in a systematic search for triple AGNs using an arsenal of optical, near-infrared, and X-ray diagnostics.
References
- Allen et al. (2008) Allen, M. G., Groves, B. A., Dopita, M. A., Sutherland, R. S., & Kewley, L. J. 2008, The Astrophysical Journal Supplement Series, 178, 20
- Amaro-Seoane et al. (2017) Amaro-Seoane, P., Audley, H., Babak, S., et al. 2017, arXiv e-prints, arXiv:1702.00786 [astro-ph.IM]
- Arnaud (1996) Arnaud, K. A. 1996, in Astronomical Society of the Pacific Conference Series, Vol. 101, Astronomical Data Analysis Software and Systems V, ed. G. H. Jacoby & J. Barnes, 17
- Baloković et al. (2018) Baloković, M., Brightman, M., Harrison, F. A., et al. 2018, ApJ, 854, 42
- Barnes & Hernquist (1992) Barnes, J. E., & Hernquist, L. 1992, ARA&A, 30, 705
- Bennert et al. (2006) Bennert, N., Jungwiert, B., Komossa, S., Haas, M., & Chini, R. 2006, New Astronomy Reviews, 50, 708
- Blecha et al. (2018) Blecha, L., Snyder, G. F., Satyapal, S., & Ellison, S. L. 2018, ArXiv e-prints, arXiv:1711.02094
- Bonetti et al. (2018) Bonetti, M., Perego, A., Capelo, P. R., Dotti, M., & Miller, M. C. 2018, PASA, 35, e017
- Bonetti et al. (2019) Bonetti, M., Sesana, A., Haardt, F., Barausse, E., & Colpi, M. 2019, MNRAS, 877
- Brightman & Nandra (2011) Brightman, M., & Nandra, K. 2011, MNRAS, 413, 1206
- Cappellari (2017) Cappellari, M. 2017, MNRAS, 466, 798
- Cash (1979) Cash, W. 1979, ApJ, 228, 939
- Colina et al. (2005) Colina, L., Arribas, S., & Monreal-Ibero, A. 2005, ApJ, 621, 725
- Comerford et al. (2015) Comerford, J. M., Pooley, D., Barrows, R. S., et al. 2015, ApJ, 806, 219
- Deane et al. (2014) Deane, R. P., Paragi, Z., Jarvis, M. J., et al. 2014, Nature, 511, 57
- Djorgovski et al. (2007) Djorgovski, S. G., Courbin, F., Meylan, G., et al. 2007, ApJ, 662, L1
- Donley et al. (2018) Donley, J. L., Kartaltepe, J., Kocevski, D., et al. 2018, ApJ, 853, 63
- Dopita & Sutherland (1995) Dopita, M. A., & Sutherland, R. S. 1995, ApJ, 455, 468
- Ellison et al. (2017) Ellison, S. L., Secrest, N. J., Mendel, J. T., Satyapal, S., & Simard, L. 2017, MNRAS, 470, L49
- Ellison et al. (2019) Ellison, S. L., Viswanathan, A., Patton, D. R., et al. 2019, MNRAS, 487, 2491
- Farina et al. (2013) Farina, E. P., Montuori, C., Decarli, R., & Fumagalli, M. 2013, MNRAS, 431, 1019
- Foreman-Mackey et al. (2013) Foreman-Mackey, D., Hogg, D. W., Lang, D., & Goodman, J. 2013, PASP, 125, 306
- Goulding et al. (2018) Goulding, A. D., Greene, J. E., Bezanson, R., et al. 2018, PASJ, 70, S37
- Hainline et al. (2014) Hainline, K., Hickox, R. C., Greene, J. E., et al. 2014, in American Astronomical Society Meeting Abstracts, Vol. 223, American Astronomical Society Meeting Abstracts #223, 126.04
- Hainline et al. (2013) Hainline, K. N., Hickox, R., Greene, J. E., Myers, A. D., & Zakamska, N. L. 2013, ApJ, 774, 145
- Heckman et al. (1981) Heckman, T. M., Miley, G. K., van Breugel, W. J. M., & Butcher, H. R. 1981, ApJ, 247, 403
- Hibbard & van Gorkom (1996) Hibbard, J. E., & van Gorkom, J. H. 1996, AJ, 111, 655
- Ho et al. (1997) Ho, L. C., Filippenko, A. V., & Sargent, W. L. W. 1997, The Astrophysical Journal Supplement Series, 112, 315
- Hoffman & Loeb (2007) Hoffman, L., & Loeb, A. 2007, MNRAS, 377, 957
- Hopkins et al. (2008) Hopkins, P. F., Cox, T. J., Kereš, D., & Hernquist, L. 2008, ApJS, 175, 390
- Kalfountzou et al. (2017) Kalfountzou, E., Santos Lleo, M., & Trichas, M. 2017, ApJ, 851, L15
- Kauffmann et al. (2003) Kauffmann, G., Heckman, T. M., Tremonti, C., et al. 2003, MNRAS, 346, 1055
- Kelley et al. (2017) Kelley, L. Z., Blecha, L., Hernquist, L., Sesana, A., & Taylor, S. R. 2017, MNRAS, 471, 4508
- Kewley et al. (2001) Kewley, L. J., Dopita, M. A., Sutherland, R. S., Heisler, C. A., & Trevena, J. 2001, ApJ, 556, 121
- Kewley et al. (2006) Kewley, L. J., Groves, B., Kauffmann, G., & Heckman, T. 2006, MNRAS, 372, 961
- Kocevski et al. (2015) Kocevski, D. D., Brightman, M., Nandra, K., et al. 2015, ApJ, 814, 104
- Koss et al. (2012) Koss, M., Mushotzky, R., Treister, E., et al. 2012, ApJ, 746, L22
- Koss et al. (2018) Koss, M. J., Blecha, L., Bernhard, P., et al. 2018, Nature, 563, 214
- Lansbury et al. (2014) Lansbury, G. B., Alexander, D. M., Del Moro, A., et al. 2014, ApJ, 785, 17
- Lanzuisi et al. (2018) Lanzuisi, G., Civano, F., Marchesi, S., et al. 2018, MNRAS, 480, 2578
- Leitherer et al. (2014) Leitherer, C., Ekström, S., Meynet, G., et al. 2014, The Astrophysical Journal Supplement Series, 212, 14
- Leitherer et al. (1999) Leitherer, C., Schaerer, D., Goldader, J. D., et al. 1999, ApJS, 123, 3
- Liu et al. (2011) Liu, X., Shen, Y., Strauss, M. A., & Hao, L. 2011, The Astrophysical Journal, 737, 101
- Manzano-King et al. (2019) Manzano-King, C., Canalizo, G., & Sales, L. 2019, arXiv e-prints, arXiv:1905.09287
- Marchesi et al. (2018) Marchesi, S., Ajello, M., Marcotulli, L., et al. 2018, ApJ, 854, 49
- Mihos & Hernquist (1996) Mihos, J. C., & Hernquist, L. 1996, ApJ, 464, 641
- Mingarelli et al. (2017) Mingarelli, C. M. F., Lazio, T. J. W., Sesana, A., et al. 2017, Nature Astronomy, 1, 886
- Nelson & Whittle (1996) Nelson, C. H., & Whittle, M. 1996, ApJ, 465, 96
- Pfeifle et al. (2019) Pfeifle, R. W., Satyapal, S., Secrest, N. J., et al. 2019, ApJ, 875, 117
- Ricci et al. (2016) Ricci, C., Bauer, F. E., Treister, E., et al. 2016, ApJ, 819, 4
- Ricci et al. (2017) —. 2017, MNRAS, 468, 1273
- Rich et al. (2011) Rich, J. A., Kewley, L. J., & Dopita, M. A. 2011, ApJ, 734, 87
- Robitaille & Bressert (2012) Robitaille, T., & Bressert, E. 2012, APLpy: Astronomical Plotting Library in Python, Astrophysics Source Code Library, ascl:1208.017
- Rodríguez Zaurín et al. (2013) Rodríguez Zaurín, J., Tadhunter, C. N., Rose, M., & Holt, J. 2013, MNRAS, 432, 138
- Rothberg & Joseph (2004) Rothberg, B., & Joseph, R. D. 2004, AJ, 128, 2098
- Ryu et al. (2018) Ryu, T., Perna, R., Haiman, Z., Ostriker, J. P., & Stone, N. C. 2018, MNRAS, 473, 3410
- Satyapal et al. (2014) Satyapal, S., Ellison, S. L., McAlpine, W., et al. 2014, MNRAS, 441, 1297
- Satyapal et al. (2017) Satyapal, S., Secrest, N. J., Ricci, C., et al. 2017, ApJ, 848, 126
- Schawinski et al. (2012) Schawinski, K., Simmons, B. D., Urry, C. M., Treister, E., & Glikman, E. 2012, MNRAS, 425, L61
- Schweizer (1982) Schweizer, F. 1982, ApJ, 252, 455
- Schweizer (1996) —. 1996, AJ, 111, 109
- Secrest et al. (2015) Secrest, N. J., Satyapal, S., Gliozzi, M., et al. 2015, ApJ, 798, 38
- Sesana et al. (2004) Sesana, A., Haardt, F., Madau, P., & Volonteri, M. 2004, ApJ, 611, 623
- Stern et al. (2012) Stern, D., Assef, R. J., Benford, D. J., et al. 2012, ApJ, 753, 30
- Stickley & Canalizo (2014) Stickley, N. R., & Canalizo, G. 2014, ApJ, 786, 12
- Sutton et al. (2012) Sutton, A. D., Roberts, T. P., Walton, D. J., Gladstone, J. C., & Scott, A. E. 2012, MNRAS, 423, 1154
- Taylor (2005) Taylor, M. B. 2005, in Astronomical Society of the Pacific Conference Series, Vol. 347, Astronomical Data Analysis Software and Systems XIV, ed. P. Shopbell, M. Britton, & R. Ebert, 29
- The Astropy Collaboration et al. (2018) The Astropy Collaboration, Price-Whelan, A. M., Sipőcz, B. M., et al. 2018, ArXiv e-prints, arXiv:1801.02634 [astro-ph.IM]
- Toomre & Toomre (1972) Toomre, A., & Toomre, J. 1972, ApJ, 178, 623
- Vacca et al. (2003) Vacca, W. D., Cushing, M. C., & Rayner, J. T. 2003, Publications of the Astronomical Society of the Pacific, 115, 389
- Valdes et al. (2004) Valdes, F., Gupta, R., Rose, J. A., Singh, H. P., & Bell, D. J. 2004, The Astrophysical Journal Supplement Series, 152, 251
- Veilleux et al. (2002) Veilleux, S., Cecil, G., Bland-Hawthorn, J., & Shopbell, P. L. 2002, in Revista Mexicana de Astronomia y Astrofisica Conference Series, Vol. 13, Revista Mexicana de Astronomia y Astrofisica Conference Series, ed. W. J. Henney, W. Steffen, L. Binette, & A. Raga, 222
- Verbiest et al. (2016) Verbiest, J. P. W., Lentati, L., Hobbs, G., et al. 2016, MNRAS, 458, 1267
- Véron-Cetty et al. (2004) Véron-Cetty, M. P., Joly, M., & Véron, P. 2004, A&A, 417, 515
- von der Linden et al. (2010) von der Linden, A., Wild, V., Kauffmann, G., White, S. D. M., & Weinmann, S. 2010, MNRAS, 404, 1231
- Weston et al. (2017) Weston, M. E., McIntosh, D. H., Brodwin, M., et al. 2017, MNRAS, 464, 3882
- Woo et al. (2016) Woo, J.-H., Bae, H.-J., Son, D., & Karouzos, M. 2016, ApJ, 817, 108
- Wright (2006) Wright, E. L. 2006, PASP, 118, 1711
- Wrobel et al. (2014) Wrobel, J. M., Walker, R. C., & Fu, H. 2014, ApJ, 792, L8
- Wyithe & Loeb (2003) Wyithe, J. S. B., & Loeb, A. 2003, ApJ, 590, 691
- Zamanov et al. (2002) Zamanov, R., Marziani, P., Sulentic, J. W., et al. 2002, ApJ, 576, L9