Unsupervised Representations of Pollen in Bright-Field Microscopy
Abstract
We present the first unsupervised deep learning method for pollen analysis using bright-field microscopy. Using a modest dataset of 650 images of pollen grains collected from honey, we achieve family level identification of pollen. We embed images of pollen grains into a low-dimensional latent space and compare Euclidean and Riemannian metrics on these spaces for clustering. We propose this system for automated analysis of pollen and other microscopic biological structures which have only small or unlabelled datasets available.
1 Introduction
Pollen is formed as the male gametes of all flowering plants. Palynology, the study of pollen (and spores), provides critical insights for a number of fields including forensic science, ecology and agriculture (Mildenhall, 2006; Blackmore, 2006; Zábrodská & Vorlová, 2014). For example, pollen grains on the personal affects of an individual can be used to ascertain whether they were at the scene of a crime (Mildenhall, 2006). However, traditional methods of pollen analysis such as microscopic analysis of morphology are time intensive and require trained specialists. As a result, pollen analysis remains mostly inaccessible for the majority of large scale applications. Making the analysis of pollen fast, scalable and accessible can therefore open the door to a great many opportunities hitherto unfeasible in both commercial and academic domains.
While automated methods of pollen analysis have been described in the literature as early as 2002 (Ronneberger et al., 2002) the methods have not been implemented as significant tools in research or industry. Early attempts were largely scanning electron microscopy (Ronneberger et al., 2002; Treloar et al., 2004) while later research used a wide variety of microscopy types including dark field (Lagerstrom et al., 2014; Pedersen et al., 2017), and fluorescence microscopy (Mitsumoto et al., 2009). All of these techniques require expensive equipment and most require relatively skilled operators.
The introduction of deep learning techniques for pollen analysis has shown much promise, however, have been plagued by a lack of a significant labelled dataset. In a recent publication, a supervised deep learning algorithm was used to segment and then analyse pollen in honey samples (He et al., 2018). However, the scope of this paper was limited by its requirement for the manual labelling of datasets. Here we provide the first example of the use of an unsupervised deep learning algorithm for the analysis of pollen using bright-field microscopy.
2 Methods
Unlike previous almost-entirely supervised approaches to pollen identification (which require large labelled datasets of pollen to train), we propose a new unsupervised pipeline (see Figure 1) for generating representations of pollen and learning groupings of morphologically (and thererby often taxonomically (Oswald et al., 2011)) similar pollen grains.
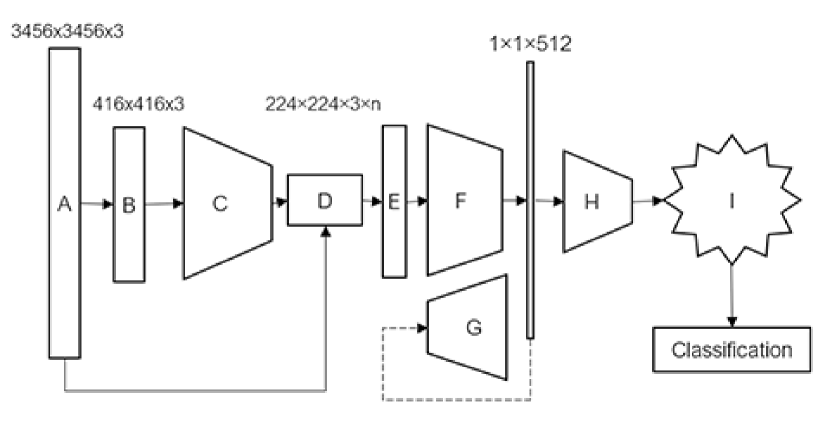
Given an input image of a microscope slide containing pollen, , we first apply downsampling such that . The downsampled is then passed through a YOLO-based (Redmon et al., 2016) object detection network from (He et al., 2018) to obtain a set of bounding boxes for pollen grains present on the slide containing indexed tuples giving the positions and dimensions of the th particular bounding box respectively. Each tuple in is then scaled up component-wise by a factor of 8 and recombined with the original image to obtain centered full-resolution crops of the pollen. Each passed through an encoder based on the VGG16 architecture from (Simonyan & Zisserman, 2014) pre-trained on ImageNet (Deng et al., 2009) with the final fully-connected layers replaced with a max-pooling layer resulting in a latent representation . We then further reduce the dimensionality of to and cluster the results using the k-means algorithm. In our experiments, we compare principal component analysis to the Isomap algorithm as dimensionality reduction methods as well as a Euclidean metric on to a Riemannian metric induced by the latent space. The Riemannian metric is approximated using a fixed-point algorithm described in (Yang et al., 2018) and reflects the curvature that arises from the non-linearity of the latent space which can be characterised as a Riemannian manifold (Arvanitidis et al., 2018).
In this way, we are able to generate representations of the pollen without requiring a large dataset of pollen to learn from. Furthermore, the clusters discovered can now be used for a number of new tasks including semi-supervised learning for pollen classification.
3 Experiments
Samples from a range of honeys (eucalpytus melliodora, acacia and manuka) were spread onto a microscope slide and immediately imaged. Images were taken once every 2 seconds on a Solomark compound microscope at 320x zoom. This generated a dataset of 650 unlabelled bright-field images of individual pollen.
3.1 Clustering
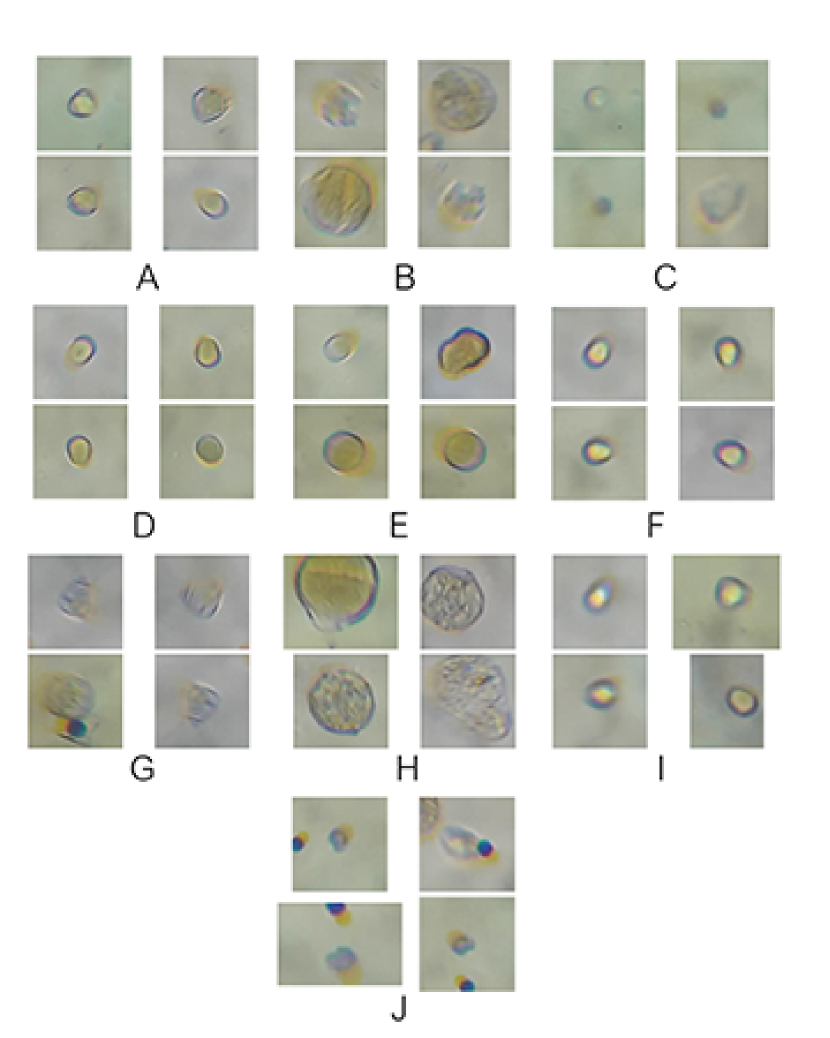
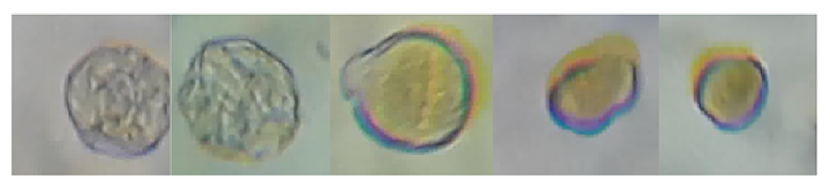
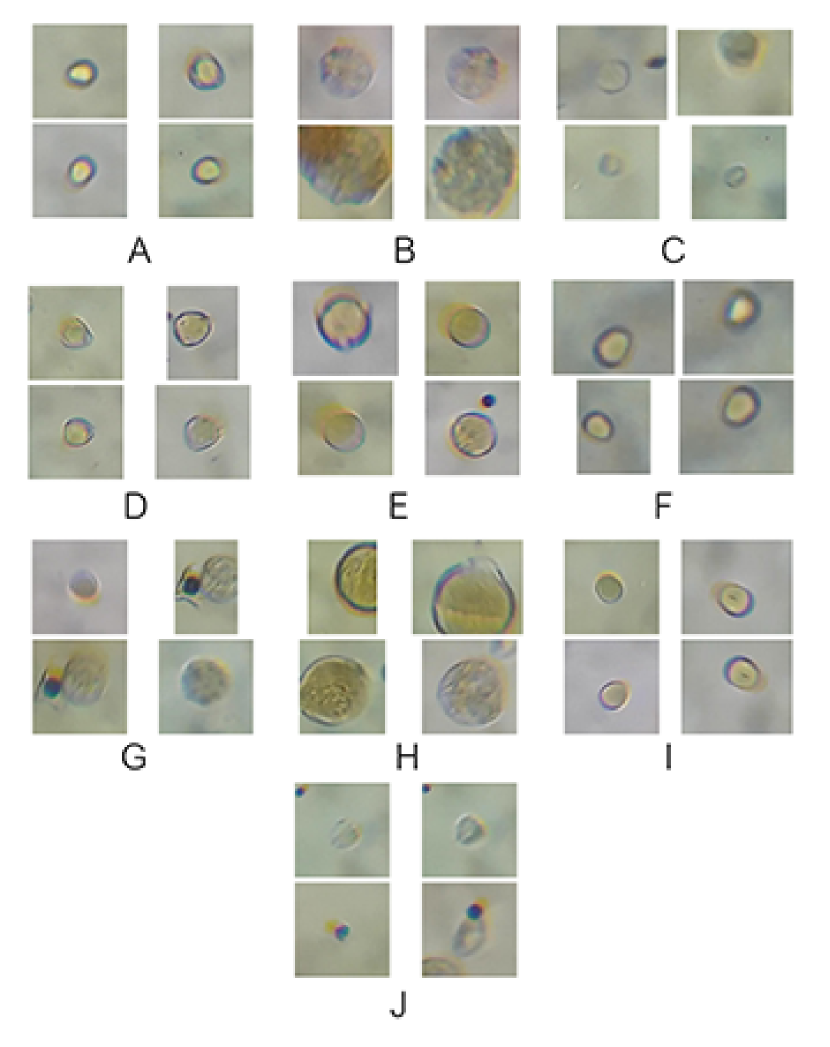
The system was run with parameters and for ease of visualisation. The value of was selected based on the ratio between decreases in cluster variance for adjacent values of . The system was in most cases able to differentiate pollen morphology on (at the minimum) a family level. For example, one cluster (see A in Figure 2) shows a strong resemblance to pollen from the Myrtaceae family (Sniderman et al., 2018).
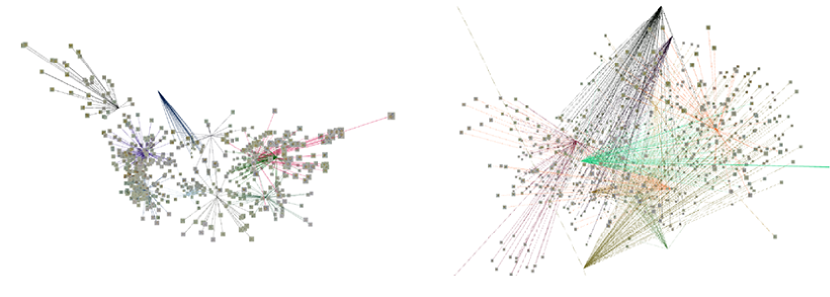
There are marked differences in the latent spaces generated by the two different dimensionality reduction methods. Qualitatively, clusters are far more clear in the spaces where Isomap was used (see Figure 4). Nonetheless, the embeddings in the PCA spaces were sensible (see Figure 3). The clusters were not too different in terms of overall concepts - the labels in Figure 5 are matched to potential ”conceptual counterparts” in Figure 2. There were, however, qualitatively fewer obviously incorrect cluster assignments from the Isomap-Riemannian space compared to the other spaces.
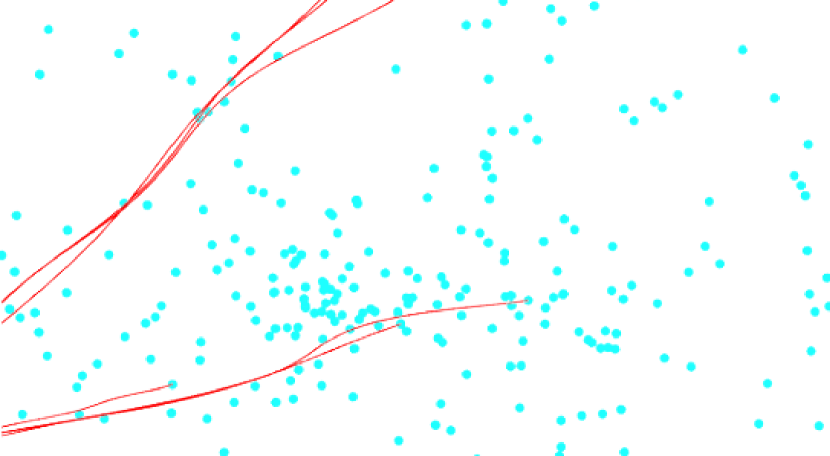
We further visualise the curvature of the latent spaces by sampling geodesics between random points on each manifold. The geodesics observed on the PCA manifolds are (unsurprisingly) effectively linear while some more interesting curvature can be observed on the Isomap manifold in Figure 6.
3.2 Comparison with Human-Defined Cluster Assignments
A set of 30 bright-field images were collected at 320x zoom using a combination of an AmScope bifocal microscope and a Solomark compound microscope. Non-specialist volunteers were instructed to categorise a random selection of these images into the already generated clusters given 4 randomly chosen images from each cluster (similar to Figure 2). The images were then reclassified by the system (using PCA and an Euclidean metric on ). Cases of agreement between the human and system was 63%. Calculating Cohen’s Kappa coefficient, we find moderate agreement (95% CI, 0.378 to 0.775).
4 Discussion
While previous research had used unsupervised methods to analyse pollen samples in grass (Mander et al., 2013) we used a sample size which was significantly larger and did so with less expensive tools, making our method more accessible. Additionally, we were able to utilize a significantly larger dataset and observe an entire pollen grain, as opposed to simply surface patterns. Moreover, agreement between humans and our system was relatively high at 63%. This implies that the clusters and assignments at large are to some extent human-interperatable. An important future benchmark would be comparison to human specialists who, with the help of reference material, are able to visually differentiate pollen at a species level with reasonable accuracy though such resolution is not necessary for many applications (Mildenhall, 2006).
While our system provides a new tool for working with small or unlabelled datasets, it has significant limitations. Primarily, the small sample size and poor quality of some images in our dataset limits the classification of pollen to the family level. A larger dataset and better equipment may be required to achieve genus and species level classification. Luckily, this should be relatively straightforward as no labels are needed. Alternatively, applying the same system used here on datasets generated using other microscopy types such as dark field or phase contrast microscopy could provide powerful new tools for rapid pollen analysis, though this would potentially not confer the same benefit with regards to accessibility.
Although the latent spaces observed in the experiments were relatively sensible, often with the obvious clusters visible, it is likely that the embeddings are sub-optimal due to the pre-training of the encoder on ImageNet. This is due to the fact that biological imagery at the micro-scale is visually very different to much of the contents of ImageNet. It would therefore perhaps be beneficial to representation to use an encoder trained instead on a large dataset of microscope imagery.
4.1 Applications
Beyond accelerating existing uses of pollen analysis, two socially beneficial applications of large-scale automated pollen analysis include combatting the proliferation of fraudulent honey and as well as ecological monitoring.
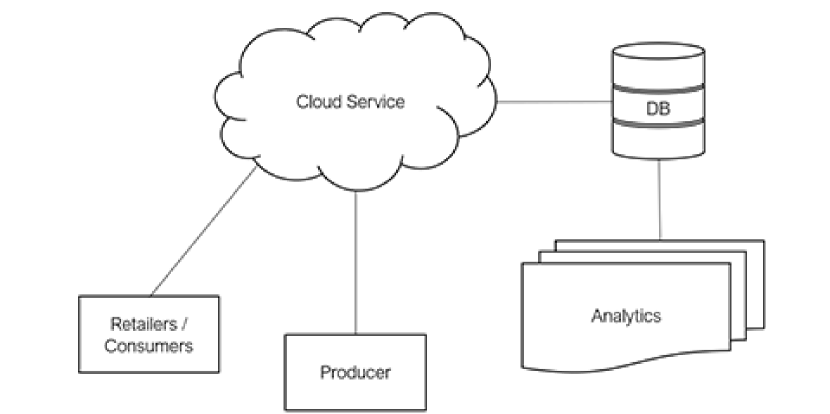
Fraudulent honey is a global issue and has seen honey become the third most faked food in worldwide (Moore et al., 2012). Honey fraud is most commonly carried out through mislabelling, dilution with cheaper honeys or sugar syrup and a host of unethical beekeeping practices such as over-harvesting. Existing authentication methods for honey have been inaccurate (such as sugar or chemical testing) or highly specialist and expensive (such as qPCR, LC-MS or manual inspection of the pollen in honey (Mcdonald et al., 2018; Kato et al., 2014; Sniderman et al., 2018)). For this use case, we describe a system whereby producers of honey may upload scans of their honey taken through low-cost bright-field microscopy apparatus to an online database. With such a database, consumers and retailers down the supply chain will be able to verify the origin or authenticity of their honey from its pollen profile without specialist knowledge. This will help combat the harmful effects of fake honey on both the ecosystem and local economies described elsewhere (F. Fairchild et al., 2000; Cairns et al., 2005). Furthermore, the system will have made up the cost of a microscope purchase within 3-4 jars of genuine manuka honey.
In addition, we propose honey as a means for the large-scale monitoring of flora biodiversity. Previous studies have used honey as a way of monitoring pollutants (Smith et al., 2019) and conducting analysis on pollen would allow for simultaneous generation of data on flora biodiversity. This would go hand-in-hand with the honey authentication system described above, using the pollen profile database as a source of spatio-temporally tagged samples. Two caveats, however, ought not be overlooked: firstly, that this application would require a small quantity of expertly labelled pollen data in order to associate pollen grains with their respective botanical sources in a semi-supervised fashion; and secondly, that honey bees have specific foraging habits which would need to be corrected for. Nevertheless, pollen obtained from other sources such as dedicated collection units can be equally analysed by the system. We present a potential architecture for how both proposed applications can co-exist in Figure 7.
Finally, the system could be used for the analysis of any unlabelled microscopy dataset in the environmental and life sciences. Soil fungi, for example, are considered to be an excellent indicator of soil fertility (Kranabetter et al., 2009). The use of the system for such applications could accelerate the development of prototypes and proofs-of-concept by removing the need for a large labelled dataset.
5 Conclusions
Despite its limitations, the system we have described forms the groundwork for a powerful, scalable and accessible tool for pollen analysis. The acquisition of a larger dataset and an application-specific encoder are needed to bring the system to a level of maturity which, once reached, will open doors to novel techniques for ecological monitoring, honey authentication and a variety of other use cases.
6 Acknowledgements
Many thanks to Stewart McGown at the University of St Andrews for assisting in the design and prototyping of the large-scale honey authentication system. We also acknowledge Raghvi Arya for her advice regarding the poster presentation at ICML.
References
- Arvanitidis et al. (2018) Arvanitidis, G., Hansen, L. K., and Hauberg, S. Latent space oddity: on the curvature of deep generative models. In ICLR, 2018.
- Blackmore (2006) Blackmore, S. Pollen and spores: Microscopic keys to understanding the earths biodiversity. Plant Systematics and Evolution, 263(1-2):3–12, 2006. doi: 10.1007/s00606-006-0464-3.
- Cairns et al. (2005) Cairns, C. E., Villanueva-Gutierrez, R., Koptur, S., and Bray, D. B. Bee populations, forest disturbance, and africanization in mexico1. Biotropica, 37(4):686–692, 2005. doi: 10.1111/j.1744-7429.2005.00087.x.
- Deng et al. (2009) Deng, J., Dong, W., Socher, R., Li, L.-J., Li, K., and Fei-Fei, L. Imagenet: A large-scale hierarchical image database. 2009 IEEE Conference on Computer Vision and Pattern Recognition, 2009. doi: 10.1109/cvpr.2009.5206848.
- F. Fairchild et al. (2000) F. Fairchild, G., Capps, O., , O., and Nichols, J. Impacts of economic adulteration on the u.s. honey industry. Western Agricultural Economics Association, 2000 Annual Meeting, June 29-July 1, 2000, Vancouver, British Columbia, 01 2000.
- He et al. (2018) He, P., Gkantiragas, A., and Glowacki, G. Honey authentication with machine learning augmented bright-field microscopy. arXiv.org, Dec 2018. URL https://arxiv.org/abs/1901.00516.
- Kato et al. (2014) Kato, Y., Fujinaka, R., Ishisaka, A., Nitta, Y., Kitamoto, N., and Takimoto, Y. Plausible authentication of manuka honey and related products by measuring leptosperin with methyl syringate. Journal of Agricultural and Food Chemistry, 62(27):6400–6407, 2014. doi: 10.1021/jf501475h. URL https://doi.org/10.1021/jf501475h. PMID: 24941263.
- Kranabetter et al. (2009) Kranabetter, J. M., Friesen, J., Gamiet, S., and Kroeger, P. Epigeous fruiting bodies of ectomycorrhizal fungi as indicators of soil fertility and associated nitrogen status of boreal forests. Mycorrhiza, 19(8):535–548, 2009. doi: 10.1007/s00572-009-0255-0.
- Lagerstrom et al. (2014) Lagerstrom, R., Holt, K., Arzhaeva, Y., Bischof, L., Haberle, S., Hopf, F., and Lovell, D. Pollen image classification using the classifynder system: Algorithm comparison and a case study on new zealand honey. Signal and Image Analysis for Biomedical and Life Sciences Advances in Experimental Medicine and Biology, pp. 207–226, 2014. doi: 10.1007/978-3-319-10984-8˙12.
- Mander et al. (2013) Mander, L., Li, M., Mio, W., Fowlkes, C. C., and Punyasena, S. W. Classification of grass pollen through the quantitative analysis of surface ornamentation and texture. Proceedings of the Royal Society B: Biological Sciences, 280(1770):20131905–20131905, 2013. doi: 10.1098/rspb.2013.1905.
- Mcdonald et al. (2018) Mcdonald, C. M., Keeling, S. E., Brewer, M. J., and Hathaway, S. C. Using chemical and dna marker analysis to authenticate a high-value food, manuka honey. npj Science of Food, 2(1), 2018. doi: 10.1038/s41538-018-0016-6.
- Mildenhall (2006) Mildenhall, D. Hypericum pollen determines the presence of burglars at the scene of a crime: An example of forensic palynology. Forensic Science International, 163(3):231–235, 2006. doi: 10.1016/j.forsciint.2005.11.028.
- Mitsumoto et al. (2009) Mitsumoto, K., Yabusaki, K., and Aoyagi, H. Classification of pollen species using autofluorescence image analysis. Journal of Bioscience and Bioengineering, 107(1):90–94, 2009. doi: 10.1016/j.jbiosc.2008.10.001.
- Moore et al. (2012) Moore, J. C., Spink, J., and Lipp, M. Development and application of a database of food ingredient fraud and economically motivated adulteration from 1980 to 2010. Journal of Food Science, 77(4), 2012. doi: 10.1111/j.1750-3841.2012.02657.x.
- Oswald et al. (2011) Oswald, W. W., Doughty, E. D., Neeman, G., Neeman, R., and Ellison, A. M. Pollen morphology and its relationship to taxonomy of the genus sarracenia (sarraceniaceae). Rhodora, 113(955):235–251, 2011. doi: 10.3119/0035-4902-113.955.235.
- Pedersen et al. (2017) Pedersen, B., Bailey, D. G., Hodgson, R. M., Holt, K., and Marsland, S. Model and feature selection for the classification of dark field pollen images using the classifynder system. 2017 International Conference on Image and Vision Computing New Zealand (IVCNZ), 2017. doi: 10.1109/ivcnz.2017.8402498.
- Redmon et al. (2016) Redmon, J., Divvala, S., Girshick, R., and Farhadi, A. You only look once: Unified, real-time object detection. In The IEEE Conference on Computer Vision and Pattern Recognition (CVPR), June 2016.
- Ronneberger et al. (2002) Ronneberger, O., Schultz, E., and Burkhardt, H. Automated pollen recognition using 3d volume images from fluorescence microscopy. Aerobiologia, 18(2):107–115, Jun 2002. doi: 10.1023/a:1020623724584.
- Simonyan & Zisserman (2014) Simonyan, K. and Zisserman, A. Very deep convolutional networks for large-scale image recognition. arXiv 1409.1556, 09 2014.
- Smith et al. (2019) Smith, K. E., Weis, D., Amini, M., Shiel, A. E., Lai, V. W.-M., and Gordon, K. Honey as a biomonitor for a changing world. Nature Sustainability, 2(3):223–232, 2019. doi: 10.1038/s41893-019-0243-0.
- Sniderman et al. (2018) Sniderman, J. M. K., Matley, K. A., Haberle, S. G., and Cantrill, D. J. Pollen analysis of australian honey. Plos One, 13(5), 2018. doi: 10.1371/journal.pone.0197545.
- Treloar et al. (2004) Treloar, W. J., Taylor, G. E., and Flenley, J. R. Towards automation of palynology 1: analysis of pollen shape and ornamentation using simple geometric measures, derived from scanning electron microscope images. Journal of Quaternary Science, 19(8):745–754, 2004. doi: 10.1002/jqs.871.
- Yang et al. (2018) Yang, T., Arvanitidis, G., Fu, D., Li, X., and Hauberg, S. Geodesic clustering in deep generative models. CoRR, abs/1809.04747, 2018.
- Zábrodská & Vorlová (2014) Zábrodská, B. and Vorlová, L. Adulteration of honey and available methods for detection – a review. Acta Veterinaria Brno, 83(10), 2014. doi: 10.2754/avb201483s10s85.