Excited states of the odd-odd nucleus 158Eu from the (d,) reaction
Abstract
Excited states in the 158Eu nucleus have been determined with the 160Gd(d,)158Eu reaction, studied at an incident energy of 18.0 MeV with the Munich tandem and Q3D spectrograph. More than 50 excited states have been determined up to 1.6 MeV excitation, some of them corresponding to states previously observed in the -decay of 158Sm. The number of levels found in this nucleus at low excitation energies follows the systematic trend of the level densities in the other isotopes with mass 152–156.
pacs:
PACS: 21.10.-k,21.10.Ma, 25.45.Hi, 27.70.+qI Introduction
The study of nuclear structure in rare earth nuclei with a multitude of nuclear reactions has been rather intensive especially in the region near the neutron number where the nuclear properties undergo a rapid change, pinpointing one of the best examples of quantum shape phase transition. While the even-even nuclei and odd-mass nuclei are relatively well studied, the odd-odd nuclei in this region are less investigated. One of the possible study tools, making use of the many available stable targets in this region, is the (d,) reaction. When performed on even-even targets, it leads to odd-odd nuclei, and the advantage is that the target has a ground-state, which facilitates the determination of the spin and parity of the states in the odd-odd nucleus. Rather surprisingly, this powerful tool was practically unused in the rare earth nuclei. With the exception of the reaction 152Sm(d,)150Pm [and of two other reactions used for its energy calibration, 140Ce(d,)138La and 142Nd(d,)140Pr], which was used to determine the level structure of the practically unknown 150Pm nucleus 150pm , this reaction was never performed on other targets in the rare-earth region.
We decided to use this reaction in order to determine the level structure of the 158Eu odd-odd nucleus. For this nucleus there are no adopted levels in the ENSDF database ENSDF , except for a ground state with a proposed spin-parity (1-) as expected from Nilsson configurations. The ENSDF evaluation mentions, however, determinations of excited levels of 158Eu in an unpublished study of this nucleus by the -decay of 158Sm, which were also used in a publication where an analysis of the total absorption -spectrum in the -decay was performed beta158Sm .
The study of the (d,) reaction on chains of even-even targets, such as that of Nd, Sm, Gd, and Dy nuclei, would be of considerable interest also because it may offer a systematic view of the structure evolution of the odd-odd nuclei, an aspect that will be exemplified at the end of this work.
II Experiment and results
The experiment was performed at the Munich tandem accelerator, using a deuteron beam of 18 MeV and a 0.5 A average intensity. The target was 125 g/cm2 Gd2O3 98.2 enriched in 160Gd on 10 g/cm2 Carbon foil. Its main impurities were 158Gd, 157Gd, and 156Gd, each less than 1. The reaction products were analyzed in the Q3D spectrograph Q3D and detected and identified in its focal plane detector, a multiwire proportional chamber with readout of a cathode with microstrip foil structure for particle identification and position determination focal .
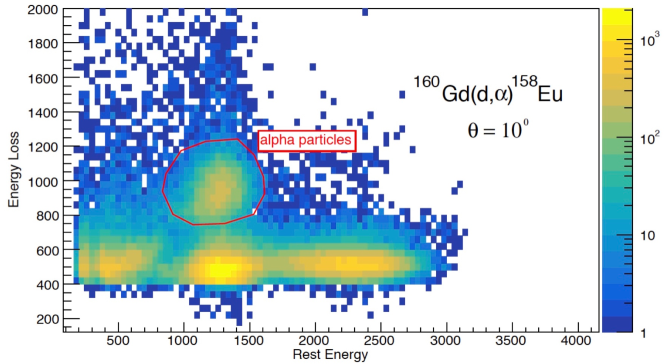
Spectra were recorded at an angle of 10∘ relative to the beam direction, with an acceptance of the spectrograph of 14.61 msr ( mm2). Figure 1 displays a plot for the reaction products that enter the focal plane detector, showing the good separation of the -particles. The other events from this plot very likely represent tritons, deuterons, and 3He (from left to right), although a sure identification is difficult due to the different reaction -values, extended range of energies of the emergent particles, the rather compressed scale of the rest energy axis, and the proximity to the threshold cutoff. With this identification of the ’s the spectra of the reaction were practically background-free. The beam current was integrated into a Faraday cup placed after the target in order to determine the cross sections.
Due to the small cross-sections of our reaction and the available beam intensity and measurement time, angular distributions could not be measured. We concentrated on the measurement at just one angle, of 10∘. Figure 2(a) shows the 10∘ spectrum measured during a total of 19 hours. The energy calibration of this spectrum has been achieved by measuring, in the same conditions, the spectrum of the 111Cd(d,)109Ag reaction, with a target of 150 g/cm2 thickness, for which peaks corresponding to well-known levels of 109Ag ensdf109Ag have been identified. This calibration spectrum is shown in Fig. 2(b).
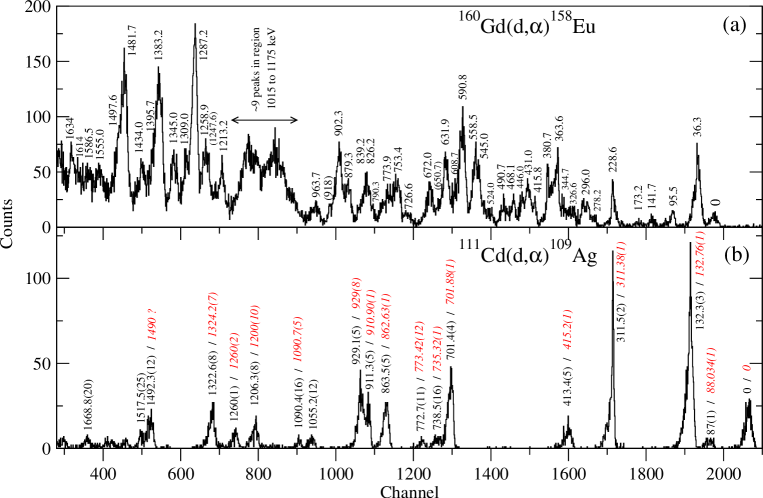
Both spectra in Fig. 2 have been processed with the GASPAN peak fitting program gaspan . The FWHM energy resolution was about 15 keV for the spectrum in Fig. 2(a) and 12 keV for that in Fig. 2(b), respectively. Peaks due to the target impurities were not visible in the spectrum of Fig. 2(a). For the calibration spectrum in Fig. 2(b), an energy calibration curve for the excitation energy in 109Ag versus channel number was generated as a second degree polynomial. From the peak energy labels in Fig. 2(b) one can see that this curve describes the excitation energies known with good precision ensdf109Ag with an accuracy of less than 1.5 keV. This calibration curve was then transformed, by kinematics calculations, in a new calibration curve versus channel number, where is the absolute energy of the -particles (of the order of 27 MeV). This second calibration curve was used for the spectrum in Fig. 2(a) in order to determine the absolute -particle energies of the peaks corresponding to states in 158Eu, which were then transformed into excitation energies by using kinematic calculations. This procedure was necessary in order to take into account the rather different recoil energies of the residual nuclei in the two reactions, due to the large mass difference between the target nuclei.
Q-value of the 160Gd(d,)158Eu reaction. A better determination of this quantity resulted as a byproduct of the energy calibration described above. The -value of the calibration reaction (on the 111Cd target) is rather well known, (111Cd) = 10178.01.3 keV, as given in the 2016 mass table mass2016 . For the reaction 160Gd(d,)158Eu the -value is given as (160Gd) = 1002410 keV mass2016 . By using the -value of the 111Cd target, our measurement of the energy of the peak corresponding to the ground state of 158Eu (Fig. 2(a)) provided a value of Q(d,α)(160Gd) = 10035.51.6 keV, which is consistent with the older value but more precise.
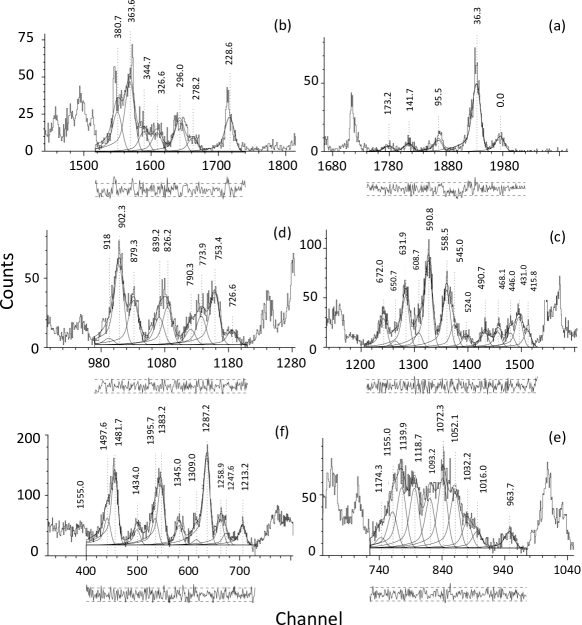
Excited states of the 158Eu nucleus. Table I shows the energy levels found for 158Eu in the present experiment, In both Table I and Fig. 2 the errors given for the energy values are the statistical errors, as resulted from the calibration curve and the errors in the peak centroids. As one can see from Fig. 2, the calibration curve (second degree polynomial) deduced from the reaction on the 111Cd target works well up to an excitation energy of 1.32 MeV, corresponding to an excitation energy in 158Eu of about 1.23 MeV. Beyond this excitation energy, up to the highest excited state determined (about 1.6 MeV) the energies given in the table are based on the extrapolation of the calibration curve. It is therefore expected that with increasing energy this procedure may provide increasing deviations from the (unknown) real energies, that are larger than the specified statistical error. Also, to better see the basis of the peak assignments, Fig. 3 shows details of the peak fitting with the GASPAN program. The peak shapes were fitted with a gaussian plus a left side (lower -particle energy) exponential tail which is due to the energy loss of the alpha particles in the thin target. A fixed tail fraction was chosen, which was found by eliminating the tendency to fit the peaks as doublets, and by a good description of the shape of strong, better separated peaks. Figure 3 shows six panels corresponding to fits in the six adjacent regions of the total spectrum shown in Fig. 2(a). Some weaker fits, e.g., those to the 95.5 keV and 228.6 keV peaks may be due to the fact that their shape did not reach stability yet due to the weak statistics. Attempts to fit the 228.6 keV peak by a doublet failed, while for the 95.5 keV peak such a procedure was not justified due to the low number of counts. Tentative levels (shown within parentheses in Table I) correspond to rather small, less certain peaks found through the peak decomposition procedure. Figure 3(e) corresponds to the region between 1015 and 1175 keV excitation, where there are states with significant overlap (average spacing comparable with the energy resolution). The peak decomposition from this region should be considered with some caution. The number of states found by GASPAN in this region depends somewhat on the width allowed for the peaks; by imposing a FWHM value comparable to that in the adjacent regions (with better separated peaks) one finds a number of nine peaks in this region, two of them being tentative (see Table I). The other (stronger) peaks found in this region appear to be relatively stable to reasonable variations allowed for the widths of the peaks.
As a result of the analysis of the (d,) spectrum of Fig. 2(a), a number of
58 excited states have been assigned in the 158Eu nucleus (five of these being tentative)
up to about 1.6 MeV excitation.
In Table I they are compared with the 27 excited states proposed from the -decay of
158Sm in the same energy range ENSDF ; beta158Sm .
Fourteen of these states may coincide with states observed in the -decay experiment.
| Present experiment | -decay ENSDF ; beta158Sm | |
| Ex (keV) | (10∘) [b/sr] | Ex (keV) |
| group (a) | ||
| 0 | 0.09 | 0 |
| 36.3(7) | 0.37 | 38.9 |
| 95.5(10) | 0.06 | 97.7 |
| 141.7(12) | 0.04 | |
| 173.2(16) | 0.03 | |
| 189.5 | ||
| group (b) | ||
| 224.2 | ||
| 228.6(8) | 0.17 | 229.9 |
| 278.2(12) | 0.07 | |
| 296.0(9) | 0.15 | 295.8 |
| 326.6(11) | 0.10 | 324.7 |
| 338.8 | ||
| 344.7(13) | 0.10 | |
| 363.6(8) | 0.34 | 363.6 |
| 373.4 | ||
| 380.7(9) | 0.20 | |
| group (c) | ||
| 415.8(15) | 0.12 | |
| 431.0(10) | 0.22 | |
| 446.0(14) | 0.10 | |
| 468.1(10) | 0.11 | 467.8 |
| 470 | ||
| 490.7(10) | 0.10 | |
| 507.3 | ||
| 524.0(13) | 0.08 | |
| 545.0(15) | 0.16 | |
| 551.3 | ||
| 558.5(8) | 0.41 | |
| 590.8(7) | 0.63 | |
| 608.7(16) | 0.11 | |
| 631.9(8) | 0.37 | 632.8 |
| 0.05 | ||
| 660 | ||
| 672.0(8) | 0.21 | |
| group (d) | ||
| 726.6(13) | 0.08 | |
| 741.1 | ||
| 753.4(8) | 0.29 | |
| 773.9(14) | 0.16 | |
| 790.3(18) | 0.08 | 791.5 |
| 826.2(12) | 0.20 | |
| 839.2(16) | 0.15 | |
| 879.3(8) | 0.24 | |
| 902.3(8) | 0.43 | |
| 0.04 | 921.3 | |
| group (e) | ||
| 963.7(15) | 0.10 | |
| 0.10 | 1010 | |
| 1032.2(17) | 0.16 | |
| 1052.1(10) | 0.35 | |
| 1072.3(10) | 0.43 | |
| 1093.2(10) | 0.31 | |
| 1110 | ||
| 1118.7(9) | 0.37 | |
| 1139.9(13) | 0.38 | |
| 1155.0(19) | 0.22 | |
| 0.06 | ||
| group (f) | ||
| 1209.6 | ||
| 1213.2(13) | 0.24 | |
| 0.14 | ||
| 1258.9(15) | 0.30 | |
| 1287.2(12) | 1.01 | |
| 1309.0(34) | 0.06 | |
| 1345.0(15) | 0.23 | 1342.9 |
| 1383.2(16) | 0.70 | |
| 1395.7(19) | 0.31 | 1395.3 |
| 1421.0 | ||
| 1434.0(19) | 0.18 | |
| 1448.0 | ||
| 1481.7(19) | 0.84 | |
| 1497.6(22) | 0.31 | |
| 1555.0(25) | 0.17 | 1550 |
| 1586.5(26) | 0.15 | |
| 1614(3) | 0.13 | |
| 1634(3) | 0.25 | |
III Discussion and conclusions
As a result of the present experiment and of the unpublished -decay study ENSDF ; beta158Sm a large number of excited states of 158Eu have been determined up to about 1.5 MeV excitation (Table I). No spin and parity values were assigned to any of these levels. In the decay of the ground state of 158Sm the populated states are expected to have spin values 0, 1, and 2 and many of these were populated in our reaction too. The spin window of the states seen in the (d,) reaction is wider, states up to spin about 6 may be populated (see, e.g., Ref. 196Au ), with higher spin states being favored due to the large angular momentum mismatch of the reaction.
Although without spin and parity value assignments, the knowledge available now on this odd-odd nucleus extends the nuclear structure systematics of the odd-odd Eu isotope chain, and allows a new, stimulating view of this interesting mass region.
It was recently shown that the nuclear level density can be employed as a useful indicator of the critical shape phase transitions (SPT) in nuclei QPM . The connection between the evolution of the level density at low excitation energies and the phase transition phenomenon was examined in detail in the rare earths region, where there is the well known first order SPT that takes place around the critical point . This behavior is induced by the variation of a non-thermal control parameter – the number of neutrons . The SPT manifests itself by a rapid evolution of the ground-state equilibrium deformation around the critical point, which is reflected in discontinuous variations of different so-called effective order parameters (such as the two-neutron binding energy, nuclear radii, etc.) as a function of . The level density was shown to display a maximum value at the critical point QPM , which is also consistent with the phenomenon of phase coexistence in nuclei at, or close to, the critical point.
The critical shape phase transitions were less studied in the odd-odd nuclei. Experimental determinations of the level density are rather scarce in such nuclei. In particular, the only isotopic chain for which systematic data exist is that of the Europium QPM . Experimental level densities at low excitation energies were taken from Ref. BSFG , where the parameters of simple level density models, such as the back-shifted Fermi gas (BSFG) or the constant temperature (CT) models were determined by fitting the experimental low-excitation complete level schemes and the level density at the neutron binding energy. In the BSFG model, the total level density is described as , where is the excitation energy, and are two empirical parameters and is the spin cutoff parameter BSFG . The parameter of the BSFG model may be taken as a measure of the level density: for nuclei with comparable masses, the larger , the larger is the level density QPM . Figure 4 shows the evolution of the experimental parameter known for three odd-odd Eu isotopes: 156Eu, 154Eu, and 152Eu. For these three isotopes, the knowledge of the low-excitation level scheme is considered complete within the following excitation energy/spin windows: (0–0.39 MeV)/(0 – 5) for 156Eu, (0 – 0.49 MeV)/(1 – 5) for 154Eu, and (0 – 0.35 MeV)/(1 – 4) for 152Eu, respectively BSFG . In Fig. 4 it is seen that the experimental has the largest value at , near the critical point of the control parameter , and decreases with increasing .
Since 158Eu is far from the critical point of the phase transition, we expect a relatively low level density in this nucleus, compared to that of the isotopes of mass 152 to 156. In order to examine the available data from a larger region we adopt here a simplified procedure. For this, we will directly compare the number of levels known in these nuclei up to an excitation energy of 0.35 MeV. This excitation energy range was chosen because it is common to the three nuclei in which complete level schemes exist ( 89, 91, and 93). The number of states up to 0.35 MeV is 83, 60, and 24 for 89, 91, and 93, respectively ensdf-Eu .
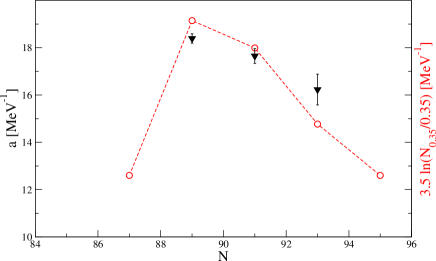
For (158Eu) we count a number of 13 levels up to 0.35 MeV excitation (Table I). Given the spin values covered by the two experiments , it is likely that this level scheme is well known up to this energy, close to completeness (within the same spin range as that of the three lighter isotopes). Actually, a few missing levels would not significantly alter our conclusions. For (150Eu), we have a similar situation, with a number of about 13 levels ensdf-Eu . In Fig. 4 we represent also a rough level density determined as the number of levels per MeV, /0.35 (where is the number of levels counted up to an excitation energy of 0.35 MeV), arbitrarily normalized such as its logarithm approximately scales as the parameter. This approximate low-energy level density shows the same pattern as that of the experimental parameter. 158Eu (at ) continues the decreasing trend of the level density with increasing . On the other side of , 150Eu also displays a rather low value. With the points added now at and one can see that the low-energy level density of Eu odd-odd nuclei displays a well defined maximum at .
In conclusion, a large number of excited states, close to 60, have been determined
up to about 1.5 MeV excitation for the
odd-odd nucleus 158Eu, from a spectrum of the 160Gd(d,)158Eu
reaction measured at 10∘. Although the experiment was limited to this
measurement and could not provide spin/parity value assignments, it allowed
an examination of the low-energy number of levels in the Eu isotopes with from
87 to 95.
The low-energy level density determined for 158Eu smoothly continues the decreasing trend of the lighter isotopes.
Partial support for this work within the TE67/2018 project with the UEFISCDI Romanian research funding Agency is aknowledged. The authors thank the technical staff of the Tandem accelerator for the good quality beam. This was the last transfer reaction experiment (of the Romanian authors) with the Q3D spectrograph of the tandem accelerator laboratory in Garching – Munich, which will be closed at the end of 2019.
References
- (1) D. Bucurescu, E. Drăgulescu, S. Pascu, H-F. Wirth, D. Filipescu, G. Căta-Danil, I. Căta-Danil, D. Deleanu, K. Eppinger, T. Faestermann, D.G. Ghiţă, T. Glodariu, R. Hertenberger, M. Ivaşcu, R. Kruecken, N. Mărginean, R. Mărginean, C. Mihai, A. Negret, T. Sava. L. Stroe, K. Wimmer, and N.V. Zamfir, Phys. Rev. C85, 017304 (2012)
- (2) N. Nica, Nucl. Data Sheets 141, 1 (2017)
- (3) R.C. Greenwood, R.G. Helmer, M.H. Putnam, and K.D. Watts, Nucl Instr. Meth. A390, 95 (1997)
- (4) M. Löffler, H.J. Scheerer, and H. Vonach, Nucl. Instr. and Meth. 111, 1 (1973).
- (5) H.-F. Wirth, Ph.D. thesis, Techn. Univ. München, 2001
- (6) S. Kumar, J. Chen, and F.G. Kondev, Nucl. Data Sheets 137, 1 (2016)
- (7) F. Riess, Beschleunigerlaboratorium München, Annual Report, 1991, p. 168
- (8) Meng Wang, G. Audi, F.G. Kondev, W.J. Huang, S. Naimi, and Xing Xu, Chinese Physics C41(3), 030003 (2017)
- (9) H.-F. Wirth, G. Graw, S. Christen, Y. Eisermann, A. Gollwitzer, R. Hertenberger, J. Jolie, A. Metz, O. Möller, D. Tonev, and B.D. Valnion, Phys. Rev. C70, 014610 (2004)
- (10) D. Bucurescu and N.V. Zamfir, Phys. Rev. C98, 024301 (2017)
- (11) T. von Egidy and D. Bucurescu, Phys. Rev. C80, 054310 (2009)
- (12) Evaluated Nuclear Structure Data File (ENSDF), maintained by the National Nuclear Data Center, Brookhaven National Laboratory, http://www.nndc.bnl.gov/ensdf.