The velocity field of the Lyra complex
Abstract
Context. The formation of cosmic structure culminates with the assembly of galaxy clusters, a process quite different from cluster to cluster.
Aims. We present the study of the structure and dynamics of the Lyra complex formed of the two clusters RXC J1825.3+3026 and CIZA J1824.1+3029, very recently studied using both X-ray and radio data.
Methods. This is the first analysis based on kinematics of member galaxies. New spectroscopic data for 285 galaxies were acquired at the Italian Telescopio Nazionale Galileo and used in combination with PanSTARRS photometry. The result of our member selection is a sample of 198 galaxies.
Results. For RXCJ1825 and CIZAJ1824 we report the redshifts, and , the first estimates of velocity dispersion, km sand km s-1, and dynamical mass, and . The past assembly of RXCJ1825 is traced by the two dominant galaxies, both aligned with the major axis of the galaxy distribution along the East–West direction, and by a minor North–East substructure. We also detect a quite peculiar high velocity field in the South–West region of the Lyra complex. This feature is likely related to a high velocity, very luminous galaxy, suggested to be the central galaxy of a group in interaction with RXCJ1825 by very recent studies based on X-ray and radio data. The redshift of the whole Lyra complex is . Assuming that the redshift difference between RXCJ1825 and CIZAJ1824 is due to the relative kinematics, the projected distance between the cluster centers is Mpc and the line–of–sight velocity difference is km s-1. A dynamical analysis of the system shows that the two clusters are likely to be gravitationally bound, in a pre-merger phase, with CIZAJ1824 in front of RXCJ1825 and going toward it.
Conclusions. Our results corroborate a picture where the Lyra region is the place of a very complex scenario of cluster assembly.
Key Words.:
Galaxies: clusters: individual: RXC J1825.3+3026; CIZA J1824.1+3029 – Galaxies: clusters: general – Galaxies: kinematics and dynamics1 Introduction
Clusters of galaxies are the largest gravitationally bound systems in the Universe. According to the CDM hierarchical scenario, the formation of structure progresses in a hierarchical fashion, culminating with the assembly of clusters of galaxies (see Springel et al. 2006 and refs. therein). Numerical simulations also show that clusters form preferentially through anisotropic accretion along the large-scale structure filaments (e.g., Colberg et al. 1999) and in a significant part through the accretion of galaxy groups, while the merger of two or more several massive entities is a more rare case (e.g., Berrier et al. 2009; McGee et al. 2009). Since the cluster assembly histories show significant variation from cluster and cluster (e.g., Berrier et al. 2009), most observational studies are focused on individual systems.
From the observational side, the trace of the cluster assembly has been studied since a long time, through the analysis of substructure as based on cluster galaxies (Baier & Ziener 1977; Geller & Beers 1982), X-ray emitting intracluster medium – ICM (Jones & Forman 1999) and more recently on gravitational lensing effects (e.g, Athreya et al. 2002; Dahle et al. 2002). Merging clusters have proved to be fruitful laboratories to study several physical processes. Cluster mergers have been suggested to be the energetic support for radio halos and relics (Tribble 1993; Feretti 1999). The analysis of the merging system named “Bullet-cluster” has allowed to obtain a strong prove for the existence of the dark matter – DM – showing the decoupling of baryonic and DM (Markevitch et al. 2002; Markevitch et al. 2004). The study of the accretion of groups onto clusters is quite timely in the context of galaxy evolution (e.g., Olave-Rojas et al. 2018 and refs. therein) since some pre-processing of galaxies in the group environment is expected prior to cluster formation (Zabludoff & Mulchaey 1998),
Optical data are a powerful way to investigate the presence of structures and the dynamics of cluster mergers (Girardi & Biviano 2002 for a review). Moreover, the photometric and spectroscopic information about cluster galaxies is complementary to the X–ray information since it is well known that galaxies and the ICM react on different timescales during a merger as shown by numerical simulations (e.g., Roettiger et al. 1997; Springel & Farrar 2007). In particular, multi-object spectroscopy observations have allowed the building of large samples of galaxies with measured redshifts for individual clusters and have proven a powerful tool in understanding cluster formation, as shown by several dedicated studies (e.g., Girardi et al. 2011, DARC project; Maurogordato et al. 2011, MUSIC project; Owers et al. 2013 using GAMA survey; Balestra et al. 2016, CLASH-VLT project; Golovich et al. 2017, collaboration).
An ideal candidate where to study in details how structures grow is the complex of the two clusters RXC~J1825.3+3026 (RXCJ1825 hereafter) and CIZA~J1824.1+3029 (hereafter CIZAJ1824), hereafter named the Lyra complex. RXCJ1825, also named CIZA J1825.3+3026, was discovered by ROSAT in the X-rays at galactic latitude b=18.547 deg at z=0.0645 (Ebeling et al. 2002). This cluster was found to be one of the strongest and spatially resolved source of Sunyaev-Zeldovich signal in the Planck all-sky cluster survey (Planck Collaboration et al. 2014). It has been studied as part of the XMM-Newton Cluster Outskirts Project (X-COP, Eckert et al. 2017), a very large program based on XMM-Newton X-ray observations (Eckert et al. 2019; Ettori et al. 2019; Ghirardini et al. 2019). In particular, as shown by Fig. 2 of Ghirardini et al. (2019), about 16West, slightly WNW, of this cluster there is the smaller cluster CIZAJ1824, already named NPM1G+30.0 and listed by Voges et al. (1999), with redshift (Kocevski et al. 2007). The recent study of Clavico et al. (2019) shows that whereas CIZAJ1824 is dynamically relaxed, RXCJ1825 is not and shows clear signatures of past and on-going merging. Indeed, the presence of a giant radio halo in RXCJ1825 is likely related to the on-going merging in this system (Botteon et al. 2019).
For these two clusters there were no ad hoc optical observations available. No dynamical analysis has never been performed and indeed only one redshift per cluster was known. We obtained time to perform a spectroscopic survey at the Italian Telescopio Nazionale Galileo (TNG). This study is devoted to the presentation of our analysis of the velocity field of the Lyra complex. The paper is organized as follows. We present the optical data and the cluster catalogue in Sect. 2. In Sect. 3 we describe the member selection procedure and global properties of the cluster complex. Section 4 is devoted to the analysis of the structure of the Lyra complex. We report our estimates of properties of the two individual clusters in Sects. 5 and 6. In Sect. 7 we present our dynamical analysis for the whole complex. We discuss our results in Sect. 8 and present our conclusions in Sect. 9.
Unless otherwise stated, we indicate errors at the 68% confidence level (hereafter c.l.). Throughout this paper, we use km s-1 Mpc-1 in a flat cosmology with and . In the adopted cosmology, 1corresponds to kpc at the redshift of the Lyra complex, used to fix the Mpc scale of projected distances throughout the paper. All magnitudes are presented in the AB system.
2 Data and galaxy catalog
2.1 New Spectroscopic observations
We observed the Lyra field with DOLORES@TNG in June 2018. In particular, we made use of the multi-object spectroscopy (MOS) capabilities of this instrument to observe 12 MOS masks with the LR-B Grism111http://www.tng.iac.es/instruments/lrs. In total, we observed 12 MOS masks for a total of 390 slits. For 9 masks, the total exposure time was 3600 s, for 3 masks the exposure time was 5400 s. In February 2019 we took long-slit spectra of another two galaxies (one of them is the bright radio galaxy ID. 039, see Sect. 2.2), both observed with an exposure time of 1800s.
We performed the reduction of the optical spectra with standard IRAF222IRAF is distributed by the National Optical Astronomy Observatories, which are operated by the Association of Universities for Research in Astronomy, Inc., under cooperative agreement with the National Science Foundation. tasks and were able to compute redshifts for 256 galaxies by using the cross-correlation method introduced by Tonry & Davis (1979). For another 29 galaxies we estimated the redshifts by computing the wavelength location of emission lines in their spectra (more details of the data reduction in, e.g., Boschin et al. 2013).
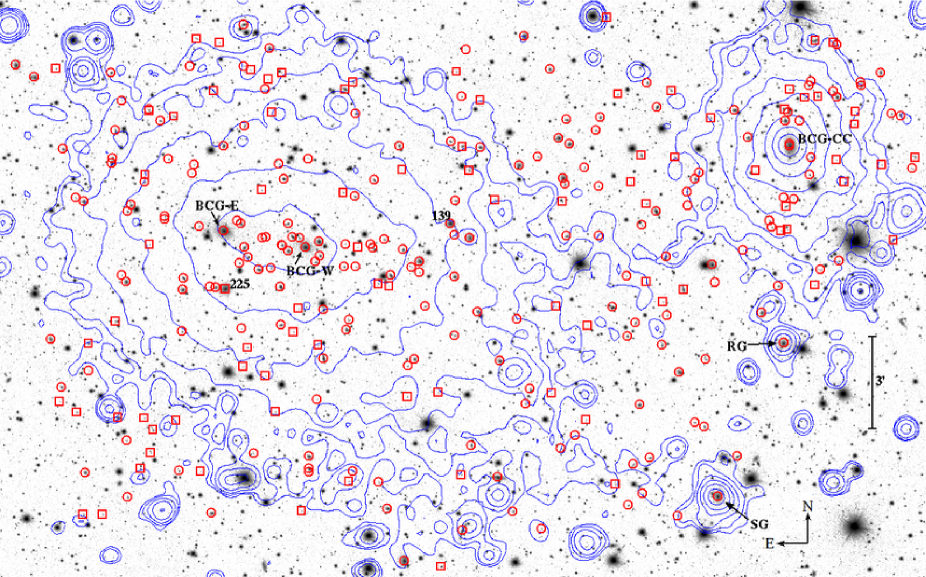
In total, our spectroscopic catalog lists 285 galaxies in the field of RXCJ1825. The median value of the errors is 114 km s-1. Figure 1 shows the field of the Lyra complex sampled by TNG spectroscopic data.
We also used the magnitudes , , and available in Pan-STARRS (DR1; Chambers et al. 2016) after correction for Galactic absorption.With the exception of 16 galaxies, magnitudes are available. Out of these, four galaxies have not and magnitudes available.
2.2 Galaxy catalog and prominent galaxies
Table 1, available at the CDS, lists the velocity catalog (see also Fig. 1): identification number of each galaxy and member galaxies, ID and membership (Cols. 1 and 2, respectively); right ascension and declination, and (J2000, Col. 3); dereddened Pan-STARRS (DR1) magnitudes, (Col. 4); heliocentric radial 444Unless otherwise stated, velocities reported in the paper are radial, that is line–of–sight ones. velocities, (Col. 5) with errors, (Col. 6). An excerpt from this table is also inserted in the article.
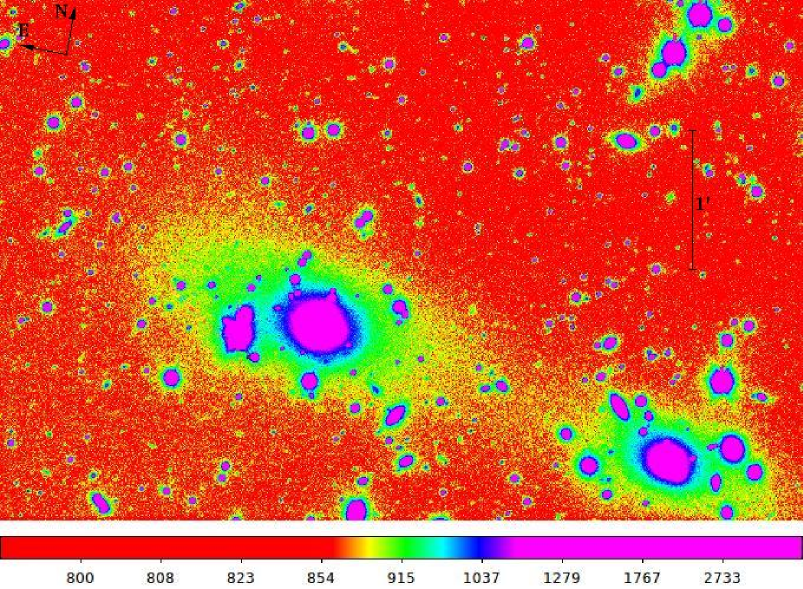
RXCJ1825 hosts two dominant galaxies, the galaxy ID. 226 (=14.63, hereafter BCG-E) and the galaxy ID. 186 (=15.15, hereafter BCG-W). The centroid of the XMM X-ray emission lies between these two galaxies, much closer to the BCG-W. Hereafter, for the center of RXCJ1825 we adopt the position of the X-ray centroid reported by Clavico et al. (2019), [R.A.=, Dec.= (J2000.0)]. The two BCGs are shown in Fig. 2.
The companion cluster, CIZAJ1824, hosts a cool core (Clavico et al. 2019) surrounding the dominant galaxy, the galaxy ID. 030 (=14.68, hereafter BCG-CC). As for the center of CIZAJ1824, we adopt the position of its BCG [R.A.=, Dec.= (J2000.0)].
At the South–West of the region, the galaxy ID. 050 (, hereafter SG) is at the top of an extended X-ray emission detected by Clavico et al. (2019), see also Fig. 1. They suggest that SG once was the central galaxy of a group, now in an advanced state of disruption after the interaction with RXCJ1825. This scenario explains the excess in the X-ray surface brightness between RXCJ1825 and SG (see Clavico et al. 2019 for details). The position of SG is R.A.=, Dec.= (J2000.0).
Other interesting galaxies are those with a peculiar radio emission (Botteon et al. 2019). The ID. 139 () is located West of RXCJ1825 center, in direction of CIZAJ1824, showing the features of a tailed radio galaxy. In the West region of the field, South of CIZAJ1824, there is another much brighter tailed radio galaxy, which coincides with the optical galaxy ID. 039 (hereafter RG).
3 Member selection and global properties
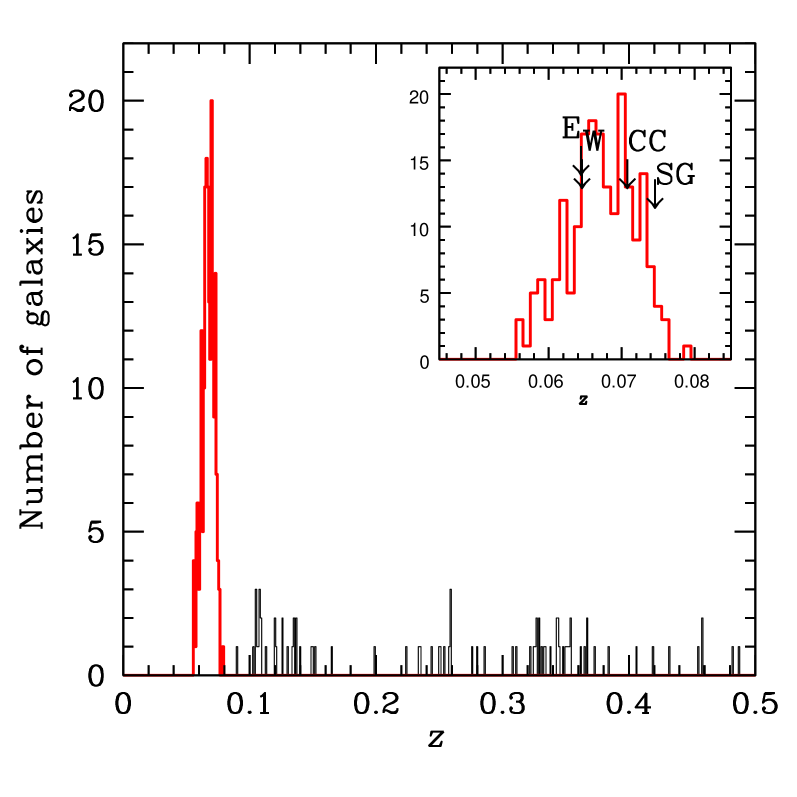
To select cluster members among the 285 galaxies with redshifts we applied the 1D adaptive-kernel method (hereafter DEDICA, Pisani 1993), very efficient for both medium and high sampled fields (Fadda et al. 1996; Balestra et al. 2016). This method searches for the most significant peaks in the velocity distribution. We detected the Lyra complex as a peak at populated by 199 galaxies (in the range , see Fig. 3). The non-selected galaxies are all background galaxies.
We also reject the very bright galaxy ID. 225 (=15.01) which lies close to the lower limit of our redshift selection. The inspection of our TNG image reveals that it is a huge spiral. In the case that ID. 225 were part of the cluster, this bright galaxy would be the second brightest galaxy in the RXCJ1825 core, even more luminous than BCG-W. However, in the literature non elliptical BCGs are very rare and in a few of these cases richer data sets have shown that they are cases of misclassification, that is galaxies belonging to a small foreground group in front of the cluster (e.g., Lauer et al. 2014). Indeed, the redshift constraints imposed by the member selection cannot prevent from including those galaxies with a redshift similar to that of the cluster but really distant (several Mpc) from the cluster in the three-dimensional space, as also shown when projecting simulated clusters and field around (e.g., Biviano et al. 2006). Therefore we assume that the correct interpretation is that ID. 225 is a foreground object at z=0.056075, Mpc in front of the cluster complex, and projected onto the core of RXCJ1825.
The final catalog of member galaxies is made of 198 objects, 194 having full photometric information, too.
By applying the biweight estimator to the 198 members of the complex, we computed a mean redshift of 0.0003, i.e. 96 km s(Beers et al. 1990, ROSTAT software). We estimated the velocity dispersion of the whole complex, , by using the biweight estimator and applying the cosmological correction and the standard correction for velocity errors (Danese et al. 1980). We obtained km s-1, where errors are estimated through a bootstrap technique.
4 Structure of the Lyra field
4.1 2D structure
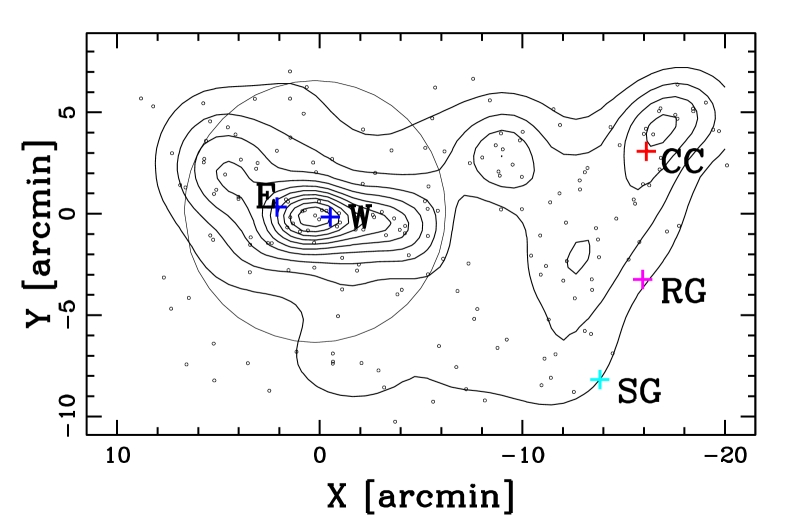
In order to determine the structure of the Lyra complex as projected on the plane of the sky, we applied the 2D adaptive-kernel method (2D-DEDICA, Pisani 1996) to the positions of galaxy members, We detected four peaks with a significance larger than the 99% c.l. and a relative density with respect to the densest peak 0.3 (see Fig. 4 and Tab. 2). The most significant and dense peak (RXCJ1825main) individuates the RXCJ1825 cluster, close to the X-ray centroid, and the isodensity curves of the galaxy distribution design a structure elongated in the East–West direction, close to that traced by the position of the two BCGs. North–East of the cluster peak, a minor peak is also detected (RXCJ1825NE). The second significant and dense peak individuates the CIZAJ1824 cluster. The last peak lies between the two clusters (MiddlePeak).
Our spectroscopic data do not cover the entire cluster field in an uniform way and, in particular, the position of masks might bias the result. To check our results we used a photometric catalog extracted from the Pan-STARRS survey. We considered non-stellar objects within a radius of 20from the central point of our spectroscopic observations and we applied the magnitude corrections for the Galactic absorption. We selected likely members on the basis of the – vs. color-magnitude relation (CMR), which indicate the locus of member galaxies (e.g., Goto et al. 2002; see Fig. 5). To determine the CMR we applied the 2-clipping fitting procedure to the cluster members: we obtained –=0.950-0.032, based on 132 surviving galaxies. Our fitted relation agrees with the fact that – vs. CMR is about flat (Goto et al. 2002), with slope values depending on the analyzed cluster (e.g., between -0.04 and 0. in the sample of Barrena et al. 2012). As for the intercept, our value of –=0.39 for =17.5 is well consistent with the value reported for low redshift clusters, – for Abell 168 at and for Abell 1577 at 0.14 (Goto et al. 2002, see Figs. 1 and 2 and text). Out of the Pan-STARRS photometric catalog we consider as likely cluster members the objects lying within 0.07 mag from the CMR, that is about two times the error on the intercept.
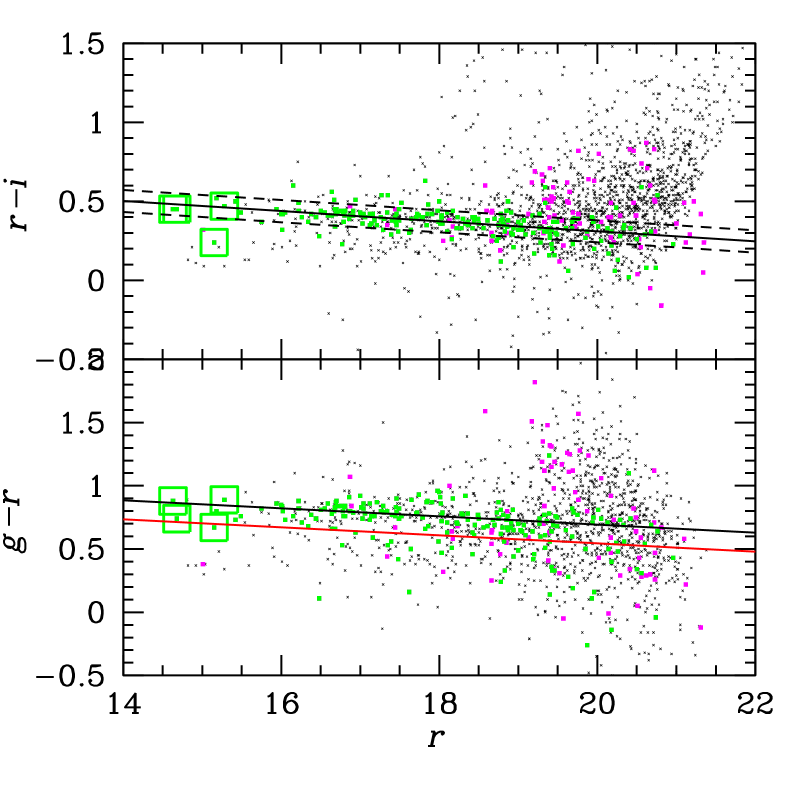
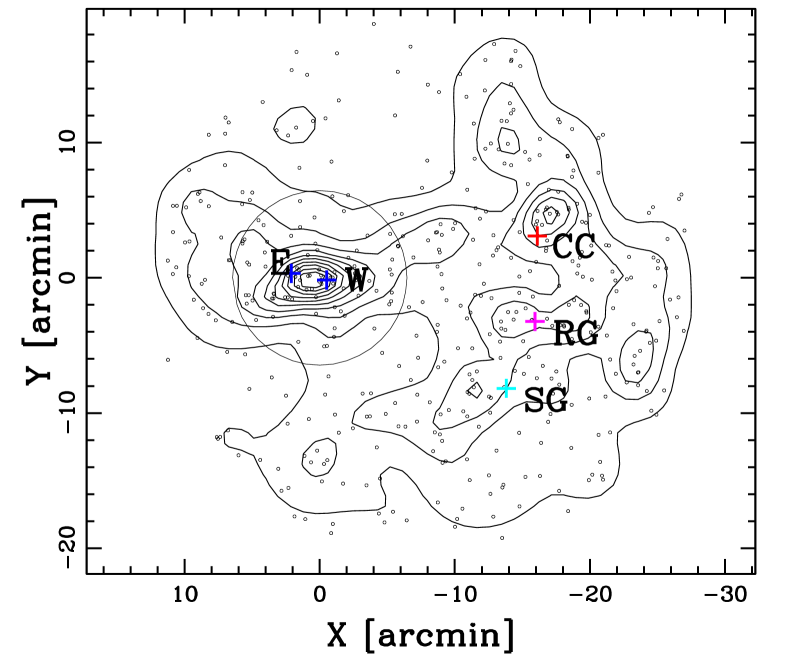
Figure 6 shows the contour map for the 450 photometric members having , that is mags fainter than , the characteristic absolute magnitude of the luminosity function of galaxies in clusters. Table 3 lists the significant peaks detected in the same region sampled by our redshift measures. We confirm the results obtained in the spectroscopic sample. As above, RXCJ1825 is detected and shows a structure elongated in the East–West direction, with a small feature at North–East. CIZAJ1824 is clearly detected, too. The South–West region of the field is now better sampled and reveals a few structures.
4.2 3D structure
The existence of correlations between positions and velocities is a powerful footprint of real substructures.
We analyzed the presence of a velocity gradient performing a multiple linear regression fit to the observed velocities with respect to the galaxy positions in the plane of the sky computing the coefficient of multiple determination (, NAG Fortran Workstation Handbook 1986). The position angle on the celestial sphere of the velocity gradient is PA degrees (measured counter–clock–wise from north), that is higher–velocity galaxies lie in more western regions, with the velocity gradient pointing from RXCJ1825 to CIZAJ1824 as expected. We followed Girardi et al. (1996) to asses the significance of this velocity gradient and performed 1000 Monte Carlo simulations by randomly shuffling the galaxy velocities and for each simulation we determined the coefficient of multiple determination . The significance of the velocity gradient is determined as the fraction of times in which the of the simulated data is smaller than the observed . We found that the velocity gradient is strongly significant at the c.l..
In order to study the velocity field of the cluster complex, we used the statistics and the bubble plot of Dressler & Schectman (Dressler & Shectman 1988, hereafter DS-test). For each galaxy, the deviation is defined as , where the subscript “l” denotes the local quantities computed over the group formed of the galaxy itself and its neighbors. The cumulative deviation of the local kinematical parameters (mean velocity and velocity dispersion) from the global cluster parameters is given by the value , the sum of the of the individual galaxies. The significance of , that is how far is the system from dynamical equilibrium, is checked by running 1000 Monte Carlo simulations, randomly shuffling the galaxy velocities.
Girardi et al. (1997; 2010) introduced two variations of the DS-test where the contributes of the local mean and dispersion are considered separately. The kinematical indicator based on the local mean was proved to be particular useful since that based on the velocity dispersion needs an elaborate treatment in presence of very large samples (e.g., Girardi et al. 2015). Following the methodology of Girardi et al. (2010), we used the kinematical indicator based on the deviation of the local mean, , and the significance of this test (DSv-test) was determined as in the standard DS-test.
Both the DS- and DSv-tests reveal that the Lyra system is not relaxed, at the c.l.. Figure 7 points out the presence of RXCJ1825 and CIZAJ1824 as low and high velocity regions in the velocity field. It also shows that the South–West region is characterized by high velocities, comparable to those in CIZAJ1824. The intermediate region between RXCJ1825 and CIZAJ1824 is characterized by a still higher velocity region. This suggests that the MiddlePeak is not a structure connecting the two clusters, which instead should be characterized by an intermediate velocity.
4.3 Red galaxies
In the local Universe red and/or passive galaxies are known to populate the cluster cores and are used to trace important galaxy systems or structures (e.g., Lubin et al. 2000; Girardi et al. 2015). We used the – vs. CMR to separate red from blue spectroscopic members. The fitted relation is –=1.334-0.032, based on 116 galaxies. We define blue galaxies those bluer than 0.15 mag with respect to the typical color of red sequence galaxies (see Fig. 5), where the value of 0.15 is about two times the error on the intercept. According to this definition, out of the 194 galaxies with both redshift and magnitude information, 153 and 41 are defined red and blue galaxies, respectively.
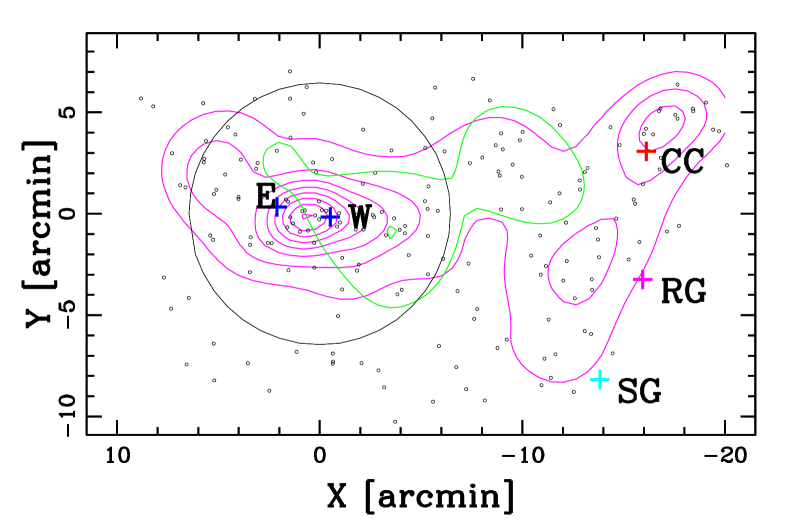
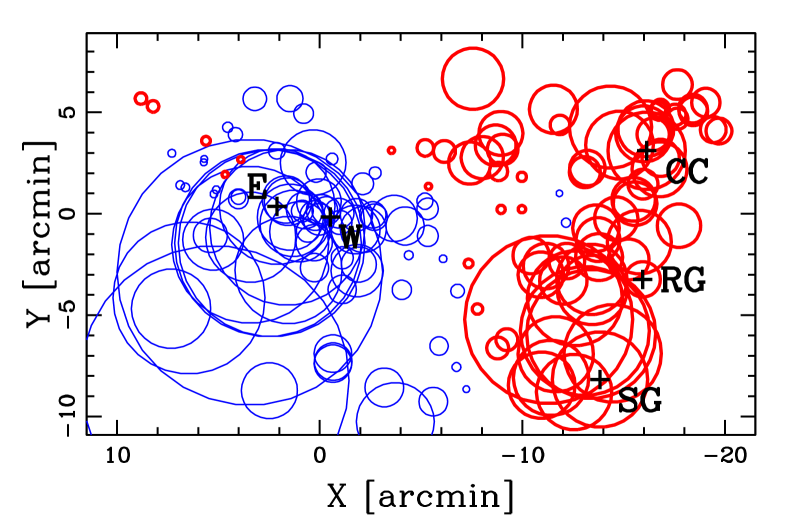
Figure 8 (upper panel) shows the isodensity contours computed for blue and red galaxies separately using the 2D-DEDICA method. The relevant peaks obtained for red galaxies are listed in Tab. 4. Figure 8 (lower panel) shows the result of the DSv-test. This analysis based on red galaxies generally confirms that based on all galaxies. According to the DS- and DSv-tests, the presence of substructure is significant at the c.l. and RXCJ1825 and CIZAJ1824 are always detected as low and high velocity regions in the velocity field. The velocity gradient is very significant ( c.l.) and points from RXCJ1825 toward CIZAJ1824 (PA degrees), in agreement with that found for all galaxies.
The analysis based on red galaxies differs in two points. A South–West peak is now detected, although just over the threshold of 0.3 (SouthWestPeak in Table 4). More interestingly, the MiddlePeak is not longer detected by our 2D-DEDICA analysis and it seems rather related to the presence of blue galaxies (see blue contours in Fig. 8, upper panel). The comparison of Fig. 8 (lower panel) with Fig. 7 shows that the velocity peculiarity of the intermediate region between the two clusters is no longer present. We conclude that the above detection of a MiddlePeak is due to a few galaxies, maybe a loose group or a filament, in the phase of accretion from the field, rather than to an important structure connecting the two clusters.
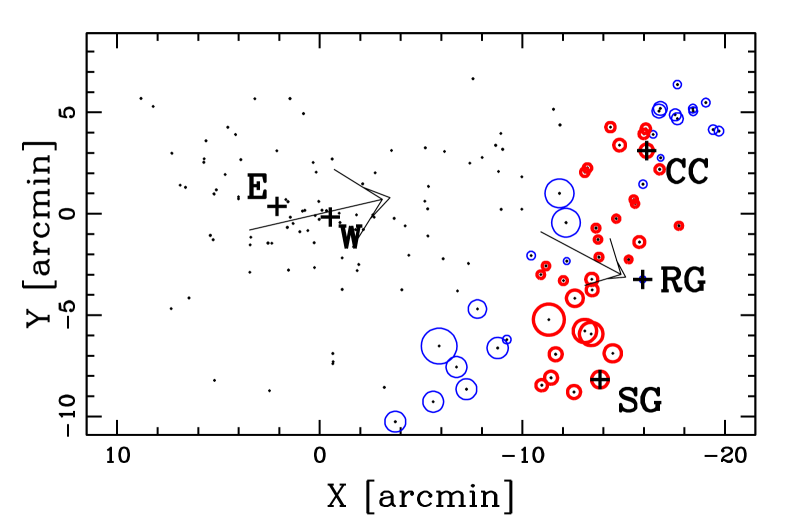
The analysis of the sample of red galaxies confirms that the South–West region of the field is characterized by high velocity galaxies (see Fig. 8, lower panel). We focused our attention onto the West region considering only the 58 red galaxies belonging to the CIZAJ1824 and SouthWestPeak (see Table 4). Using the DS- and DSv-tests, we found no evidence for substructure also when considering smaller numbers of neighbors to compute local quantities (down to neighbors) suggesting that CIZAJ1824 and SouthWestPeak are characterized by very similar kinematical properties. The velocity gradient, significant at the 95% c.l., points from North–East to South–West (PA degrees, see Fig. 9). These results are somewhat unexpected. In fact, one would expect that the South–West region were populated by galaxies of both the two clusters, especially by those of the rich RXCJ1825 cluster, and showed an intermediate velocity, with a strong gradient pointing from South–West to CIZAJ1824. We conclude that the Lyra region, and in particular its South–West region, are more complex than expected (see the below section, too).
4.4 SG and the SW region
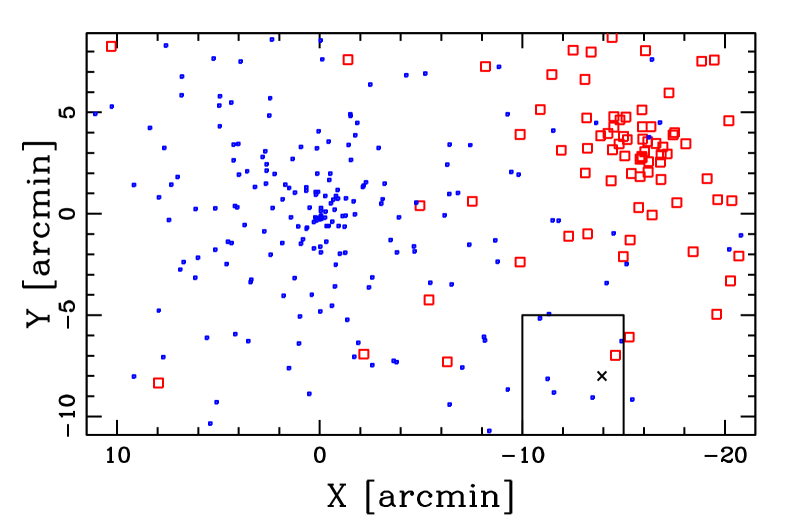
To check the peculiarity of the observed velocity field, we made a simple Monte Carlo simulation to reproduce the position on the sky of galaxies of RXCJ1825 and CIZAJ1824. We used the NFW model for the galaxy distribution and our mass estimates derived in Sect. 6. Figure 10 shows the result of a simulation where we fixed 220 and 80 galaxy-points for RXCJ1825 and CIZAJ1824 within the respective radii555The radius is the radius of a sphere with mass overdensity times the critical density at the redshift of the galaxy system., that is a number of galaxies proportional to the respective . To be more realistic, we allowed the simulation to fill with galaxies the whole region, following the same NFW model, for a total number of 327+118 galaxy-points. We do not simulate the Gaussian velocity distribution of each cluster but galaxy-points of RXCJ1825 and CIZAJ1824 are all assumed to have the same velocity of the respective parent cluster (see blue and red points in Fig. 10). The comparison of Fig. 10 with Figs. 7 and 8 (lower panel) show that the simulated field is populated by low velocity galaxy-points while the real field is populated by high velocity galaxies. This analysis confirms that the high velocity field detected in the South–West region is well far from that expected in the context of a system formed by only two relaxed clusters.
In the South–West region, the brightest galaxy is SG, which is the fifth brightest galaxy of the whole Lyra field analyzed here. In general, most luminous galaxies in clusters are related to groups as shown when accurate dynamical and/or gravitational lensing analyses are performed (e.g., Girardi et al. 2008 and refs. therein). SG has a quite high velocity, more than 1000 km shigher than that of BCG-CC. In order to detect galaxies related to SG minimizing possible contamination from the two clusters, we selected galaxies having velocities larger than SG. Fig. 11 shows the positions of these galaxies in the sky. Four of these galaxies are close to the center of CIZAJ1824 and might be the high tail of the velocity distribution of its galaxy population. The other three are aligned between SG and RXCJ1825 along a stretched structure.
5 Disentangling RXCJ1825 from CIZAJ1824
Our analysis of the 2D galaxy distribution of the Lyra complex well detects the two individual clusters and indicates that RXCJ1825 is more massive than CIZAJ1824 by a factor 2-4 depending if we consider the density of the peaks or the richness of the corresponding samples, and the RXCJ1825main+NE peaks vs. the CIZAJ1824 sample or only RXCJ1825main vs. the CIZAJ1824 (see Tabs. 2, 3, and 4).
However the velocity distribution does not show evidence for the presence of two separated peaks (see Fig. 3, inset) and both 1D-DEDICA and 1D-KMM method (Ashman et al. 1994) failed in finding a bimodality. Of consequence we consider the values of the velocities of the BCGs, as measured from redshift, fair signposts of the velocities of the two clusters. This is likely true for CIZAJ1824, a very relaxed cluster according to Clavico et al. (2019), for which we measure km s-1, and also for RXCJ1825 where the two BCGs have the same velocity within the errors with an average value of km s-1.
Analyzing the two samples corresponding to the peaks CIZAJ1824 and RXCJ1825main detected in the 2D-DEDICA analysis of the galaxy distribution, we obtained km sand km s-1, in agreement within the errors with the measured velocities of the BCGs. For both samples we obtained quite large estimates of velocity dispersion, km sand km s-1. However we expect that each sample may be contaminated by some galaxies belonging to the companion system or other interveining substructures due to the projection effects. We stress that: i) CIZAJ1824, the poorer cluster, is expected to be the more contaminated; ii) the contamination is expected to be larger among blue galaxies due to the field or the outskirts of the companion cluster; iii) the estimator is much less robust than to the inclusion of interloper galaxies, the effect of inclusion is generally an increasing of estimates.
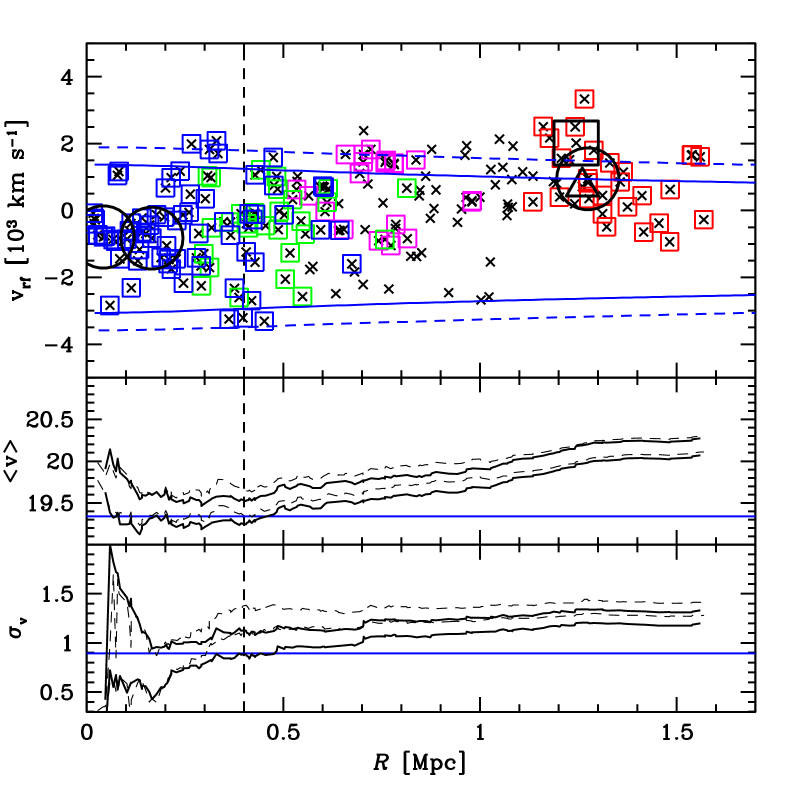
In order to disentangle the two systems and obtain reliable estimates for the velocity dispersion, we performed the analysis of the mean velocity profiles and velocity dispersion profiles (e.g., Girardi et al. 2016). The top panel of Fig. 12 shows the complexity of the distribution of galaxies of the Lyra complex in the projected phase-space, that is the rest-frame velocity vs. the clustercentric radius . As for the system redshift (and the related ), we used that of the full Lyra system which is assumed to fix the cosmological distance of the system and thus the Mpc scale for . The following analysis is independent of this assumption. As for the center, the X-ray centroid of RXCJ1825 is assumed.
Figure 12 (middle panel) presents the integral mean velocity profile for all member galaxies and for red galaxies only. It is shown that agrees with in the central region of RXCJ1825 and that the inclusion of more galaxies at larger clustercentric distances causes an increasing of the value of the mean velocity, likely due to the contamination of galaxies belonging to CIZAJ1824 or other minor substructures, up to reach the global value of . The inspection of the mean velocity profile points out that starts to increase at about 0.4 Mpc, with being already 1-sigma higher than the mean velocity of the two BCGs of RXCJ1825 at 0.5 Mpc. Therefore, we can assume that the contamination is not relevant for Mpc.
Figure 12 (bottom panel) presents the integral velocity-dispersion profile (hereafter VDP) for all member galaxies and for red galaxies only. The VDP of relaxed clusters is expected to have a gentle decline down to the global value of the velocity dispersion while the contamination of a companion cluster produce a sharp increase (e.g., cfr. Fig. 2 of Girardi et al. 1998 with Fig. 2 of Girardi et al. 1996). As for RXCJ1825, its VDP is sharply declining down to 0.15 Mpc (but with large uncertainties) and then increasing, very slightly in the case of the red galaxies. Since Fig. 12 (top panel) shows that the galaxies of the CIZAJ1824 peak are still well far, we assumed the velocity dispersion computed using galaxies within Mpc is a reliable estimate of the velocity dispersion of the RXCJ1825 galaxy population. We computed km susing all 62 galaxies and km susing the 49 red galaxies. Since the red population is likely less affected by contamination, to be more conservative we adopt the latter value as the estimate of the velocity dispersion in RXCJ1825. The minimum point of VDP, km s-1, is found at Mpc, which is indeed comparable to the standard size of cluster cores when the galaxy profile is fitted with King-like models (see Girardi et al. 1995 and refs. therein).
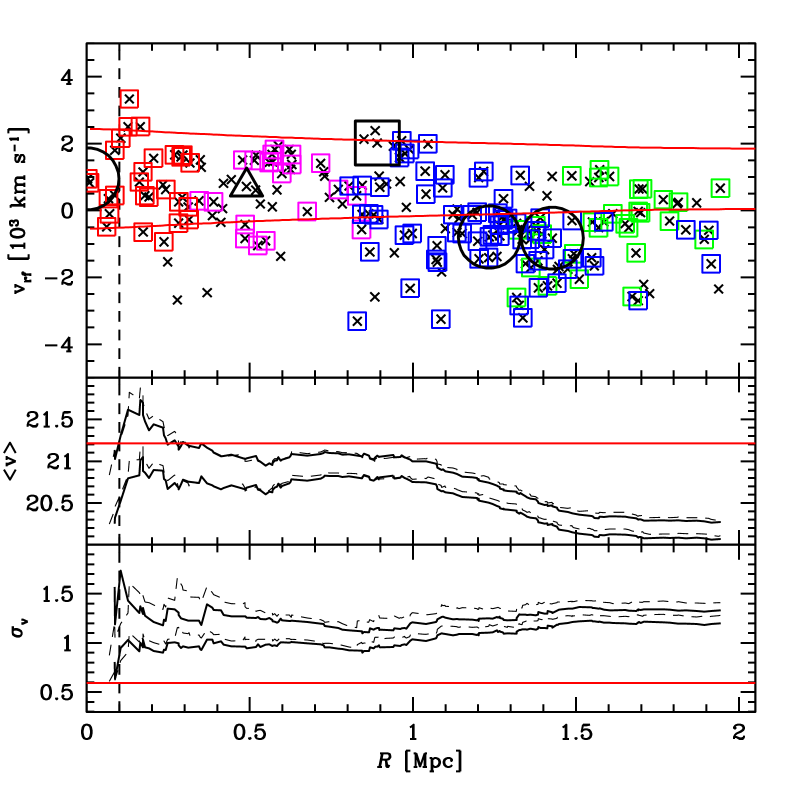
The results of the same analysis but for CIZAJ1824 is shown in Fig. 13, where the center is fixed on BCG-CC. Following the above approach, we note that shows a decreasing already in the very central regions thus we suspect that the contamination by RXCJ1825 or other substructures is already important out of Mpc (0.15 Mpc). The velocity dispersion computed in this small region is km s( km s-1), based on six (seven) galaxies. However this estimate of is not supported by the analysis of the VDP.

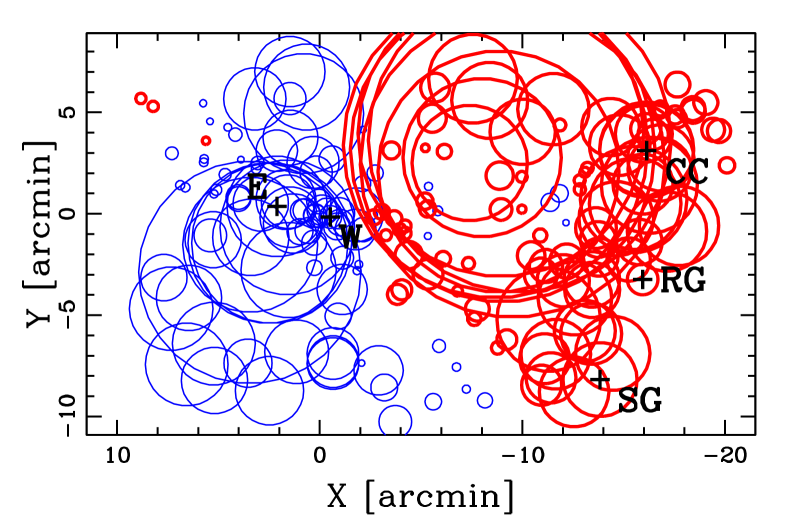
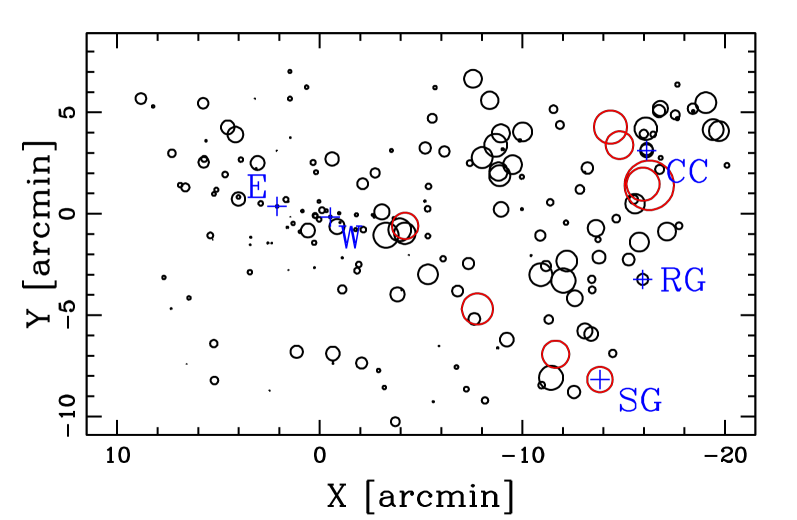
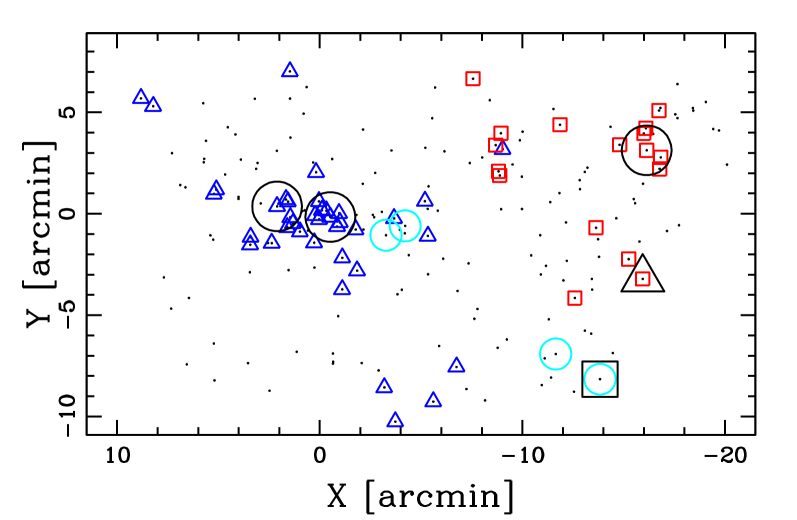
We resorted to using the method devised by Serna & Gerbal (1996), know as H-tree method or Serna-Gerbal method (e.g., Durret et al. 2010; Adami et al. 2018). This method uses a hierarchical clustering analysis to determine the relationship between galaxies according to their relative binding energies. The method assumes by definition that the redshift difference are of kinematical nature. The method also assumes a constant value for the mass-to-light ratio of galaxies and Serna & Gerbal suggested a value comparable to that of clusters. Out of our catalog of 198 member galaxies we use the 194 galaxies having available magnitudes. We considered values of =100, 150, and 200 as suggested by large statistical studies (e.g., Girardi et al. 2000; Popesso et al. 2005; Proctor et al. 2015). The (gross) results are quite robust against the choice of the value of . Figure 14 shows the resulting dendogram for =150 , where the total energy appears vertically. At the deepest potential hole there are BCG-E and BCG-W of RXCJ1825. There is no relevant substructure in the most part of the cluster down to a level where a group hosting BCG-CC (hereafter HT2) departs from the main tree which continues with the group hosting BCG-E and BCG-W (hereafter HT1), as shown in Fig. 14. The groups HT1 and HT2 are formed of 42 and 19 galaxies, respectively. The mean velocities of HT1 and HT2 are consistent with the mean velocities of the two clusters recovered with other methods (see above). The spatial position of the galaxies of HT1 and HT2 are also shown in Fig. 15. A similar result is obtained considering =100 and 200 . We conclude that the two clusters are the only important structures detected in the field.
-
a
The center is the X-ray centroid (Clavico et al. 2019).
-
a
The center is the position of BCG-CC.
Depending on the adopted value of , the number of members of HT2 ranges in the 17–19 interval and the value of in the 678–743 km sinterval. We decided to adopt the average value of km s-1, as a reliable estimate of the velocity dispersion of CIZAJ1824 galaxies. As for HT1, the number of members ranges in the 35–49 interval and the value of in the 591–766 km sinterval. The average value is km s-1, which is indeed much smaller than that obtained from our VDP analysis for RXCJ1825, but agrees with that measured for the core within Mpc. We conclude that the HT1 group should be interpreted as the core – plus galaxies strictly bound to it – of RXCJ1825.
We also applied the Serna & Gerbal method to the sample of red galaxies with the addition of BCG-W. In fact, although BCG-W is slightly bluer than our definition of red galaxies, it is an elliptical galaxy and cannot be neglected in this method where galaxies are weighted with their luminosities. Very reassuringly, the results on this sample of 154 galaxies is comparable to those obtained for the full sample, with the detection of HT1 and HT2 having values in the above ranges.
When using all galaxies, the SG galaxy is assigned to the global cluster (in the case) or assigned to a small group of 4 galaxies (HTSG, in the and 150 cases). When using red galaxies, the SG galaxy is always assigned to the global cluster. Thus we cannot be confident in the detection of a group related to SG, although we indicate it in Fig. 15 where it appears as a very stretched structure. Finally, the RG galaxy is assigned only in one case to the HT2 group, otherwise is part of the global cluster or very poor groups at higher energy level.
Table 5 lists our best estimates of cluster velocity and velocity dispersion, and , for RXCJ1825 and CIZAJ1824, separately. The listed uncertainties are strictly related to the method of analysis.
6 Mass estimates of RXCJ1825 and CIZAJ1824
To compute the mass of the two clusters we used the values estimated for in the previous section (see Tab. 5) and applied the relation by Munari et al. (2013, their eq. 1):
| (1) |
where km s-1, the average of the values they proposed, , and is computed using the adopted cosmology of this study.
As for RXCJ1825, we estimated a mass within Mpc, where uncertainties of 10% and 30% on and are due to the propagation of the uncertainty on . An additional 10% of uncertainty on mass is also added due to the scatter around the theoretical relation. We used the recipe of den Hartog & Katgert (1996) with the assumption of a NFW mass density profile (Navarro et al. 1997; Dolag et al. 2004) to derive from our mass estimate the “caustics”, that is the curves delimiting the region where the rest-frame velocity is smaller than the escape velocity. The inspection of Fig. 12 (top panel, solid blue curves) suggests that our mass estimate is adequate to describe the position of the RXCJ1825 galaxies in the phase-space. In the same figure we also plot the caustics derived from the mass computed using =1244 km sobtained for all galaxies instead for red ones, which give a kind of external envelope. As for CIZAJ1824, we estimated a mass within Mpc, the caustics to verify this mass value are plotted in Fig. 13 (top panel, solid red curves).
7 A bimodal model
If we assume that the two clusters are at the same distance from us, that is their redshift difference is of kinematical nature, the rest-frame velocity difference between the two cluster is km s-1, and the projected distance is Mpc.
To perform the dynamical analysis of the system, one needs a third observational parameter, the mass of the whole system, . We estimated adding the mass of the two cluster masses. Since it is known that cluster galaxy density profiles, and likely the DM profile, extend well out of , to and outer (Biviano & Girardi 2003; Rines et al. 2013), the involved global mass of each system may be assumed to be higher by a factor two. The mass of the whole system is then estimated to be in the 1.5-3 range.
As an alternative estimate of the mass of the whole system, assuming that the system is bound (see below), we computed the mass estimate based on the virial theorem (Limber & Mathews 1960). Following the recipe of Girardi et al. (1998):
| (2) |
where depends on the projected distance between any pair of the galaxies. In principle, this method may overestimate by a factor two the mass of a system which is bound but not virialized, but numerical simulations show the virial mass estimate to be quite accurate also for superclusters near turnaround (Small et al. 1998). We obtained a mass of for the sampled region, that is a projected region of Mpc Mpc. Since this region is much smaller than the region of RXCJ1825, our simple computation confirms that we are looking at a very massive system.
As a third approach, on the assumption that the velocity dispersion might be an acceptable proxy for the mass also before the virialization, we applied the formula of Munari et al. (2013) to the velocity dispersion for the whole Lyra complex, km s-1, and obtained =2.6 , which we interpret as the mass of the cluster which will be formed in the future by the merger of RXCJ1825 and CIZAJ1824. This mass value lies in the 1.5-3 range of the above estimated . Table 6 summarizes the mass values estimated for the whole system.
To check whether the Lyra system is bound, we computed the two-body Newtonian criterion for gravitational binding that is stated in terms of the observables to be
| (3) |
where is the projection angle between the plane of the sky and the line connecting the centers of the two clumps and and are the velocity difference and the projected distance between the two clusters as above reported. Eq. 3 is valid in the case of a pure radial motion. When adding an orbital component in addition to the radial component, the true formulation is rather , that is allowing . Assuming , the probability that the system is bound is 31% in the case of radial orbits and 34% in the more general case, following Beers et al. (1982) and Hughes et al. (1995) for the computation. Assuming the more realistic value, , the probability that the system is bound is and in the two cases.
The above probabilities are estimated from the solid angles without regard to other constraints. Indeed, redshift surveys of clusters of galaxies limit cluster-cluster peculiar velocities to km s(Bahcall et al. 1986) and basic arguments indicate that typical velocities involved in cluster mergers are km s(Sarazin 2002). In fact, the highest values for impact velocity reported in the literature are of the order of 4000 km sand are related to important mergers, very close to the core–core passage (e.g., the bullett cluster of Markevitch et al. 2002; Abell 2744 of Boschin et al. 2006, see also the discussion in Molnar et al. 2013). When values of ∘, which lead to deprojected/real velocities km sare excluded, the bound probability is enhanced to .
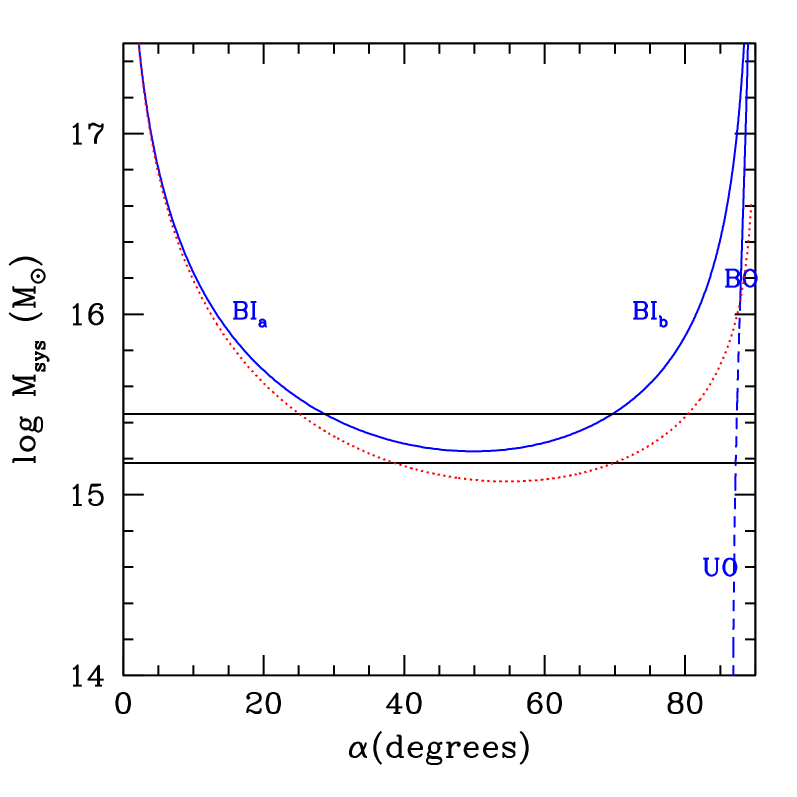
In order to analyze the interaction between the two clusters, we applied the analytical two–body model introduced by Beers et al. (1982) and Gregory & Thompson (1984), following the methodology of Girardi et al. (2008). This model assumes radial orbits for the clumps with no shear or net rotation of the system, as in Eq. 3. Furthermore, the clumps are assumed to start their evolution at time – here the time 0 of the universe – with separation , and are moving apart or coming together for the first time in their history. We are assuming that we are seeing the cluster prior to merging at the time t=12.603 Gyr, the age of the universe at the redshift of the Lyra system. The bimodal model solution gives the total system mass as a function of .
Figure 16 shows the bimodal-model solution in comparison with our estimate of the mass of the system, which is the most uncertain observational parameter, here assumed to be in the 1.5–3.0 range. The present bound outgoing solutions (i.e. expanding), BO, is clearly inconsistent with the observed mass. The unbound-outgoing solution, UO, is acceptable but only for a very small range of values of , that is is formally quite improbable. Bound ingoing solution solutions (BI) are quite acceptable and require intermediate values of , in the range of 30∘-70∘. Therefore, the geometry of the merger is that CIZAJ1824 is in front of RXCJ1825 and moving towards it. The specific case with ∘implies a real distance of 2 Mpc and a real/deprojected velocity of 2300 km s-1. A distance of 2 Mpc means that the center of CIZAJ1824 is at a distance of from the center of RXCJ1825, and that the two -regions of the two clusters are just in touch but not compenetrated.
We are aware that there are several limitations in characterizing the dynamics using the bimodal model. The obvious limit is the assumption that the two systems move on a radial orbit. However, basic arguments indicate that typical impact parameters should be small, of the order of 160 kpc (Sarazin 2002). More important, the model does not take into account the mass distribution in the two clumps, which starts to be important when their separation is comparable with their size. However, in the specific case, the two systems are likely just approaching, well far from the core-core passage.
8 Discussion
We discuss here our results and some points of our analysis with particular attention to results based on X-ray and radio data (Botteon et al. 2019; Clavico et al. 2019).
8.1 Global dynamics
As for our dynamical analysis of Sect. 7, the analytical two-body model requires that we are looking at the two clusters before any core-core passage. This assumption is based on the fact that Clavico et al. (2019) find no excess in the X-ray surface brightness profile between RXCJ1825 and CIZAJ1824 and the absence of a disturbed morphology in the X-ray surface brightness of CIZAJ1824. We also stress the point that our dynamical analysis implicitly assumed that the redshift difference between RXCJ1825 and CIZAJ1824 is due to kinematics, that is both clusters are at the same distance from us. Instead, in the case the redshift difference is interpreted as a cosmological distance, the distance between the two clusters is Mpc. With the optical data we cannot appreciate this difference, which implies a difference in optical luminosity of , in mag of , and not appreciable difference in color (e.g., Lopes 2007). Indeed, the appearance of BCG-CC on the image is also similar to that of the two RXCJ1825 BCGs. Using the number density of galaxy clusters with masses higher than 4(e.g., Eke et al. 1996; Vikhlinin et al. 2009), one expects fewer than clusters as massive as CIZAJ1824 in the sampled volume, thus the casual presence of two unrelated clusters is quite improbable.
8.2 RXCJ1825 and CIZAJ1824
As for RXCJ1825, the two dominant galaxies, BCG-E and BCG-W, have similar magnitudes, mag, and are close in projected position, within Mpc, and in line–of –sight velocity, since redshift measures are equal within the uncertainties. The presence of two dominant galaxies in the cluster is generally taken as evidence of a merger in the past since the giant ellipticals observed in the center of the cluster are suspected to be the BCGs of the two previously colliding subclusters. Indeed, considering more and more data can make sometimes possible the detection of the related subclusters (e.g., the case of Coma cluster, Colless & Dunn 1996).
In agreement with the above scenario, we find that the isodensity contours of the galaxy distribution in the central part of RXCJ1825 is elongated along about the East–West direction. Following Plionis & Basilakos (2002, based on Carter & Metcalfe 1980), we computed the ellipticity () and the position angle of the major axis (). Using the 49 red galaxies at Mpc, we obtained and deg. This ENE-WSW direction agrees with the direction joining the two BCGs and the elongation of the X-ray isophotes in the central region (see Fig. 1 and Clavico et al. 2019). This concordance is often found in clusters with evidence of past merger (e.g., Barrena et al. 2014). Since the two BCGs have the same line–of–sight velocity, their relative motion can only take place in the plane of the sky.
The fact that the two BCGs themselves are strongly elongated may also suggest that the axis connecting the two BCGs lies in the plane of the sky. Moreover, they are both aligned with the cluster. The alignment of dominant galaxies with the parent cluster has been reported by numerous authors (see Joachimi et al. 2015 for a review), but in the literature there is not a particular emphasis on clusters showing two dominant galaxies. Indeed, the second brightest galaxy is found to be very weakly aligned with the first one (e.g., Trevese et al. 1992; Niederste-Ostholt et al. 2010). Two close galaxies are expected to become aligned if they are influenced by the same gravitational forces, or if the galactic cannibalism scenario has a preferred direction. In any case, these mechanisms can be related also with the large scale structure since dominant galaxies are found to be aligned with the neighboring clusters on scales of several tens of Mpc (e.g., West 1994) and the alignment of dominant galaxies is found to be robust against major cluster mergers (Wittman et al. 2019). Therefore, the elongation of the two BCGs and their alignment with the cluster structure are not useful to fix the time when the two BCGs, and the likely related subclusters, joined into forming the present cluster.
Clavico et al. (2019) claims that the ICM in the central part of RXCJ1825 is going to relax. The inspection of the TNG image of the two dominant galaxies can add some support to this point, in fact suggests that there is an extra light in the region between the two BCGs (see Fig. 2). This intracluster light can be taken as an evidence that the two galaxies have already interacted, that is the real/deprojected velocity is small and that we are catching RXCJ1825 in a very advanced phase of formation.
Another trace of cluster assembly in RXCJ1825 is the detection of a substructure at Mpc North–East of the center (RXCJ1825NE). It is a poorly dense substructure with no peculiarity in the velocity. It is also detected in the analysis of red galaxies so it might be a small merging group but also the remnant of a more important past merger. Very interestingly, this substructure at North–East and the SG galaxy discussed below trace the same direction through the cluster center, thus suggesting that NE-SW may be another direction of cluster accretion.
We also report the presence of an overdensity of high velocity galaxies in the region between RXCJ1825 and CIZAJ1824 (MiddlePeak). This overdensity is mostly related to blue galaxies (cfr. Figs. 7 and 8 – lower panel), thus suggesting the presence of a few galaxies or a loose group just infalling from the field onto the Lyra system and there projected.
As for CIZAJ1824, the BCG-CC is very luminous, with a magnitude value intermediate between those of BCG-E and BCG-W. It is elongated in the North–South direction, slightly NNE-SSW, in the same direction as the X-ray isophotes (see Fig. 1). Clavico et al. (2019) report an entropy value of keV cm2 in the central region and one would expect that a BCG-CC surrounded by this low entropy cool core were characterized by H emission (Cavagnolo et al. 2008). Instead, the spectrum of BCG-CC does now show trace of emission lines, in particular no H line is detected (see Fig. 17). Thus CIZAJ1824 is one of the few clusters with low entropy and no H emission, a rare exception to the much larger trend (see Fig. 1 of Cavagnolo et al. 2008).

Our estimates of the velocity dispersion of RXCJ1825 and CIZAJ1824 galaxy populations are km sand km s-1, respectively. For each clusters, can be compared with the estimates of the average X–ray temperature, keV and keV (Clavico et al. 2019), computing the value of , with the mean molecular weight and the proton mass. We obtained and for RXCJ1825 and CIZAJ1824 respectively, that is a two-sigma agreement with , the equipartition of energy per unit mass in galaxies and ICM (see also Figs. 12 and 13, bottom panels).
RXCJ1825 is found to be a massive cluster, and CIZAJ1824 a low mass cluster, . Our mass estimates for RXCJ1825 and CIZAJ1824 are in agreement with those based on X-ray data within uncertainties ( and , Clavico et al. 2019).
8.3 SG and RG in the SW region
The analysis of Clavico et al. (2019) shows a clear excess of diffuse X-ray emission South–West of RXCJ1825, in the same direction of SG. They suggest that this is related to a recent merger where a group, now traced by its central galaxy SG, has interacted with RXCJ1825 and is in an advanced state of disruption. This picture is also well in agreement with the presence of an elongation of the radio halo just in the same direction (Botteon et al. 2019). We find that the South–West region of the velocity field is very peculiar for its high velocity and the SG galaxy, there embedded, is the fifth brightest galaxy of the Lyra field.
Notice that, although the South–West and CIZAJ1824 regions are characterized by similar line–of–sight velocities, the geometry and kinematics is likely to be completely different. Assuming that SG is outgoing from RXCJ1825, SG is on the back of RXCJ1825 running out from RXCJ1825, while CIZAJ1824 is in the front and incoming. Looking at Fig. 12 one might doubt that SG is a galaxy really bound to RXCJ1825. To better understand the fate of SG, we recomputed the caustics for a toy-model cluster, that is that the “future” system formed of RXCJ1825 and CIZAJ1824, where we consider the mass of the whole system . SG lies well inside the caustics, that is SG is likely to be bound to the Lyra system.
As for the search of possible companion galaxies of SG, our redshift data poorly sample the South–West region and we success in detecting a galaxy overdensity close to SG only when applying the 2D-DEDICA analysis to photometric members (see Fig. 6). We need more redshift data around SG to be more conclusive. However, the fact that we fail in detecting a round, dense group of galaxies around SG might be not so unexpected due to the disruption of the group itself. In fact, it is well known that an interaction between two systems can enhances the internal energy of the individual systems, which may react losing part of their particles (Binney & Tremaine 1987, see chapter 7.2). In fact, from the observational side, there is a plethora of features claimed to be the remnants of past mergers, such as a group partially destroyed ejecting its central galaxy (Colless & Dunn 1996), a plume of outflying galaxies (Flores et al. 2000), a tidal debris stripped from the main cluster (Owers et al. 2011). Very likely, the mean velocity of the lost companion galaxies should be about that of the barycenter, in our case that of SG. These lost companions might be the cause of the high velocity excess in the SW region.
Considering galaxies with velocities higher than that of SG, we detect a stretched structure going from RXCJ1825 to SG (see Fig. 11). However, a very detailed analysis of X-ray data suggests that two of these are just at the beginning of their interaction with the ICM of RXCJ1825 and thus likely not part of the same group of SG (see Clavico et al. 2019 for details).
Finally, we discuss RG, the tailed radio-galaxy lying South of CIZAJ1824 and discovered by Botteon et al. (2019). RG is characterized by a velocity similar to that of BCG-CC and results well bound to the Lyra complex. Due to the presence of the tails we expect that RG is just interacting with the ICM, although it is not clear if the ICM of CIZAJ1824 or RXCJ1825. Herebelow we discuss two possible alternative scenarios. The direction suggested by the tails points slightly at West of RXCJ1825 (see Botteon et al. 2019), thus RG might be related to this cluster. In this case it is in front of RXCJ1825 running toward it. Alternatively, the pointing of its direction is not so important and RG is moving toward CIZAJ1824 with a partially tangential orbit. Indeed, the RG velocity is so close to the velocity of BCG-CC, differing for only 230 km sin the rest frame, that the motion of RG is likely taking place mostly in the plane of sky. In this case the real distance of RG from the CIZAJ1824 center is similar to the projected distance, Mpc, and thus RG is embedded inside the region of CIZAJ1824. With present data we cannot discriminate between the two scenarios and we suggest to think at RG as a galaxy which is infalling toward the whole Lyra complex.
9 Summary and conclusions
We present the first dynamical analysis of the Lyra complex, formed of two clusters of galaxies RXCJ1825 and CIZAJ1824, as based on the kinematics of member galaxies. New spectroscopic data for 285 galaxies were acquired at TNG and PanSTARRS magnitudes r, g, i were used. We selected 198 cluster members we used for most our analyses. Herebelow we list our main results and conclusions:
-
1.
Our analysis of the galaxy distribution well detects RXCJ1825 and CIZAJ1824 as individual units, at the distance of and points out that RXCJ1825 is more populated and more dense of CIZAJ1824 suggesting a mass ratio in the range from 2:1 to 4:1.
-
2.
The redshifts of RXCJ1825 and CIZAJ1824 are and . We report the first estimates of velocity dispersion, km sand km s-1, for RXCJ1825 and CIZAJ1824, respectively. Following the recipe of Munari et al. (2013), our estimates of dynamical mass are and , with a 3:1 mass ratio, in agreement with the point above.
-
3.
When assuming that cosmological distance is given by the redshift of the whole Lyra system, , the line–of–sight velocity difference and the projected distance between RXCJ1825 and CIZAJ1824 are km sand Mpc. A dynamical analysis indicates that clusters are likely to be gravitationally bound and that CIZAJ1824 lies in front of RXCJ1825 and running toward it. The specific case with the projection angle ∘ leads to collision parameters quite reasonable, in particular the -regions of the two clusters are just in touch but not compenetrated, in agreement with that no relevant interaction is detected in the X-ray data (Clavico et al. 2019). The future cluster is expected to be very massive, with a mass value in the 1.5-3 range.
-
4.
RXCJ1825 is found to be not relaxed and we have evidence that the likely merger related to the two dominant galaxies, a very past merger according to Clavico et al. (2019), lies in the plane of the sky along the East-West, slightly ENE-WSW, direction. The merger is also supported by the detection of a radio halo (Botteon et al. 2019).
-
5.
The South–West region of the velocity field, where the high-velocity and luminous galaxy SG in embedded, is very peculiar for its high velocity, comparable to that of CIZAJ1824. We show that this is not expected in a model where there are only the two clusters. Rather, it suggests the presence of an additional population of high velocity galaxies. This supports the suggestion of Clavico et al. (2019) that SG was the central galaxy of a group just disrupted by its interaction with RXCJ1825, an interaction causing the elongation of X-ray isophotes toward the SW direction, the same direction of the extension of the radio halo (Botteon et al. 2019).
Our results shows that the Lyra region hosts a very complex, just assembling galaxy structure, in agreement with the picture delineated from recent radio and X-ray studies (Botteon et al. 2019; Clavico et al. 2019). From the optical side, new improvements can be obtained collecting redshifts for a larger field in such way to study RXCJ1825 at least out to its radius, adding many more redshifts in the South–West region, and acquiring spectra at higher resolution, thus using detailed spectral features to study the evolution of galaxies in this interesting environment.
Acknowledgements.
We thank the referee for useful and constructive comments. We thank Andrea Botteon and Rossella Cassano for useful discussions and the access to their LOFAR radio contours previous than the publication. We thank Barbara Sartoris for an useful cosmological input.M.G. acknowledges financial support from the grant MIUR PRIN 2015 “Cosmology and Fundamental Physics: illuminating the Dark Universe with Euclid” and from the University of Trieste through the program “Finanziamento di Ateneo per progetti di ricerca scientifica - FRA 2018”.
This publication is based on observations made on the island of La Palma with the Italian Telescopio Nazionale Galileo (TNG), which is operated by the Fundación Galileo Galilei – INAF (Istituto Nazionale di Astrofisica) and is located in the Spanish Observatorio of the Roque de Los Muchachos of the Instituto de Astrofísica de Canarias.
This research has made use of the galaxy catalog of The Pan-STARRS Survey (DR1) and its public science archive. They have been made possible through contributions by the Institute for Astronomy, the University of Hawaii, the Pan-STARRS Project Office, the Max-Planck Society and its participating institutes, the Max Planck Institute for Astronomy, Heidelberg and the Max Planck Institute for Extraterrestrial Physics, Garching, The Johns Hopkins University, Durham University, the University of Edinburgh, the Queen’s University Belfast, the Harvard-Smithsonian Center for Astrophysics, the Las Cumbres Observatory Global Telescope Network Incorporated, the National Central University of Taiwan, the Space Telescope Science Institute, the National Aeronautics and Space Administration under Grant No. NNX08AR22G issued through the Planetary Science Division of the NASA Science Mission Directorate, the National Science Foundation Grant No. AST-1238877, the University of Maryland, Eotvos Lorand University (ELTE), the Los Alamos National Laboratory, and the Gordon and Betty Moore Foundation.
References
- Adami et al. (2018) Adami, C., Giles, P., Koulouridis, E., et al. 2018, A&A, 620, A5
- Ashman et al. (1994) Ashman, K. M., Bird, C. M., & Zepf, S. E. 1994, AJ, 108, 2348
- Athreya et al. (2002) Athreya, R. M., Mellier, Y., van Waerbeke, L., et al. 2002, A&A, 384, 743
- Bahcall et al. (1986) Bahcall, N. A., Soneira, R. M., & Burgett, W. S. 1986, ApJ, 311, 15
- Baier & Ziener (1977) Baier, F. W. & Ziener, R. 1977, Astronomische Nachrichten, 298, 87
- Balestra et al. (2016) Balestra, I., Mercurio, A., Sartoris, B., et al. 2016, ApJS, 224, 33
- Barrena et al. (2014) Barrena, R., Girardi, M., Boschin, W., De Grandi, S., & Rossetti, M. 2014, MNRAS, 442, 2216
- Barrena et al. (2012) Barrena, R., Girardi, M., Boschin, W., & Mardirossian, F. 2012, A&A, 540, A90
- Beers et al. (1990) Beers, T. C., Flynn, K., & Gebhardt, K. 1990, AJ, 100, 32
- Beers et al. (1982) Beers, T. C., Geller, M. J., & Huchra, J. P. 1982, ApJ, 257, 23
- Berrier et al. (2009) Berrier, J. C., Stewart, K. R., Bullock, J. S., et al. 2009, ApJ, 690, 1292
- Binney & Tremaine (1987) Binney, J. & Tremaine, S. 1987, Galactic dynamics (Princeton Univ Press)
- Biviano & Girardi (2003) Biviano, A. & Girardi, M. 2003, ApJ, 585, 205
- Biviano et al. (2006) Biviano, A., Murante, G., Borgani, S., et al. 2006, A&A, 456, 23
- Boschin et al. (2013) Boschin, W., Girardi, M., & Barrena, R. 2013, MNRAS, 434, 772
- Boschin et al. (2006) Boschin, W., Girardi, M., Spolaor, M., & Barrena, R. 2006, A&A, 449, 461
- Botteon et al. (2019) Botteon, A., Cassano, R., Eckert, D., et al. 2019, A&A, 630, A77
- Carter & Metcalfe (1980) Carter, D. & Metcalfe, N. 1980, MNRAS, 191, 325
- Cavagnolo et al. (2008) Cavagnolo, K. W., Donahue, M., Voit, G. M., & Sun, M. 2008, ApJ, 683, L107
- Clavico et al. (2019) Clavico, S., De Grandi, S., Ghizzardi, S., et al. 2019, arXiv e-prints, arXiv:1908.02276
- Colberg et al. (1999) Colberg, J. M., White, S. D. M., Jenkins, A., & Pearce, F. R. 1999, MNRAS, 308, 593
- Colless & Dunn (1996) Colless, M. & Dunn, A. M. 1996, ApJ, 458, 435
- Dahle et al. (2002) Dahle, H., Kaiser, N., Irgens, R. J., Lilje, P. B., & Maddox, S. J. 2002, ApJS, 139, 313
- Danese et al. (1980) Danese, L., de Zotti, G., & di Tullio, G. 1980, A&A, 82, 322
- den Hartog & Katgert (1996) den Hartog, R. & Katgert, P. 1996, MNRAS, 279, 349
- Dolag et al. (2004) Dolag, K., Bartelmann, M., Perrotta, F., et al. 2004, A&A, 416, 853
- Dressler & Shectman (1988) Dressler, A. & Shectman, S. A. 1988, AJ, 95, 985
- Durret et al. (2010) Durret, F., Laganá, T. F., Adami, C., & Bertin, E. 2010, A&A, 517, A94
- Ebeling et al. (2002) Ebeling, H., Mullis, C. R., & Tully, R. B. 2002, ApJ, 580, 774
- Eckert et al. (2017) Eckert, D., Ettori, S., Pointecouteau, E., et al. 2017, Astronomische Nachrichten, 338, 293
- Eckert et al. (2019) Eckert, D., Ghirardini, V., Ettori, S., et al. 2019, A&A, 621, A40
- Eke et al. (1996) Eke, V. R., Cole, S., & Frenk, C. S. 1996, MNRAS, 282, 263
- Ettori et al. (2019) Ettori, S., Ghirardini, V., Eckert, D., et al. 2019, A&A, 621, A39
- Fadda et al. (1996) Fadda, D., Girardi, M., Giuricin, G., Mardirossian, F., & Mezzetti, M. 1996, ApJ, 473, 670
- Feretti (1999) Feretti, L. 1999, in Diffuse Thermal and Relativistic Plasma in Galaxy Clusters, ed. H. Boehringer, L. Feretti, & P. Schuecker, 3
- Flores et al. (2000) Flores, R. A., Quintana, H., & Way, M. J. 2000, ApJ, 532, 206
- Geller & Beers (1982) Geller, M. J. & Beers, T. C. 1982, PASP, 94, 421
- Ghirardini et al. (2019) Ghirardini, V., Eckert, D., Ettori, S., et al. 2019, A&A, 621, A41
- Girardi et al. (2011) Girardi, M., Bardelli, S., Barrena, R., et al. 2011, A&A, 536, A89
- Girardi et al. (2008) Girardi, M., Barrena, R., Boschin, W., & Ellingson, E. 2008, A&A, 491, 379
- Girardi & Biviano (2002) Girardi, M. & Biviano, A. 2002, in Astrophysics and Space Science Library, Vol. 272, Merging Processes in Galaxy Clusters, ed. L. Feretti, I. M. Gioia, & G. Giovannini, 39–77
- Girardi et al. (1995) Girardi, M., Biviano, A., Giuricin, G., Mardirossian, F., & Mezzetti, M. 1995, ApJ, 438, 527
- Girardi et al. (2000) Girardi, M., Borgani, S., Giuricin, G., Mardirossian, F., & Mezzetti, M. 2000, ApJ, 530, 62
- Girardi et al. (2010) Girardi, M., Boschin, W., & Barrena, R. 2010, A&A, 517, A65
- Girardi et al. (2016) Girardi, M., Boschin, W., Gastaldello, F., et al. 2016, MNRAS, 456, 2829
- Girardi et al. (1997) Girardi, M., Escalera, E., Fadda, D., et al. 1997, ApJ, 482, 41
- Girardi et al. (1996) Girardi, M., Fadda, D., Giuricin, G., et al. 1996, ApJ, 457, 61
- Girardi et al. (1998) Girardi, M., Giuricin, G., Mardirossian, F., Mezzetti, M., & Boschin, W. 1998, ApJ, 505, 74
- Girardi et al. (2015) Girardi, M., Mercurio, A., Balestra, I., et al. 2015, A&A, 579, A4
- Golovich et al. (2017) Golovich, N., van Weeren, R. J., Dawson, W. A., Jee, M. J., & Wittman, D. 2017, ApJ, 838, 110
- Goto et al. (2002) Goto, T., Sekiguchi, M., Nichol, R. C., et al. 2002, AJ, 123, 1807
- Gregory & Thompson (1984) Gregory, S. A. & Thompson, L. A. 1984, ApJ, 286, 422
- Hughes et al. (1995) Hughes, J. P., Birkinshaw, M., & Huchra, J. P. 1995, ApJ, 448, L93
- Joachimi et al. (2015) Joachimi, B., Cacciato, M., Kitching, T. D., et al. 2015, Space Sci. Rev., 193, 1
- Jones & Forman (1999) Jones, C. & Forman, W. 1999, ApJ, 511, 65
- Kocevski et al. (2007) Kocevski, D. D., Ebeling, H., Mullis, C. R., & Tully, R. B. 2007, ApJ, 662, 224
- Lauer et al. (2014) Lauer, T. R., Postman, M., Strauss, M. A., Graves, G. J., & Chisari, N. E. 2014, ApJ, 797, 82
- Limber & Mathews (1960) Limber, D. N. & Mathews, W. G. 1960, ApJ, 132, 286
- Lopes (2007) Lopes, P. A. A. 2007, MNRAS, 380, 1608
- Lubin et al. (2000) Lubin, L. M., Brunner, R., Metzger, M. R., Postman, M., & Oke, J. B. 2000, ApJ, 531, L5
- Markevitch et al. (2004) Markevitch, M., Gonzalez, A. H., Clowe, D., et al. 2004, ApJ, 606, 819
- Markevitch et al. (2002) Markevitch, M., Gonzalez, A. H., David, L., et al. 2002, ApJ, 567, L27
- Maurogordato et al. (2011) Maurogordato, S., Sauvageot, J. L., Bourdin, H., et al. 2011, A&A, 525, A79
- McGee et al. (2009) McGee, S. L., Balogh, M. L., Bower, R. G., Font, A. S., & McCarthy, I. G. 2009, MNRAS, 400, 937
- Molnar et al. (2013) Molnar, S. M., Chiu, I. N. T., Broadhurst, T., & Stadel, J. G. 2013, ApJ, 779, 63
- Munari et al. (2013) Munari, E., Biviano, A., Borgani, S., Murante, G., & Fabjan, D. 2013, MNRAS, 430, 2638
- NAG Fortran Workstation Handbook (1986) NAG Fortran Workstation Handbook. 1986, NAG Fortran Workstation Handbook (Downers Grove, IL: Numerical Algorithms Group)
- Navarro et al. (1997) Navarro, J. F., Frenk, C. S., & White, S. D. M. 1997, ApJ, 490, 493
- Niederste-Ostholt et al. (2010) Niederste-Ostholt, M., Strauss, M. A., Dong, F., Koester, B. P., & McKay, T. A. 2010, MNRAS, 405, 2023
- Olave-Rojas et al. (2018) Olave-Rojas, D., Cerulo, P., Demarco, R., et al. 2018, MNRAS, 479, 2328
- Owers et al. (2013) Owers, M. S., Baldry, I. K., Bauer, A. E., et al. 2013, ApJ, 772, 104
- Owers et al. (2011) Owers, M. S., Nulsen, P. E. J., & Couch, W. J. 2011, ApJ, 741, 122
- Pisani (1993) Pisani, A. 1993, MNRAS, 265, 706
- Pisani (1996) Pisani, A. 1996, MNRAS, 278, 697
- Planck Collaboration et al. (2014) Planck Collaboration, Ade, P. A. R., Aghanim, N., et al. 2014, A&A, 571, A8
- Plionis & Basilakos (2002) Plionis, M. & Basilakos, S. 2002, MNRAS, 329, L47
- Popesso et al. (2005) Popesso, P., Biviano, A., Böhringer, H., Romaniello, M., & Voges, W. 2005, A&A, 433, 431
- Proctor et al. (2015) Proctor, R. N., Mendes de Oliveira, C., Azanha, L., Dupke, R., & Overzier, R. 2015, MNRAS, 449, 2345
- Rines et al. (2013) Rines, K., Geller, M. J., Diaferio, A., & Kurtz, M. J. 2013, ApJ, 767, 15
- Roettiger et al. (1997) Roettiger, K., Loken, C., & Burns, J. O. 1997, ApJS, 109, 307
- Sarazin (2002) Sarazin, C. L. 2002, in Astrophysics and Space Science Library, Vol. 272, Merging Processes in Galaxy Clusters, ed. L. Feretti, I. M. Gioia, & G. Giovannini, 1–38
- Serna & Gerbal (1996) Serna, A. & Gerbal, D. 1996, A&A, 309, 65
- Small et al. (1998) Small, T. A., Ma, C.-P., Sargent, W. L. W., & Hamilton, D. 1998, ApJ, 492, 45
- Springel & Farrar (2007) Springel, V. & Farrar, G. R. 2007, MNRAS, 380, 911
- Springel et al. (2006) Springel, V., Frenk, C. S., & White, S. D. M. 2006, Nature, 440, 1137
- Tonry & Davis (1979) Tonry, J. & Davis, M. 1979, AJ, 84, 1511
- Trevese et al. (1992) Trevese, D., Cirimele, G., & Flin, P. 1992, AJ, 104, 935
- Tribble (1993) Tribble, P. C. 1993, MNRAS, 263, 31
- Vikhlinin et al. (2009) Vikhlinin, A., Burenin, R. A., Ebeling, H., et al. 2009, ApJ, 692, 1033
- Voges et al. (1999) Voges, W., Aschenbach, B., Boller, T., et al. 1999, A&A, 349, 389
- West (1994) West, M. J. 1994, MNRAS, 268, 79
- Wittman et al. (2019) Wittman, D., Foote, D., & Golovich, N. 2019, ApJ, 874, 84
- Zabludoff & Mulchaey (1998) Zabludoff, A. I. & Mulchaey, J. S. 1998, ApJ, 496, 39