iint \restoresymbolTXFiint
A dominant population of optically invisible massive galaxies in the early Universe
Abstract
Our current knowledge of cosmic star-formation history during the first two billion years (corresponding to redshift ) is mainly based on galaxies identified in rest-frame ultraviolet lightMadau:2014. However, this population of galaxies is known to under-represent the most massive galaxies, which have rich dust content and/or old stellar populations. This raises the questions of the true abundance of massive galaxies and the star-formation-rate density in the early universe. Although several massive galaxies that are invisible in the ultraviolet have recently been confirmed at early epochsWalter:2012, Riechers:2013, Marrone:2018, most of them are extreme starbursts with star-formation rates exceeding 1000 solar masses per year, suggesting that they are unlikely to represent the bulk population of massive galaxies. Here we report submillimeter (wavelength 870 m) detections of 39 massive star-forming galaxies at , which are unseen in the spectral region from the deepest ultraviolet to the near-infrared. With a space density of about per cubic megaparsec (two orders of magnitudes higher than extreme starburstsDowell:2014) and star-formation rates of 200 solar masses per year, these galaxies represent the bulk population of massive galaxies that have been missed from previous surveys. They contribute a total star-formation- rate density ten times larger than that of equivalently massive ultraviolet-bright galaxies at . Residing in the most massive dark matter halos at their redshifts, they are probably the progenitors of the largest present-day galaxies in massive groups and clusters. Such a high abundance of massive and dusty galaxies in the early universe challenges our understanding of massive-galaxy formation.
Institute of Astronomy, Graduate School of Science, The University of Tokyo, Tokyo, Japan
AIM, CEA, CNRS, Université Paris Diderot, Saclay, Sorbonne Paris Cité, Gif-sur-Yvette, France
National Astronomical Observatory of Japan, Mitaka, Tokyo, Japan
Leiden Observatory, Leiden University, Leiden, The Netherlands
Department of Physics, University of Oxford, Oxford, UK
Research Center for the Early Universe, Graduate School of Science, Tokyo, Japan
Department of Physics, Anhui Normal University, Wuhu, China
Faculty of Physics, Ludwig-Maximilians-Universität, Munich, Germany
National Astronomical Observatories of China, Chinese Academy of Sciences, Beijing, China
Academia Sinica Institute of Astronomy and Astrophysics, Taipei,, Taiwan
Graduate Institute of Astrophysics, National Taiwan University, Taipei, Taiwan
Observations of galaxies across cosmic time have revealed that more massive galaxies have assembled their stellar masses at earlier epochs, with a significant population of massive ellipticals already in place at redshifts Glazebrook:2017, Schreiber:2018c, Spitler:2014. The early assembly of these massive galaxies has posed serious challenges to current galaxy formation theories. Understanding their formation processes requires studies of their progenitors formed at even higher redshifts. However, most currently known high-redshift galaxies, including mainly Lyman-break galaxies (LBGs) and few extreme starbursts, are found inadequate to account for the large population of these early formed ellipticals, due to either low stellar masses and star formation rates, SFRs (for LBGsWilliams:2014) or low space densities (for the extreme starbursts). This suggests that the main progenitors of massive galaxies at remain to be found. Identification of these currently missing massive galaxies is key to our understanding of both massive-galaxy formation and the cosmic SFR density in the early universe.
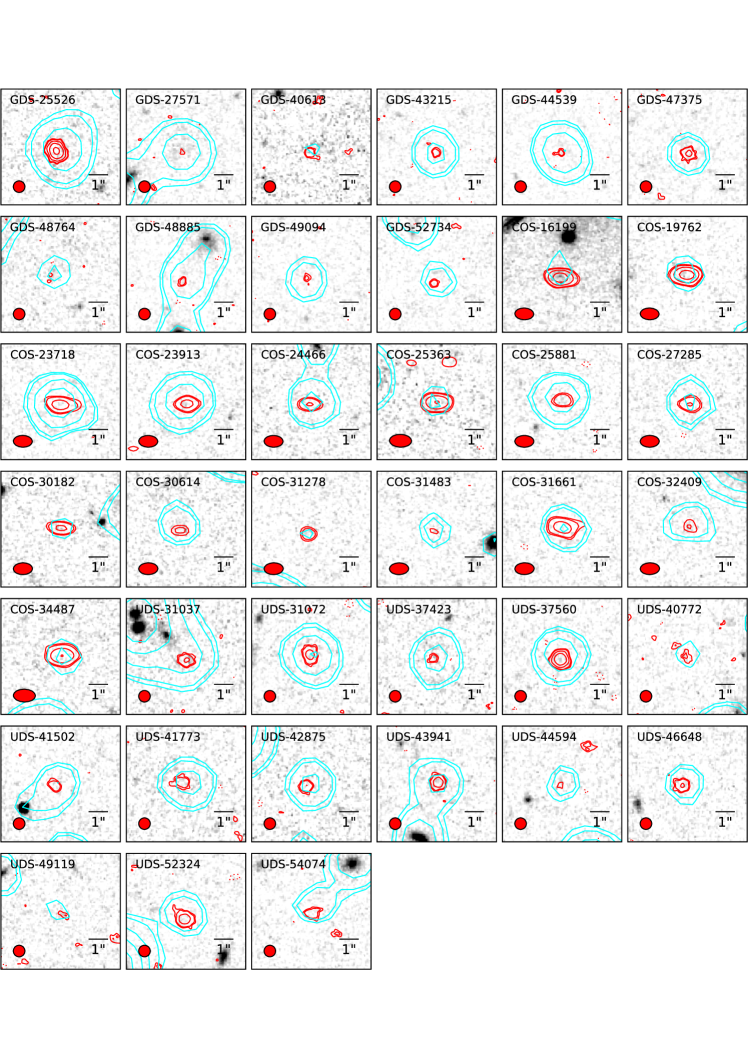
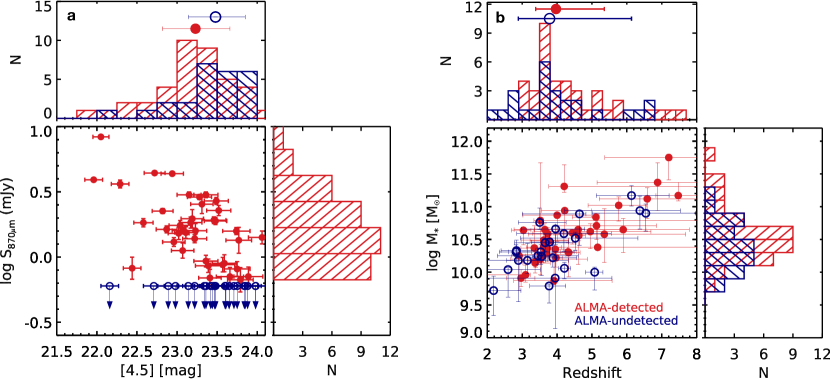
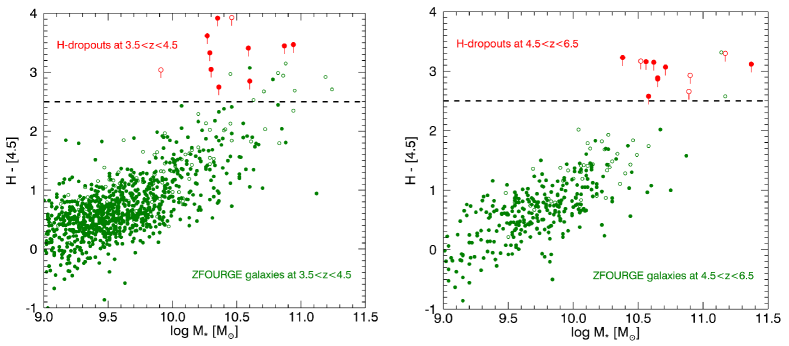
The main targets of this study are a population of galaxies that are Spitzer/Infrared Array Camera (IRAC)-bright yet undetected in even the deepest near-infrared (NIR: H-band) imaging with Hubble Space Telescope (HST), that is, H-dropouts. (Throughout this Letter we use the short form “Telescope/Instrument” to represent usage of a particular instrument on a particular telescope.) In total, we have identified 63 dropouts with IRAC 4.5-m magnitude, [4.5], less than 24 mag, within a total survey area of arcmin2 in deep CANDELS fields with typical depth of H mag (5)(Fig. 1, Extended Data Table 1, Methods). Although previous studies have shown that these bright and red IRAC sources are promising candidates for massive galaxies atHuangJ:2011, WangT:2016a , confirming their nature has been difficult so far owing to the limited sample size, the poor resolution of Spitzer and the lack of multiwavelength information. Here we explore their nature with high-resolution, 870 m continuum imaging with the Atacama Large Millimeter/submillimeter Array (ALMA). With only 1.8 min of integration per object, 39 of them (detection rates of 62%) are detected down to an integrated flux of 0.6 mJy (4, Extended Data Fig. 1, Extended Data Table 2). Their 870-m fluxes range from 0.6 mJy to 8 mJy, with a median of =1.6 mJy (Extended Data Fig. 2). Hence most of them are fainter than the 2-mJy confusion limit of the single dish instruments that discovered submillimeter galaxies (SMGs), and much fainter than most SMGs studied until now with typicalSwinbank:2014 mJy. The sky density of these ALMA-detected H-dropouts is approximately deg-2 after correction for incompleteness (Methods), two orders of magnitude higher than Herschel/SPIRE-selected extreme starbursts (with SFR yr-1) Riechers:2013, Dowell:2014.
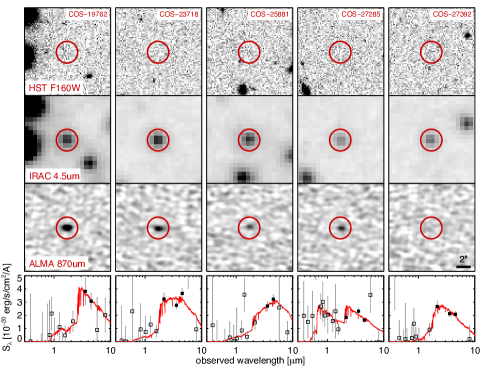
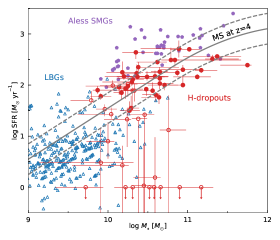
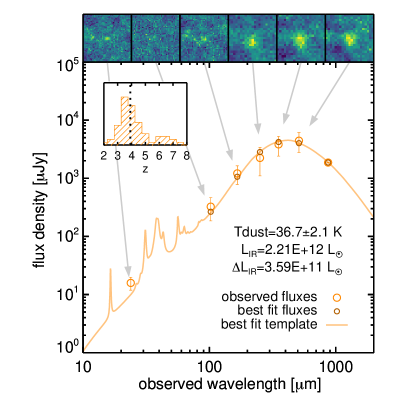
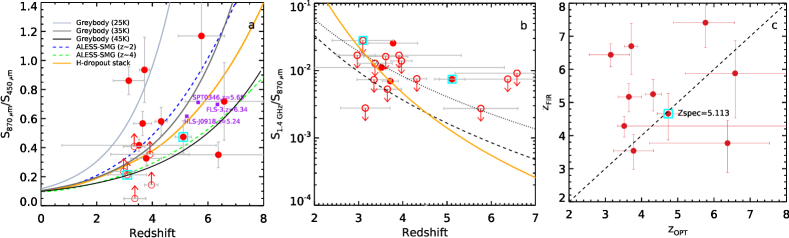
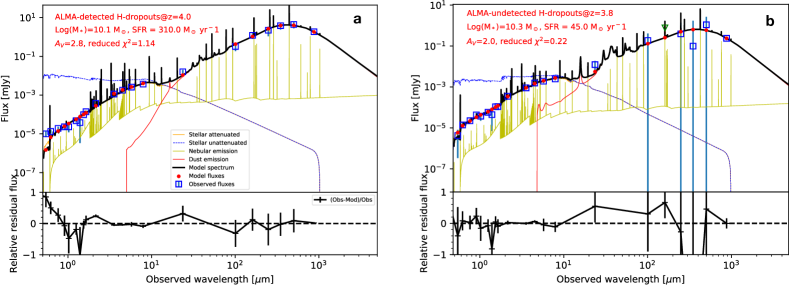
The ALMA detections confirm unambiguously that most of the H-dropouts are dusty star-forming galaxies at high redshifts, consistent with their admittedly uncertain photometric redshifts–from optical spectral energy distribution (SED) fitting–with median redshift (Extended Data Fig. 3). Further insights into their properties are obtained from the stacked infrared (IR) SED of the 39 ALMA-detected H-dropouts from MIPS 24 m up to ALMA 870 m. The stacked SED peaks between the observed 350 and 500 m (Extended Data Figure 3), consistent with being at . With a median stellar mass of and a characteristic IR luminosity (over m) of (, solar luminosity) derived from the stacked SED, these ALMA-detected H-dropouts are fully consistent with being normal massive star-forming galaxies atSchreiber:2018a (Fig. 2). Moreover, the ALMA detections also provide crucial constrains on the redshift of individual galaxies. Combined with SCUBA-2 450 m and VLA 3 GHz data, the majority of the ALMA-detected H-dropouts exhibit red and colors that are suggestive of redshifts of (Extended Data Fig. 4). Similarly, the non-detections at 24 m (5 detection limit of 20 Jy) for most of the sources implies red colors that are also consistent with assuming typical SED templatesDaddi:2009a. We hence conclude that whereas the estimated redshifts for individual galaxies exhibit a large uncertainty, all the available data points to the ALMA-detected H-dropouts being massive, dusty star-forming galaxies at .
For the remaining approximately of H-dropouts that are not detected with ALMA, photometric redshift estimates based on their optical SEDs suggest a similar redshift distribution to that of ALMA-detected ones, with (Extended Data Figure 2). Their stacked ALMA 870 m image yields a detection with mJy, approximately 8 times lower than that of ALMA-detected ones, suggesting lower specific SFRs compared to ALMA-detected ones, which is also confirmed by a full fitting of the stacked optical-to-IR SEDs (Extended Data Fig. 5).
Spectroscopic confirmation of H-dropouts has been so far limited to a few sources, which are all found at . Most of these confirmed cases are extreme SMGs with mJy, for examplez = 5.18. An H-dropout galaxy with submillimeter flux similar to that of our sample ( mJy) has been recently confirmedSchreiber:2018b to be at : it was discovered serendipitously near a quiescent galaxy at the same redshift Glazebrook:2017. By targeting 3 H-dropouts in our sample that show significant excess (, Methods) in Subaru medium bands in the optical ( 3500-6000 Å) with VLT/X-shooter, we have successfully detected Lyman- for two of them and confirmed their redshifts to be ( and , Extended Data Fig. 6). These spectroscopic redshifts ( are in good agreement with their photometric redshift () based on UV-to-NIR SED fitting, with .
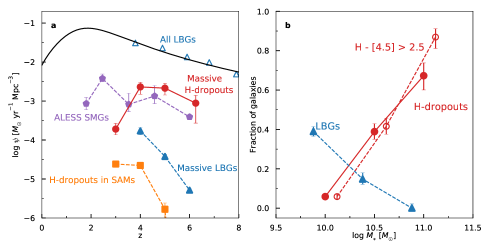
Having established that most of the H-dropouts are massive galaxies at , we now derive their contribution to the cosmic SFR density and stellar mass function. Whereas populations of similarly red galaxy populations are known to exist at lower redshiftsRiguccini:2015, these largely overlap with the stellar-mass-limited sample used to estimate the SFR density at . Assuming that the intrinsic infrared SED of the ALMA-detected H-dropouts is the same as the SED derived from stacking, the SFR density of ALMA-detected H-dropouts (in 10 yr-1 Mpc-3) reaches about 2.9, 2.1, and 0.9 at 4, 5, 6, respectively, or approximately 1.6 yr-1 Mpc-3 when averaged over the three bins (Fig. 3). This corresponds to about 10% of the SFR density from LBGs at similar redshiftsBouwens:2012. However, if we focus only on LBGs with masses similar to those of dropouts with , the SFR densities of dropouts are one to two orders of magnitude higher, demonstrating that H-dropouts dominate the SFR density in massive galaxies. This dominance is further reflected in the stellar mass functions, as shown in Fig. 3. The fraction of -dropout becomes progressively higher at higher masses. At , the number density of -dropout surpasses that of LBGs. Moreover, if we also include galaxies detected in band but which show similar red colors (, Extended Data Fig. 7)Spitler:2014, WangT:2016a, they make up more than than 80% of the most massive galaxies at . Taken together, these results suggest that the majority of the most massive galaxies at have indeed been missed from the LBG selection, and are optically dark.
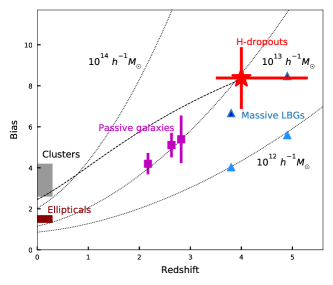
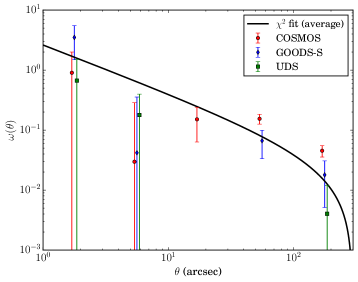
To put the H-dropouts in the context of the cosmic evolution of massive galaxies, we probe their clustering properties through their cross-correlation with -detected galaxies at from the CANDELS survey in the same three fields (Extended Data Fig. 8, Methods). The derived galaxy bias, that is, the relationship between the spatial distribution of galaxies and the underlying dark matter density field, for the H-dropouts is , corresponding to a dark matter halo mass of at (Fig. 4, Methods). This halo mass of H-dropouts is consistent with them being progenitors of the most massive quiescent galaxies at , as well as progenitors of today’s ellipticals that reside in the central region of massive groups and clusters.
The discovery and confirmation of these H-dropouts as massive galaxies at alleviates greatly the tension between the small number of massive LBGs at and the rapid emergence of massive (and quiescent) galaxies at . Assuming an average redshift of and SFR yr-1, these H-dropouts will grow in stellar mass by before . Their number density, Mpc-3, is also comparable to that of the most massive, quiescent galaxies at withStraatman:2014 . The early formation of such a large number of massive, dusty galaxies is unexpected with current semi-analytical modelsHenriques:2015, which underestimates their density by one to two orders of magnitude (Fig. 3). Similarly, a deficit of such galaxies is also present in hydrodynamic simulations, which contain no such galaxies at in mock deep fields ( arcmin2) from the Illustris Project Snyder:2017. Moreover, even considering LBGs alone, the number of massive galaxies already appears too large when compared to the number of massive halos at predictedSteinhardt:2016 by our current understanding of galaxy evolution in the Lambda Cold Dark Matter (LCDM) framework. Together, this unexpected large abundance of massive galaxies in the early Universe suggests that our understanding of massive-galaxy formation may require substantial revision. Spectroscopic follow-up of the whole population of H-dropouts would be key to providing further insights into this question, which calls for mid-infrared spectroscopy with James Webb Space Telescope in the near future.
References
- 1 \bibinfoauthorMadau, P. & \bibinfoauthorDickinson, M. \bibinfotitleCosmic Star-Formation History. \bibinfojournalARA&A \bibinfovolume52, \bibinfopages415–486 (\bibinfoyear2014).
- 2 \bibinfoauthorWalter, F. et al. \bibinfotitleThe intense starburst HDF 850.1 in a galaxy overdensity at z 5.2 in the Hubble Deep Field. \bibinfojournalNature \bibinfovolume486, \bibinfopages233–236 (\bibinfoyear2012).
- 3 \bibinfoauthorRiechers, D. A. et al. \bibinfotitleA dust-obscured massive maximum-starburst galaxy at a redshift of 6.34. \bibinfojournalNature \bibinfovolume496, \bibinfopages329–333 (\bibinfoyear2013).
- 4 \bibinfoauthorMarrone, D. P. et al. \bibinfotitleGalaxy growth in a massive halo in the first billion years of cosmic history. \bibinfojournalNature \bibinfovolume553, \bibinfopages51–54 (\bibinfoyear2018).
- 5 \bibinfoauthorDowell, C. D. et al. \bibinfotitleHerMES: Candidate High-redshift Galaxies Discovered with Herschel/SPIRE. \bibinfojournalApJ \bibinfovolume780, \bibinfopages75 (\bibinfoyear2014).
- 6 \bibinfoauthorGlazebrook, K. et al. \bibinfotitleA massive, quiescent galaxy at a redshift of 3.717. \bibinfojournalNature \bibinfovolume544, \bibinfopages71–74 (\bibinfoyear2017).
- 7 \bibinfoauthorSchreiber, C. et al. \bibinfotitleNear infrared spectroscopy and star-formation histories of 3 z 4 quiescent galaxies. \bibinfojournalA&A \bibinfovolume618, \bibinfopagesA85 (\bibinfoyear2018).
- 8 \bibinfoauthorSpitler, L. R. et al. \bibinfotitleExploring the z = 3-4 Massive Galaxy Population with ZFOURGE: The Prevalence of Dusty and Quiescent Galaxies. \bibinfojournalApJ \bibinfovolume787, \bibinfopagesL36 (\bibinfoyear2014).
- 9 \bibinfoauthorWilliams, C. C. et al. \bibinfotitleThe Progenitors of the Compact Early-type Galaxies at High Redshift. \bibinfojournalApJ \bibinfovolume780, \bibinfopages1 (\bibinfoyear2014).
- 10 \bibinfoauthorHuang, J.-S. et al. \bibinfotitleFour IRAC Sources with an Extremely Red H - [3.6] Color: Passive or Dusty Galaxies at z ¿ 4.5? \bibinfojournalApJ \bibinfovolume742, \bibinfopagesL13 (\bibinfoyear2011).
- 11 \bibinfoauthorWang, T. et al. \bibinfotitleInfrared Color Selection of Massive Galaxies at z 3. \bibinfojournalApJ \bibinfovolume816, \bibinfopages84 (\bibinfoyear2016).
- 12 \bibinfoauthorSwinbank, A. M. et al. \bibinfotitleAn ALMA survey of sub-millimetre Galaxies in the Extended Chandra Deep Field South: the far-infrared properties of SMGs. \bibinfojournalMNRAS \bibinfovolume438, \bibinfopages1267–1287 (\bibinfoyear2014).
- 13 \bibinfoauthorSchreiber, C. et al. \bibinfotitleDust temperature and mid-to-total infrared color distributions for star-forming galaxies at 0 z 4. \bibinfojournalA&A \bibinfovolume609, \bibinfopagesA30 (\bibinfoyear2018).
- 14 \bibinfoauthorDaddi, E. et al. \bibinfotitleTwo bright submillimeter galaxies in a z = 4.05 protocluster in GOODS-North, and accurate radio-infrared photometric redshifts. \bibinfojournalApJ \bibinfovolume694, \bibinfopages1517 (\bibinfoyear2009).
- 15 \bibinfoauthorSchreiber, C. et al. \bibinfotitleJekyll Hyde: quiescence and extreme obscuration in a pair of massive galaxies 1.5 Gyr after the Big Bang. \bibinfojournalA&A \bibinfovolume611, \bibinfopagesA22 (\bibinfoyear2018).
- 16 \bibinfoauthorRiguccini, L. et al. \bibinfotitleThe composite nature of Dust-Obscured Galaxies (DOGs) at z 2-3 in the COSMOS field - I. A far-infrared view. \bibinfojournalMNRAS \bibinfovolume452, \bibinfopages470–485 (\bibinfoyear2015).
- 17 \bibinfoauthorBouwens, R. J. et al. \bibinfotitleUV-continuum Slopes at z ~ 4-7 from the HUDF09+ERS+CANDELS Observations: Discovery of a Well-defined UV Color-Magnitude Relationship for z = 4 Star-forming Galaxies. \bibinfojournalApJ \bibinfovolume754, \bibinfopages83 (\bibinfoyear2012).
- 18 \bibinfoauthorStraatman, C. M. S. et al. \bibinfotitleA Substantial Population of Massive Quiescent Galaxies at z ~ 4 from ZFOURGE. \bibinfojournalApJ \bibinfovolume783, \bibinfopagesL14 (\bibinfoyear2014).
- 19 \bibinfoauthorHenriques, B. M. B. et al. \bibinfotitleGalaxy formation in the Planck cosmology - I. Matching the observed evolution of star formation rates, colours and stellar masses. \bibinfojournalMNRAS \bibinfovolume451, \bibinfopages2663–2680 (\bibinfoyear2015).
- 20 \bibinfoauthorSnyder, G. F. et al. \bibinfotitleMassive close pairs measure rapid galaxy assembly in mergers at high redshift. \bibinfojournalMNRAS \bibinfovolume468, \bibinfopages207–216 (\bibinfoyear2017).
- 21 \bibinfoauthorSteinhardt, C. L., \bibinfoauthorCapak, P., \bibinfoauthorMasters, D. & \bibinfoauthorSpeagle, J. S. \bibinfotitleThe Impossibly Early Galaxy Problem. \bibinfojournalApJ \bibinfovolume824, \bibinfopages21 (\bibinfoyear2016).
- 22 \bibinfoauthorStraatman, C. M. S. et al. \bibinfotitleThe FourStar Galaxy Evolution Survey (ZFOURGE): Ultraviolet to Far-infrared Catalogs, Medium-bandwidth Photometric Redshifts with Improved Accuracy, Stellar Masses, and Confirmation of Quiescent Galaxies to z 3.5. \bibinfojournalApJ \bibinfovolume830, \bibinfopages51 (\bibinfoyear2016).
- 23 \bibinfoauthorda Cunha, E. et al. \bibinfotitleAn ALMA Survey of Sub-millimeter Galaxies in the Extended Chandra Deep Field South: Physical Properties Derived from Ultraviolet-to-radio Modeling. \bibinfojournalApJ \bibinfovolume806, \bibinfopages110 (\bibinfoyear2015).
- 24 \bibinfoauthorSchreiber, C. et al. \bibinfotitleThe Herschel view of the dominant mode of galaxy growth from z = 4 to the present day. \bibinfojournalA&A \bibinfovolume575, \bibinfopagesA74 (\bibinfoyear2015).
- 25 \bibinfoauthorOno, Y. et al. \bibinfotitleGreat Optically Luminous Dropout Research Using Subaru HSC (GOLDRUSH). I. UV luminosity functions at z 4-7 derived with the half-million dropouts on the 100 deg2 sky. \bibinfojournalPASJ \bibinfovolume70, \bibinfopagesS10 (\bibinfoyear2018).
- 26 \bibinfoauthorHarikane, Y. et al. \bibinfotitleGOLDRUSH. II. Clustering of galaxies at z 4-6 revealed with the half-million dropouts over the 100 deg2 area corresponding to 1 Gpc3. \bibinfojournalPASJ \bibinfovolume70, \bibinfopagesS11 (\bibinfoyear2018).
- 27 \bibinfoauthorHartley, W. G. et al. \bibinfotitleStudying the emergence of the red sequence through galaxy clustering: host halo masses at z 2. \bibinfojournalMNRAS \bibinfovolume431, \bibinfopages3045–3059 (\bibinfoyear2013).
- 28 \bibinfoauthorMo, H. J. & \bibinfoauthorWhite, S. D. M. \bibinfotitleThe abundance and clustering of dark haloes in the standard CDM cosmogony. \bibinfojournalMNRAS \bibinfovolume336, \bibinfopages112–118 (\bibinfoyear2002).
- 29 \bibinfoauthorFakhouri, O., \bibinfoauthorMa, C.-P. & \bibinfoauthorBoylan-Kolchin, M. \bibinfotitleThe merger rates and mass assembly histories of dark matter haloes in the two Millennium simulations. \bibinfojournalMNRAS \bibinfovolume406, \bibinfopages2267–2278 (\bibinfoyear2010).
Here we give details of the multi-wavelength observations and the estimation of physical properties of sample galaxies. Throughout we adopt a Chabrier initial mass functionChabrier:2003 and the concordance cosmology with , = 0.7, and km s-1 Mpc-1. All magnitudes are in the AB system.
1 Observations
1.1 Selection of dropouts and incompleteness correction
We have crossmatched the F160W-selected catalog from the three CANDELS fields (Table 1) with an IRAC 3.6 and 4.5 m selected catalogAshby:2013 from the SEDS survey. The SEDS survey covers the three fields of H-dropouts to a depth of 26 AB mag (3) at both 3.6 and 4.5 m and is 80% complete down to [4.5] 24 mag. We first matched sources with mag in the SEDS catalog to the F160W-selected catalog and identified those without H-band counterparts within a 2” radius (corresponding roughly to the PSF size of IRAC 3.6 and 4.5 m). This 4.5 m magnitude cut was applied to enable sufficient color range to identify extremely red objects while keeping a complete 4.5 m selected sample. We then visually inspected the IRAC images and excluded sources whose flux is contaminated by bright neighbors as well as those falling on the edge of the F160W image. With knowledge of their positions, some of these H-dropouts are marginally detected in the F160W band but exhibit extended profiles and are unidentifiable as real sources without that prior knowledge. This left us 63 sources with 2 of them serendipitously detected in previous band-7 continuum observations with ALMA.
The criterion of no HST counterparts within 2” radius ensures a clean selection of H-dropouts with reliable constrains of IRAC fluxes. However, given the high density of HST sources in these deep fields, the chance probability of an IRAC-HST coincidence (with distance 2”) is non-negligible . This means that we may have missed some dropouts simply due to the presence of a random HST source falling within the 2” search radius of the IRAC source. To correct for this effect, we calculate the completeness of this selection approach, which is defined as at a given position the probability of finding zero galaxies in the 2” radius, radius2), with representing the surface density of HST sources. Averaging over the three CANDELS fields yields arcsec-2, implying . This suggests that while our approach yields a clean selection of dropouts, roughly half of the true dropouts have been missed simply due to chance superposition of sources, which needs to be corrected. In fact, this completeness correction is consistent with recent findings from a blind ALMA survey, which reveals four H-dropouts (with ) that were not picked up by our approach within an area of 1/3 of the GOODS-South filed Franco:2018, Yamaguchi:2019, in comparison to 12 sources selected by our approach in the whole GOODS-South field. Among these four sources, 3 of them have at least one HST counterpart within 2” (with the remaining one absent from our IRAC catalog, which is shallower than the one used in Franco:2018), which is inconsistent with being the right counterpart of the ALMA emission based on the redshift and other physical properties. Albeit with small number statistics, this implies a completeness of our searching approach of , consistent with our estimated value. In addition to this correction, we need to also correct for the incompleteness of the IRAC imaging from the SEDS survey, which ranges from 93% at [4.5] =22 to 75% -80% at in the three fields. Combining the two corrections, a factor of 2 to 2.4 has been applied to the number density (including also star formation rate and stellar mass density) of H-dropouts depending on their IRAC fluxes.
1.2 Multiwavelength photometry
In each field, we gathered mosaics in a large number of bands, including all the images used to build the 3DHST Skelton:2014 and ZFOURGE Straatman:2016 catalogs. All our galaxies therefore had rich and deep photometry from the UV to the NIR, reaching typical depths (AB) of in u to i, in z to H, and in Ks. We provide the full detail of the used mosaics below.
For GOODS-South, we used VLT/VIMOS images in the U and R bands Nonino:2009, ESO/WFI images in the U, U38, B, V, R, I bands from GaBoDS Hildebrandt:2006, CTIO/MOSAIC image in the z band from MUSYC Gawiser:2006, Subaru images in 15 medium bands from MUSYC Cardamone:2010, Hubble images in the F395W, F606W, F775W, F8514W, F850LP, F105W, F125W, F160W bands from GOODS and CANDELS programs Giavalisco:2004, Grogin:2011, Koekemoer:2011, VLT/ISAAC images in the J, H, Ks bands Retzlaff:2010, CFHT/WIRCam images in the J and Ks bands from TENIS Hsieh:2012, Magellan/FOURSTAR images in the J1, J2, J3, Hs, Hl, Ks bands from ZFOURGE Straatman:2016, a VLT/HawK-I image in the Ks band from HUGS Fontana:2014, and Spitzer IRAC images from SEDS Ashby:2013.
For UDS, we used a CFHT/Megacam image in the u band produced by the 3DHST team Skelton:2014, Subaru images in the B, V, R, i, z bands Furusawa:2008, Hubble images in the F606W, F814W, F125W, F140W, F160W bands from the CANDELS and 3DHST programs Koekemoer:2011, Momcheva:2016, UKIRT/WFCAM images in the J, H, K bands from UKIDSS Lawrence:2007, Magellan/FOURSTAR images in the J1, J2, J3, Hs, Hl, Ks bands from ZFOURGE Straatman:2016, VLT/HawK-I images in the Y and Ks bands from HUGS Fontana:2014, and Spitzer IRAC images from SEDS Ashby:2013 and SpUDS (PI: J. Dunlop).
For COSMOS, we used CFHT/Megacam images in the u and i bands from CFHTLS Cuillandre:2012, Subaru images in the B, g, V, r, i, z bands as well as 10 medium bands Taniguchi:2007, Hubble images in the F606W, F814W, F125W, F140W, F160W bands from the CANDELS and 3DHST programs Koekemoer:2011, Momcheva:2016, CFHT/WIRCam images in the H and Ks bands mccracken:2010, Magellan/FOURSTAR images in the J1, J2, J3, Hs, Hl, Ks bands from ZFOURGE Straatman:2016, VISTA/VIRCAM images in the Y, J, H, Ks from UltraVISTA DR3 Mccracken:2012, and Spitzer IRAC images from SEDS Ashby:2013 and S-COSMOS Sanders:2007.
The photometry was obtained with a procedure very similar to that previously used in deep surveys Straatman:2016, Momcheva:2016, which we summarize here. Fluxes in UV-to-NIR were extracted on re-gridded and PSF-matched images in fixed apertures of 2′′ diameter. Because of the broader PSF in Spitzer images, fluxes in the IRAC bands were extracted separately, with a 3” aperture and without PSF matching. The asymmetric IRAC PSF was rotated to match the telescope roll angle for each field. Prior to extracting the fluxes, all the neighboring sources within a 10” radius were subtracted from the images. This was done by identifying the sources from a stacked detection image, and using the HST F160W profile of each source as a model. These models were convolved by the PSF of each image, where they were fit simultaneously using a linear solver. Most often the dropouts were not found in the stacked detection image, and were therefore modeled as point-sources at the coordinates of their IRAC centroid during the de-blending stage. Once the flux was extracted, additional ”sky” apertures were placed randomly around each dropout. The median flux in these sky apertures was subtracted from the dropout’s flux, to eliminate any remaining background signal, while the standard deviation of these fluxes was used as flux uncertainty. Lastly, fluxes and uncertainties were aperture-corrected using the matched PSF’s light curve, assuming point-like morphology.
1.3 ALMA observation and data reduction
Our ALMA band-7 continuum observations of H-dropouts are performed during January and July 2016. The observations were centered on the IRAC positions with a spectral setup placed around a central frequency of 343.5 GHz. While we asked 0.7′′-resolution observation for all the three fields, only the CANDLES-COSMOS field was observed as requested, yielding a synthesis beam of . The other two fields were observed at 0.2-0.3′′ resolution. The integration time is roughly 1.8 mins per object with a total observing time of 2 h. We reduced the data using the CASA pipeline (version 4.3.1). To reach an homogeneous angular resolution, we tapered the baselines for these two fields to an angular resolution of 0.6′′. This resolution corresponds to 4 kpc at , compared to typical sizes of 2 kpc for SMGs Hodge:2016.
We measured the total flux of all our targets directly in the plane using the uvmodelfit procedure from the CASA pipeline. The sources were modeled with a circular Gaussian profile of variable total flux, centroid, width, axis ratio and position angle. 39 H-dropouts are detected at S/N with mJy, including two galaxies that were serendipitously detected in a previous ALMA programSchreiber:2016 targeting -detected galaxies, which has reached similar depth as this observation. The positions of the 870 m emission as measured from ALMA are in good agreement with IRAC, with RA=0.081 and DEC= -0.13.
1.4 SCUBA-2 450 m and VLA observations
One of the three -dropout fields, CANDELS-COSMOS, is covered by deep SCUBA-2 450 m and 870 m observations from the STUDIES surveyWangW:2017. Previous observations with JCMT/SCUBA-2 at the same regionCasey:2013, Geach:2013, Geach:2017 have also been combined to produce an extremely deep 450 m image and a confusion-limited 850 m image. The instrumental noises at 450 m and 850 m at the deepest regions reach 0.65 mJy and mJy, respectively.
The SCUBA2-450 m and -850 m fluxes for H-dropouts are measured at the position of the IRAC 3.6 and 4.5 m emission with the prior-based PSF-fitting code FASTPHOTBethermin:2010b. We further restrict all the extracted fluxes to be positive with bounded value least-square minimization. During the fit we have included all the MIPS 24 m- and VLA detections as priors to perform source extraction. The VLA 3 GHz observation in COSMOSSmolcic:2017 reaches a rms of 2.3 Jy/beam at an angular resolution of 0.75′′, which is deep enough to put useful constraints on their redshifts. The flux measurement for H-dropouts in the far-IR suffers minimum source confusion due to our selection criterion (no close neighbours within a 2′′ radius). A comparison of 870 m fluxes measured by ALMA and SCUBA-2 yields excellent agreement with a median value of .
1.5 X-SHOOTER spectra
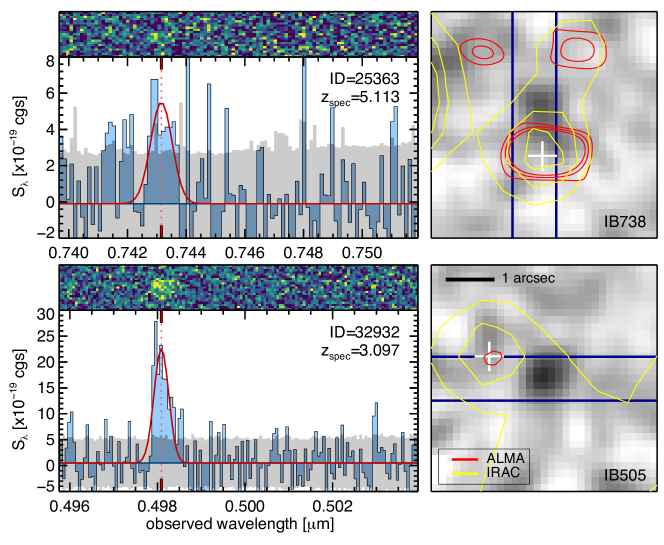
In the COSMOS field, deep medium band images in the optical were obtained with the Subaru telescopeTaniguchi:2007. We visually inspected these images at the location of each dropout in our sample and found three galaxies with flux excesses in one of these images, with a significance above 4 sigma. Examples are shown on Extended Data Figure 6. Such flux excess can be interpreted as coming from a bright emission lineSobral:2018. For these three dropouts, the line could be identified as Ly at , and , respectively. Even though H-dropouts are typically very obscured, Ly may still be detected through un-obscured sight lines, or by scatteringFinkelstein:2008. Judging from the spatial offsets of about we observed between this optical flux excess and the Spitzer–IRAC or ALMA emission, scattering appears to be the most plausible explanation.
We thus followed up these objects with VLT/X-SHOOTER to confirm the presence of an emission line. Each dropout was observed in May 2018 in the UVB and VIS arms for 50 minutes in stare mode (no nodding), split in three exposures. The 2D spectra were reduced using the standard pipeline, and 1D spectra were produced by fitting a Gaussian profile to each spectral slice. Uncertainties were controlled by computing the standard deviation of spectral elements in regions without sky lines; we found that the 1D uncertainty spectrum had to be rescaled upwards by a factor 1.27 to match the observed noise.
We then searched for emission lines in the spectra, considering only the wavelength range covered by the Subaru medium band in which the flux excess was previously identified. The result of this search is displayed on Extended Data Figure 6. We found a 10 detection at 0.498m for the dropout 32932, corresponding to , and a more marginal but still significant 4.3 detection at 0.739m for the dropout 25363, corresponding to . Because our search space is tightly limited by the Subaru passband, the latter only has a 0.4% chance of being spurious, and we therefore consider it a reliable detection. The third dropout showed no significant line emission above .
1.6 Lyman-break galaxy selection
In order to compare the properties of dropouts and LBGsSteidel:1996, we have selected LBGs using the ZFOURGE catalogs in the same three CANDELS fieldsStraatman:2016. The advantage of the ZFOURGE catalog is that it is essentially a band selected catalog, for which the deep band data provides critical constraints on the redshift and stellar masses estimates at . We select our LBG galaxy sample using the selection criterion in Bouwens:2015. Due to the lack of B-band data from HST, the LBG sample is only limited to GOODS-South field while the and LBG sample include galaxies from all the three fields. To enable a clean selection of galaxies with reliable flux density measurements, we have further limited the selection to galaxies with as recommendedStraatman:2016. This reduces the effective area to 132.2, 139.2, and 135.6 arcmin2 for GOODS-South, COSMOS, and UDS, respectively. To identify total SFRD from massive LBGs with , we utilized the latest determination of the UV luminosity function at Ono:2018. Taking into account variations in the relation, this mass cut corresponds to at , respectively. We then derive the dust-corrected SFR for these brightest UV-selected galaxies following the approach in ref.Bouwens:2012.
2 Determination of Physical Properties
2.1 Stacked UV-to-NIR SEDs
To produce the stacked UV-to-NIR SEDs, we took the fluxes of each galaxy in our photometric catalog and normalized them by their respective IRAC m flux. We then computed the mean flux in each band, using inverse variance weighting, and finally multiplied the resulting stacked fluxes by the average m flux of the stacked sample. In the stack, we combined bands that have similar effective wavelengths, even though the true passbands could be slightly different; for example we stacked together all the s bands from UKIDSS, UltraVISTA, FOURSTAR, WIRCam, and ISAAC into a single s band. The uncertainties on the stacked fluxes were derived by formally combining the uncertainties of each stacked galaxy. We note that, since we obtained our photometry using fixed-size apertures, this method is strictly equivalent to stacking the images.
2.2 Photometric redshift and stellar mass determination
Using the aforementioned multiwavelength photometry, including bands with formal non-detections, photometric redshifts were computed with EAzY Brammer:2008 using the full set of template SEDs, namely, including the old-and-dusty template and the extreme emission line template. The prior on the observed magnitudes was not used. Using these redshifts, we then ran FAST Kriek:2009a to estimate the stellar masses. We assumed a delayed-exponentially-declining star-formation history, with a range of age and exponential timescale. Dust attenuation was modeled with the Calzetti:2001 prescription, allowing up to 6 magnitudes. Metallicity was fixed to solar during the fitting. We also used the infrared luminosities inferred from the ALMA fluxes to further constrain the fits. This was implemented as follows. From the stacked Herschel SED (see Figure 3), we measured the mean dust temperature of our sample: . Based on Herschel and ALMA observations of galaxies Schreiber:2018a, we expect a typical scatter of around the average temperature at any given redshift. Assuming this distribution of temperatures holds for the dropouts, we generated probability distributions for using a Monte Carlo procedure: the measured ALMA flux was randomly perturbed with Gaussian noise of amplitude set by the flux uncertainty, and the dust temperature was drawn from a Gaussian distribution centered on and with a width of ; the resulting dust SED was then used to extrapolate from the ALMA measurement. For galaxies whose ALMA flux has , the resulting probability distribution of was close to Gaussian, while for the detections the probability distribution was close to log-normal. We modeled these two regimes accordingly in the fit, by assuming either Gaussian noise on or , respectively. The observed infrared luminosity was then compared to the modeled value, which we computed as the difference of bolometric luminosity before after applying dust attenuation. This resulted in an additional contribution to the , which was then used for standard model selection.
Uncertainties on the photometric redshifts were derived from the 16th and 84th percentiles of the probability distribution produced by EAzY. This accounts for uncertainty in the photometry as well as on the model galaxy templates. Uncertainties on the derived physical parameters, including the stellar mass, were derived using Monte Carlo simulations, where the observed photometry was randomly perturbed with Gaussian noise of amplitude determined by the estimated photometric uncertainties. This was repeated 200 times. The error bars on physical parameters were then derived from the 16th and 84th percentiles of the distribution of the values obtained in the Monte Carlo simulations. For each fit, the redshift was left free to vary within the 68% confidence interval reported by the photometric redshift code. Therefore the resulting error bars account for uncertainties on the photometry and on the redshift.
2.3 Clustering measurements
Since the number of H-dropouts is small, we calculate two-point angular cross-correlation function (CCF) with a much larger population of galaxies sharing the same cosmic volume (redshifts) in order to enhance the statistics. Specifically we select all the galaxies with from the H-selected catalog in the same three CANDELS fields (“the galaxy sample”, hereafter), and then calculate CCF using the estimator as follows Landy:1993:
| (1) |
where , , , are Hdropout-galaxy, Hdropout-random, galaxy-random and random-random pair counts respectively. The random galaxy sample are created within the same CANDELS footprint as the H-dropouts (we exclude HUDF in the GOODS-S field because of its much deeper integration than other regions). The uncertainties of CCF are estimated as:
| (2) |
We then fit the derived CCF with a power-law model:
| (3) |
where is the correlation amplitude and is the power-law index fixed to 0.8 and is the integral constraint. Integral constraints is an offset due to the clustering measurement over the limited area and is calculated by
| (4) |
The derived correlation amplitude can be converted to three-dimensional correlation length by Limber equationLimber:1953 modified by Croom:1999 for the cross-correlation.
The correlation length is related to galaxy bias , such that
| (5) |
and
| (6) |
where is a galaxy fluctuation, , and is a matter fluctuationPeebles:1993.
The halo mass is then derived from the estimated galaxy biasMoH:2002.
References
- 1 \bibinfoauthorChabrier, G. \bibinfotitleGalactic Stellar and Substellar Initial Mass Function. \bibinfojournalPASP \bibinfovolume115, \bibinfopages763–795 (\bibinfoyear2003). arXiv:astro-ph/0304382.
- 2 \bibinfoauthorAshby, M. L. N. et al. \bibinfotitleSEDS: The Spitzer Extended Deep Survey. Survey Design, Photometry, and Deep IRAC Source Counts. \bibinfojournalApJ \bibinfovolume769, \bibinfopages80 (\bibinfoyear2013).
- 3 \bibinfoauthorFranco, M. et al. \bibinfotitleGOODS-ALMA: 1.1 mm galaxy survey. I. Source catalog and optically dark galaxies. \bibinfojournalA&A \bibinfovolume620, \bibinfopagesA152 (\bibinfoyear2018). 1803.00157.
- 4 \bibinfoauthorYamaguchi, Y. et al. \bibinfotitleALMA twenty-six arcmin$2̂$ survey of GOODS-S at one-millimeter (ASAGAO): Near-infrared-dark faint ALMA sources. \bibinfojournalarXiv e-prints \bibinfopagesarXiv:1903.02744 (\bibinfoyear2019). 1903.02744.
- 5 \bibinfoauthorSkelton, R. E. et al. \bibinfotitle3D-HST WFC3-selected Photometric Catalogs in the Five CANDELS/3D-HST Fields: Photometry, Photometric Redshifts, and Stellar Masses. \bibinfojournalApJS \bibinfovolume214, \bibinfopages24 (\bibinfoyear2014). 1403.3689.
- 6 \bibinfoauthorNonino, M. et al. \bibinfotitleDeep U Band and R Imaging of Goods-South: Observations, Data Reduction and First Results. \bibinfojournalApJS \bibinfovolume183, \bibinfopages244–260 (\bibinfoyear2009). 0906.4250.
- 7 \bibinfoauthorHildebrandt, H. et al. \bibinfotitleGaBoDS: The Garching-Bonn Deep Survey. V. Data release of the ESO Deep-Public-Survey. \bibinfojournalA&A \bibinfovolume452, \bibinfopages1121–1128 (\bibinfoyear2006). astro-ph/0509882.
- 8 \bibinfoauthorGawiser, E. et al. \bibinfotitleThe Multiwavelength Survey by Yale-Chile (MUSYC): Survey Design and Deep Public UBVRIz’ Images and Catalogs of the Extended Hubble Deep Field-South. \bibinfojournalApJS \bibinfovolume162, \bibinfopages1–19 (\bibinfoyear2006). astro-ph/0509202.
- 9 \bibinfoauthorCardamone, C. N. et al. \bibinfotitleThe Multiwavelength Survey by Yale-Chile (MUSYC): Deep Medium-band Optical Imaging and High-quality 32-band Photometric Redshifts in the ECDF-S. \bibinfojournalApJS \bibinfovolume189, \bibinfopages270–285 (\bibinfoyear2010).
- 10 \bibinfoauthorGiavalisco, M. et al. \bibinfotitleThe Great Observatories Origins Deep Survey: Initial Results from Optical and Near-Infrared Imaging. \bibinfojournalApJ \bibinfovolume600, \bibinfopagesL93–L98 (\bibinfoyear2004). arXiv:astro-ph/0309105.
- 11 \bibinfoauthorGrogin, Norman A. et al. \bibinfotitleCANDELS: The Cosmic Assembly Near-infrared Deep Extragalactic Legacy Survey. \bibinfojournalApJS \bibinfovolume197, \bibinfopages35 (\bibinfoyear2011). 1105.3753.
- 12 \bibinfoauthorKoekemoer, A. M. et al. \bibinfotitleCANDELS: The Cosmic Assembly Near-infrared Deep Extragalactic Legacy Survey - The Hubble Space Telescope Observations, Imaging Data Products, and Mosaics. \bibinfojournalApJS \bibinfovolume197, \bibinfopages36 (\bibinfoyear2011). 1105.3754.
- 13 \bibinfoauthorRetzlaff, J. et al. \bibinfotitleThe Great Observatories Origins Deep Survey. VLT/ISAAC near-infrared imaging of the GOODS-South field. \bibinfojournalA&A \bibinfovolume511, \bibinfopages50 (\bibinfoyear2010). 0912.1306.
- 14 \bibinfoauthorHsieh, B.-C. et al. \bibinfotitleThe Taiwan ECDFS Near-Infrared Survey: Ultra-deep J and KS Imaging in the Extended Chandra Deep Field-South. \bibinfojournalApJS \bibinfovolume203, \bibinfopages23 (\bibinfoyear2012). 1210.4519.
- 15 \bibinfoauthorFontana, A. et al. \bibinfotitleThe Hawk-I UDS and GOODS Survey (HUGS): Survey design and deep K-band number counts. \bibinfojournalA&A \bibinfovolume570, \bibinfopagesA11 (\bibinfoyear2014). 1409.7082.
- 16 \bibinfoauthorFurusawa, H. et al. \bibinfotitleThe Subaru/XMM-Newton Deep Survey (SXDS). II. Optical Imaging and Photometric Catalogs. \bibinfojournalApJS \bibinfovolume176, \bibinfopages1–18 (\bibinfoyear2008). 0801.4017.
- 17 \bibinfoauthorMomcheva, I. G. et al. \bibinfotitleThe 3D-HST Survey: Hubble Space Telescope WFC3/G141 Grism Spectra, Redshifts, and Emission Line Measurements for ~ 100,000 Galaxies. \bibinfojournalApJS \bibinfovolume225, \bibinfopages27 (\bibinfoyear2016). 1510.02106.
- 18 \bibinfoauthorLawrence, A. et al. \bibinfotitleThe UKIRT Infrared Deep Sky Survey (UKIDSS). \bibinfojournalMNRAS \bibinfovolume379, \bibinfopages1599–1617 (\bibinfoyear2007). arXiv:astro-ph/0604426.
- 19 \bibinfoauthorCuillandre, J.-C. J. et al. \bibinfotitleIntroduction to the CFHT Legacy Survey final release (CFHTLS T0007). In \bibinfobooktitleObservatory Operations: Strategies, Processes, and Systems IV, vol. \bibinfovolume8448 of \bibinfoseriesProc. SPIE, \bibinfopages84480M (\bibinfoyear2012).
- 20 \bibinfoauthorTaniguchi, Y. et al. \bibinfotitleThe Cosmic Evolution Survey (COSMOS): Subaru Observations of the HST Cosmos Field. \bibinfojournalThe Astrophysical Journal Supplement Series \bibinfovolume172, \bibinfopages9–28 (\bibinfoyear2007).
- 21 \bibinfoauthorMcCracken, H. J. et al. \bibinfotitleThe COSMOS-WIRCam Near-Infrared Imaging Survey. I. BzK-Selected Passive and Star-Forming Galaxy Candidates at z gsim 1.4. \bibinfojournalApJ \bibinfovolume708, \bibinfopages202–217 (\bibinfoyear2010). 0910.2705.
- 22 \bibinfoauthorMcCracken, H. J. et al. \bibinfotitleUltraVISTA: a new ultra-deep near-infrared survey in COSMOS. \bibinfojournalA&A \bibinfovolume544, \bibinfopagesA156 (\bibinfoyear2012). 1204.6586.
- 23 \bibinfoauthorSanders, D. B. et al. \bibinfotitleS-COSMOS: The Spitzer Legacy Survey of the Hubble Space Telescope ACS 2 deg2 COSMOS Field I: Survey Strategy and First Analysis. \bibinfojournalApJS \bibinfovolume172, \bibinfopages86–98 (\bibinfoyear2007). arXiv:astro-ph/0701318.
- 24 \bibinfoauthorHodge, J. A. et al. \bibinfotitleKiloparsec-scale Dust Disks in High-redshift Luminous Submillimeter Galaxies. \bibinfojournalApJ \bibinfovolume833, \bibinfopages103 (\bibinfoyear2016). 1609.09649.
- 25 \bibinfoauthorSchreiber, C. et al. \bibinfotitleObservational evidence of a slow downfall of star formation efficiency in massive galaxies during the past 10 Gyr. \bibinfojournalA&A \bibinfovolume589, \bibinfopagesA35 (\bibinfoyear2016). 1601.04226.
- 26 \bibinfoauthorWang, W.-H. et al. \bibinfotitleSCUBA-2 Ultra Deep Imaging EAO Survey (STUDIES): Faint-end Counts at 450 m. \bibinfojournalApJ \bibinfovolume850, \bibinfopages37 (\bibinfoyear2017). 1707.00990.
- 27 \bibinfoauthorCasey, C. M. et al. \bibinfotitleCharacterization of SCUBA-2 450 m and 850 m selected galaxies in the COSMOS field. \bibinfojournalMNRAS \bibinfovolume436, \bibinfopages1919–1954 (\bibinfoyear2013). 1302.2619.
- 28 \bibinfoauthorGeach, J. E. et al. \bibinfotitleThe SCUBA-2 Cosmology Legacy Survey: blank-field number counts of 450-m-selected galaxies and their contribution to the cosmic infrared background. \bibinfojournalMNRAS \bibinfovolume432, \bibinfopages53–61 (\bibinfoyear2013). 1211.6668.
- 29 \bibinfoauthorGeach, J. E. et al. \bibinfotitleThe SCUBA-2 Cosmology Legacy Survey: 850 m maps, catalogues and number counts. \bibinfojournalMNRAS \bibinfovolume465, \bibinfopages1789–1806 (\bibinfoyear2017). 1607.03904.
- 30 \bibinfoauthorBéthermin, M., \bibinfoauthorDole, H., \bibinfoauthorCousin, M. & \bibinfoauthorBavouzet, N. \bibinfotitleSubmillimeter number counts at 250 m, 350 m and 500 m in BLAST data. \bibinfojournalA&A \bibinfovolume516, \bibinfopagesA43 (\bibinfoyear2010). 1003.0833.
- 31 \bibinfoauthorSmolčić, V. et al. \bibinfotitleThe VLA-COSMOS 3 GHz Large Project: Continuum data and source catalog release. \bibinfojournalA&A \bibinfovolume602, \bibinfopagesA1 (\bibinfoyear2017). 1703.09713.
- 32 \bibinfoauthorSobral, D. et al. \bibinfotitleSlicing COSMOS with SC4K: the evolution of typical Ly emitters and the Ly escape fraction from z? 2 to 6. \bibinfojournalMNRAS \bibinfovolume476, \bibinfopages4725–4752 (\bibinfoyear2018).
- 33 \bibinfoauthorFinkelstein, S. L., \bibinfoauthorRhoads, J. E., \bibinfoauthorMalhotra, S., \bibinfoauthorGrogin, N. & \bibinfoauthorWang, J. \bibinfotitleEffects of Dust Geometry in Ly Galaxies at z = 4.4. \bibinfojournalApJ \bibinfovolume678, \bibinfopages655–668 (\bibinfoyear2008).
- 34 \bibinfoauthorSteidel, C. C., \bibinfoauthorGiavalisco, M., \bibinfoauthorPettini, M., \bibinfoauthorDickinson, M. & \bibinfoauthorAdelberger, K. L. \bibinfotitleSpectroscopic Confirmation of a Population of Normal Star-forming Galaxies at Redshifts Z 3. \bibinfojournalApJ \bibinfovolume462, \bibinfopagesL17 (\bibinfoyear1996). astro-ph/9602024.
- 35 \bibinfoauthorBouwens, R. J. et al. \bibinfotitleUV Luminosity Functions at Redshifts z? 4 to z? 10: 10,000 Galaxies from HST Legacy Fields. \bibinfojournalApJ \bibinfovolume803, \bibinfopages34 (\bibinfoyear2015). 1403.4295.
- 36 \bibinfoauthorBrammer, G. B., \bibinfoauthorvan Dokkum, P. G. & \bibinfoauthorCoppi, P. \bibinfotitleEAZY: A Fast, Public Photometric Redshift Code. \bibinfojournalApJ \bibinfovolume686, \bibinfopages1503–1513 (\bibinfoyear2008). 0807.1533.
- 37 \bibinfoauthorKriek, M. et al. \bibinfotitleAn Ultra-Deep Near-Infrared Spectrum of a Compact Quiescent Galaxy at z = 2.2. \bibinfojournalApJ \bibinfovolume700, \bibinfopages221–231 (\bibinfoyear2009). 0905.1692.
- 38 \bibinfoauthorCalzetti, D. \bibinfotitleThe Dust Opacity of Star-forming Galaxies. \bibinfojournalPASP \bibinfovolume113, \bibinfopages1449–1485 (\bibinfoyear2001). astro-ph/0109035.
- 39 \bibinfoauthorLandy, S. D. & \bibinfoauthorSzalay, A. S. \bibinfotitleBias and variance of angular correlation functions. \bibinfojournalApJ \bibinfovolume412, \bibinfopages64–71 (\bibinfoyear1993).
- 40 \bibinfoauthorLimber, D. N. \bibinfotitleThe Analysis of Counts of the Extragalactic Nebulae in Terms of a Fluctuating Density Field. \bibinfojournalApJ \bibinfovolume117, \bibinfopages134 (\bibinfoyear1953).
- 41 \bibinfoauthorCroom, S. M. & \bibinfoauthorShanks, T. \bibinfotitleRadio-quiet QSO environments - I. The correlation of QSOs and b_J23 galaxies. \bibinfojournalMNRAS \bibinfovolume303, \bibinfopages411–422 (\bibinfoyear1999). astro-ph/9810170.
- 42 \bibinfoauthorPeebles, P. J. E. \bibinfotitlePrinciples of Physical Cosmology (\bibinfopublisherPrinceton University Press, \bibinfoyear1993).
- 43 \bibinfoauthorCombes, F. et al. \bibinfotitleA bright z = 5.2 lensed submillimeter galaxy in the field of Abell 773. HLSJ091828.6+514223. \bibinfojournalA&A \bibinfovolume538, \bibinfopagesL4 (\bibinfoyear2012).
- 44 \bibinfoauthorVieira, J. D. et al. \bibinfotitleDusty starburst galaxies in the early Universe as revealed by gravitational lensing. \bibinfojournalNature \bibinfovolume495, \bibinfopages344–347 (\bibinfoyear2013). 1303.2723.
- 45 \bibinfoauthorCarilli, C. L. & \bibinfoauthorYun, M. S. \bibinfotitleThe Radio-to-Submillimeter Spectral Index as a Redshift Indicator. \bibinfojournalApJ \bibinfovolume513, \bibinfopagesL13–L16 (\bibinfoyear1999). astro-ph/9812251.
- 46 \bibinfoauthorBoquien, M. et al. \bibinfotitleCIGALE: a python Code Investigating GALaxy Emission. \bibinfojournalA&A \bibinfovolume622, \bibinfopagesA103 (\bibinfoyear2019). 1811.03094.
- 47 \bibinfoauthorBruzual, G. & \bibinfoauthorCharlot, S. \bibinfotitleStellar population synthesis at the resolution of 2003. \bibinfojournalMNRAS \bibinfovolume344, \bibinfopages1000–1028 (\bibinfoyear2003). arXiv:astro-ph/0309134.
- 48 \bibinfoauthorDraine, B. T. & \bibinfoauthorLi, A. \bibinfotitleInfrared Emission from Interstellar Dust. IV. The Silicate-Graphite-PAH Model in the Post-Spitzer Era. \bibinfojournalApJ \bibinfovolume657, \bibinfopages810–837 (\bibinfoyear2007). astro-ph/0608003.
- 49 \bibinfoauthorInoue, A. K. \bibinfotitleRest-frame ultraviolet-to-optical spectral characteristics of extremely metal-poor and metal-free galaxies. \bibinfojournalMNRAS \bibinfovolume415, \bibinfopages2920–2931 (\bibinfoyear2011). 1102.5150.
| Field | Area | WFC3/F160W () | H-dropouts | ALMA-detected | ALMA-undetected |
|---|---|---|---|---|---|
| () | ( mJy) | ( mJy) | |||
| CANDELS-GDS | 184 | – | 12 | 10 | 2 |
| CANDELS-UDS | 202 | – | 33 | 14 | 19 |
| CANDELS-COSMOS | 208 | – | 18 | 15 | 3 |
| ID | R.A. | Decl. | [4.5] | Log | ||
|---|---|---|---|---|---|---|
| (J2000) | (J2000) | (mJy) | ||||
| GDS-25526 | 03:32:47.97 | -27:54:16.4 | 22.05 | 8.340.18 | 4.74 | 10.84 |
| GDS-27571 | 03:32:30.62 | -27:42:24.3 | 22.44 | 0.820.16 | 4.64 | 10.89 |
| GDS-40613 | 03:32:11.44 | -27:52:07.1 | 23.17 | 1.830.18 | 3.04 | 10.64 |
| GDS-43215 | 03:32:20.34 | -27:42:28.8 | 23.02 | 1.520.16 | 2.91 | 10.25 |
| GDS-44539 | 03:32:28.59 | -27:48:50.2 | 23.41 | 0.690.10 | 4.22 | 10.94 |
| GDS-47375 | 03:32:14.62 | -27:43:06.0 | 23.48 | 1.890.12 | 3.60 | 10.27 |
| GDS-48764 | 03:32:32.31 | -27:54:26.9 | 23.31 | 2.540.42 | 5.16 | 10.38 |
| GDS-48885 | 03:32:47.17 | -27:45:25.1 | 23.57 | 0.870.11 | 4.62 | 10.56 |
| GDS-49094 | 03:32:31.85 | -27:43:12.7 | 23.59 | 0.890.13 | 3.69 | 10.29 |
| GDS-52734 | 03:32:10.10 | -27:50:33.1 | 24.06 | 1.410.15 | 5.13 | 10.71 |
| GDS-54513 | 03:32:04.99 | -27:41:56.5 | 23.71 | 0.6 | 4.33 | 10.30 |
| GDS-58560 | 03:32:40.11 | -27:42:55.3 | 23.85 | 0.6 | 5.35 | 10.58 |
| COS-16199 | 10:00:25.41 | +02:25:43.9 | 21.96 | 3.910.09 | 6.54 | 10.90 |
| COS-19762 | 10:00:15.89 | +02:24:45.9 | 22.94 | 4.350.10 | 3.52 | 10.79 |
| COS-23718 | 10:00:28.95 | +02:25:05.3 | 22.82 | 2.250.10 | 5.77 | 11.02 |
| COS-23913 | 10:00:23.03 | +02:21:55.0 | 22.87 | 1.630.09 | 3.65 | 10.65 |
| COS-24466 | 10:00:38.07 | +02:28:06.2 | 23.22 | 1.380.09 | 3.35 | 10.37 |
| COS-25270 | 10:00:23.62 | +02:13:57.4 | 23.47 | 0.6 | 3.78 | 10.48 |
| COS-25363 | 10:00:26.68 | +02:31:26.2 | 23.15 | 3.0 0.2 | 5.113 | 10.52 |
| COS-25881 | 10:00:27.03 | +02:24:24.0 | 22.96 | 1.300.10 | 6.58 | 11.12 |
| COS-27285 | 10:00:27.79 | +02:25:52.2 | 23.74 | 1.580.09 | 4.32 | 10.31 |
| COS-27392 | 10:00:27.98 | +02:25:29.7 | 23.42 | 0.6 | 3.61 | 10.38 |
| COS-30182 | 10:00:14.70 | +02:28:01.7 | 23.08 | 1.590.09 | 6.37 | 10.94 |
| COS-30614 | 10:00:14.69 | +02:30:04.6 | 23.39 | 0.850.10 | 3.97 | 10.22 |
| COS-31278 | 10:00:26.09 | +02:12:31.6 | 23.36 | 0.930.09 | 3.37 | 10.14 |
| COS-31483 | 10:00:46.50 | +02:23:09.1 | 23.89 | 0.700.11 | 2.97 | 9.91 |
| COS-31661 | 10:00:41.83 | +02:25:47.0 | 23.28 | 2.880.12 | 3.72 | 10.36 |
| COS-32409 | 10:00:15.84 | +02:23:04.0 | 23.66 | 0.700.11 | 3.91 | 9.87 |
| COS-32932 | 10:00:22.44 | +02:23:41.1 | 23.22 | 0.6 | 3.0971 | 9.96 |
| COS-34487 | 10:00:35.34 | +02:28:26.7 | 23.36 | 4.3 0.15 | 3.15 | 10.18 |
| UDS-24945 | 02:16:59.77 | -05:11:52.8 | 22.16 | 0.6 | 3.50 | 10.76 |
| UDS-29006 | 02:17:05.52 | -05:08:45.8 | 22.71 | 0.6 | 3.79 | 10.46 |
| UDS-31037 | 02:18:07.67 | -05:13:26.8 | 22.58 | 1.830.13 | 3.62 | 10.49 |
| UDS-31072 | 02:17:43.32 | -05:11:57.4 | 22.29 | 3.630.25 | 4.20 | 11.31 |
| UDS-31959 | 02:18:11.36 | -05:16:23.7 | 22.98 | 0.6 | 3.88 | 10.22 |
| UDS-34637 | 02:18:05.80 | -05:11:23.1 | 22.89 | 1.070.37 | 2.84 | 10.33 |
| UDS-37344 | 02:18:02.86 | -05:15:05.4 | 23.36 | 0.6 | 2.89 | 10.18 |
| UDS-37423 | 02:18:10.02 | -05:11:31.5 | 23.07 | 1.120.15 | 7.47 | 11.17 |
| UDS-37560 | 02:17:03.44 | -05:15:51.3 | 22.72 | 4.400.14 | 3.95 | 10.35 |
| UDS-37649 | 02:17:36.95 | -05:16:07.3 | 23.14 | 1.250.31 | 2.82 | 10.31 |
| UDS-40772 | 02:17:36.56 | -05:12:52.0 | 23.19 | 1.960.31 | 4.00 | 10.87 |
| UDS-41502 | 02:17:18.03 | -05:11:03.9 | 23.23 | 1.590.20 | 3.73 | 10.59 |
| UDS-41525 | 02:16:59.59 | -05:14:15.4 | 23.34 | 0.6 | 6.13 | 11.17 |
| UDS-41773 | 02:18:07.02 | -05:09:18.1 | 23.11 | 1.540.15 | 3.52 | 10.20 |
| UDS-42280 | 02:18:11.16 | -05:10:27.1 | 23.88 | 1.160.37 | 4.21 | 10.06 |
| UDS-42875 | 02:18:21.15 | -05:09:42.5 | 23.04 | 1.740.15 | 7.20 | 11.75 |
| UDS-43941 | 02:17:43.65 | -05:14:23.9 | 23.46 | 1.910.11 | 3.39 | 10.17 |
| UDS-44515 | 02:18:20.89 | -05:11:11.1 | 23.48 | 0.6 | 4.20 | 10.59 |
| UDS-44594 | 02:17:20.20 | -05:11:55.4 | 23.79 | 0.660.14 | 4.44 | 10.60 |
| UDS-45868 | 02:18:15.00 | -05:10:02.7 | 23.61 | 0.6 | 3.66 | 10.45 |
| UDS-46241 | 02:17:58.31 | -05:15:00.3 | 23.44 | 0.6 | 2.18 | 9.72 |
| UDS-46513 | 02:18:17.87 | -05:11:53.9 | 23.84 | 0.580.11 | 3.54 | 10.31 |
| UDS-46648 | 02:17:08.17 | -05:15:37.8 | 23.52 | 2.270.20 | 6.88 | 11.37 |
| UDS-46693 | 02:17:59.07 | -05:09:37.5 | 23.47 | 0.6 | 3.56 | 10.24 |
| UDS-48514 | 02:17:29.83 | -05:14:23.5 | 23.65 | 0.6 | 2.59 | 10.04 |
| UDS-49119 | 02:17:07.14 | -05:12:54.0 | 23.77 | 1.340.30 | 4.60 | 10.65 |
| UDS-49199 | 02:18:21.40 | -05:11:46.3 | 23.6 | 0.6 | 3.96 | 10.66 |
| UDS-49594 | 02:18:01.13 | -05:13:45.7 | 23.65 | 0.6 | 3.77 | 9.79 |
| UDS-49784 | 02:17:37.48 | -05:09:47.7 | 23.6 | 0.6 | 3.95 | 9.91 |
| UDS-51119 | 02:17:58.29 | -05:11:44.7 | 23.75 | 0.6 | 3.45 | 10.25 |
| UDS-52324 | 02:17:06.27 | -05:09:48.3 | 23.49 | 2.690.16 | 4.95 | 10.62 |
| UDS-54074 | 02:17:09.70 | -05:15:11.3 | 23.75 | 0.810.10 | 5.89 | 10.65 |
| UDS-63094 | 02:17:53.06 | -05:11:25.5 | 23.98 | 0.6 | 5.08 | 10.00 |
This paper makes use of the following ALMA data: ADS/JAO.ALMA#2015.1.01495.S, and ADS/JAO.ALMA#2013.1.01292.S. ALMA is a partnership of ESO (representing its member states), NSF (USA), and NINS (Japan), together with NRC (Canada), NSC, ASIAA (Taiwan), and KASI (Republic of Korea), in cooperation with the Republic of Chile. The Joint ALMA Observatory is operated by ESO, AUI/NRAO, and NAOJ. This paper makes use of JCMT data from programs M16AL006,
MJLSC91, M11BH11A, M12AH11A, and M12BH21A. T. W. acknowledges the support by the NAOJ ALMA Scientific Research Grant Number 2017-06B, JSPS Grant-in-Aid for Scientific Research (S) JP17H06130, and funding from the European Union Seventh Framework Programme (FP7/2007-2013) under grant agreement No. 312725 (ASTRODEEP). X.S. acknowledges the support from NSFC 11573001, and National Basic Research Program 2015CB857005. C.-F.L. and W.-H.W. were supported by Ministry of Science and Technology of Taiwan Grant 105-2112-M-001-029-MY3.
T.W., C.S., and D.E. conceived the work, led the analysis and interpretation. T.W. proposed and carried out ALMA observations, reduced the ALMA data, measured SCUBA-2 fluxes and performed full SED fitting, and authored the majority of the text. C.S. conducted multiwavelength photometry and SED fitting, and carried out VLT/X-shooter observations and data reduction. Y.Yoshimura performed the clustering analysis. C.-F.L., W.-W.W. and X.S. contributed to the 450 m photometry. K.K., Y. Yamaguchi, M.F., M.P., J.H., contributed to the overall interpretation of the results and various aspects of the analysis.
The codes used to reduce ALMA and X-shooter data are public available. The codes used to model the optical-to-infrared SEDs, and to stack the optical and infrared images are accessible through github (https://github.com/cschreib).
Source data for the ALMA 870m imaging are available through the ALMA archive. Optical-to-infrared imaging for all the galaxies in the sample are also public available through HST and Spitzer data archive. The other data that support the plots within this paper and other findings of this study are available from the corresponding author upon reasonable request.
The authors declare that they have no competing financial interests. Correspondence and requests for materials should be addressed to T.W. (email: twang.nju@gmail.com, ).