∎
Av. Vicuña Mackenna 4860, 7820436 Macul, Santiago, Chile
Millennium Institute of Astrophysics, Santiago, Chile
Nicolaus Copernicus Astronomical Center, Polish Academy of Sciences
Bartycka 18, 00-716 Warszawa, Poland
22email: ghajdu@camk.edu.pl 33institutetext: I. Dékány 44institutetext: Astronomisches Rechen-Institut, Zentrum für Astronomie der Universität Heidelberg,
Mönchhofstr. 12-14, 69120 Heidelberg, Germany
44email: idekany@uni-heidelberg.de 55institutetext: M. Catelan 66institutetext: Instituto de Astrofísica, Facultad de Física, Pontificia Universidad Católica de Chile,
Av. Vicuña Mackenna 4860, 7820436 Macul, Santiago, Chile
Millennium Institute of Astrophysics, Santiago, Chile
Centro de Astro-Ingeniería, Pontificia Universidad Católica de Chile,
Av. Vicuña Mackenna 4860, 7820436 Macul, Santiago, Chile
66email: mcatelan@astro.puc.cl 77institutetext: E. K. Grebel 88institutetext: Astronomisches Rechen-Institut, Zentrum für Astronomie der Universität Heidelberg,
Mönchhofstr. 12-14, 69120 Heidelberg, Germany
88email: grebel@ari.uni-heidelberg.de
On the optimal calibration of VVV photometry
Abstract
Prompted by some inconsistencies in the photometry of the VISTA Variables in the Vía Láctea (VVV) survey, we conduct a revision of the standard calibration procedure of VISTA data in the , , and passbands. Two independent sources of bias in the photometric zero-points are identified: First, high sky backgrounds severely affect the -band measurements, but this can mostly be minimized by strict data vetting. Secondly, during the zero-point calibration, stars serving as standards are taken from the 2MASS catalog, which can suffer from high degrees of blending in regions of high stellar density, affecting both the absolute photometric calibration, as well as the scatter of repeated observations. The former affects studies that rely on an absolute magnitude scale, while the latter can also affect the shapes and amount of scatter in the VVV light curves, thus potentially hampering their proper classification. We show that these errors can be effectively eliminated by relatively simple modifications of the standard calibration procedure, and demonstrate the effect of the recalibration on the VVV survey’s data quality. We give recommendations for future improvements of the pipeline calibration of VISTA photometry, while also providing preliminary corrections to the VVV observations as a temporary measure.
Keywords:
Photometric calibration Near-infrared photometry VISTA Photometric zero points1 Introduction
VISTA Variables in the Vía Láctea (VVV; Minniti et al., 2010) is an ESO Public Survey of the bulge and an adjoining part of the Galactic mid-plane, covering approximately 520 square degrees of the sky. It uses the Visible and Infrared Survey Telescope for Astronomy (VISTA; Sutherland et al., 2015), equipped with the VISTA IR Camera (VIRCAM). VVV acquired time-series photometry of nearly a billion point sources in the near-infrared band between 2009 and 2015, and additional sparse photometry in the , , , and bands over its entire area. An extension of the survey called VVV eXtended (VVVX; Minniti, 2018) is currently in progress.
Standard data products for the VVV survey, as well as other ESO surveys carried out by VISTA, are produced by the VISTA Data Flow System (VDFS, Emerson et al., 2004; Irwin et al., 2004). It comprises a series of software pipelines for quality control and system monitoring by ESO, image processing, source detection, photometry and calibration by the Cambridge Astronomy Survey Unit (CASU, see Hodgkin et al., 2009; González-Fernández et al., 2018) and data curation by the VISTA Science Archive (VSA, Cross et al., 2012).
The VDFS performs photometry on two different image end products known as pawrints and tiles. In the case of the VVV survey observations discussed here, a pawprint is a single detector frame stack combined from two slightly jittered VIRCAM exposures, and is thus composed of 16 sub-images, one from each of VIRCAM’s detector chips, covering a discontiguous area of the sky. At each observational epoch, a series of 6 pawprints are taken over a field with overlapping offset pointings in a 3-minute time interval, in order to fill the gaps between the detector’s chips. Consequently, most of the sources have multiple pawprint-based photometric measurements at each epoch. Pawprints are further combined into contiguous mosaic images known as tiles, which lead to a separate line of photometric data products. Tile-based photometry is less precise and accurate due to the complicated image processing involved in image mosaicking, but it has a slightly higher limiting magnitude. In this study, we only consider pawprint-based photometry. Both photometric data products are calibrated to local secondary standard stars from the 2-Micron All-Sky Survey (2MASS; Skrutskie et al., 2006). For a more comprehensive technical description of the data processing by CASU, we refer to González-Fernández et al. (2018, and references therein). Standard data products from CASU are considered to be science-ready and serve as direct input for the VSA.
The VVV survey’s standard data products, as provided by CASU, already formed the basis of hundreds of scientific publications in diverse interlinked astronomical fields, ranging from studies of the stellar populations of the Galactic bulge (e.g., Gonzalez et al., 2012; Dékány et al., 2013; Wegg, & Gerhard, 2013), to analyses of interstellar extinction (Gonzalez et al., 2012; Schultheis et al., 2014; Nataf et al., 2016) and the census and characterization of stellar clusters in the Milky Way (Borissova et al., 2011; Chené et al., 2012; Alonso-García et al., 2015), to mention only a few. Most of these studies concern objects located toward crowded stellar fields at low Galactic latitudes highly reddened by interstellar dust, where VVV has a unique advantage over optical surveys. The accuracy of the absolute calibration of VVV photometry under such adverse observational conditions is of critical importance for the astrophysical characterization of these objects.
Evidence has been accumulating that the standard photometric data products of the VVV survey show significant anomalies. In this study, we review the pipeline calibration procedure of VISTA photometry by the VDFS, revealing that under some circumstances, the photometric zero-points in the bands are affected by significant time-varying biases that can adversely affect scientific conclusions, and that can be largely eliminated by further optimization of the calibration method.
2 Inconsistencies in the VVV photometry
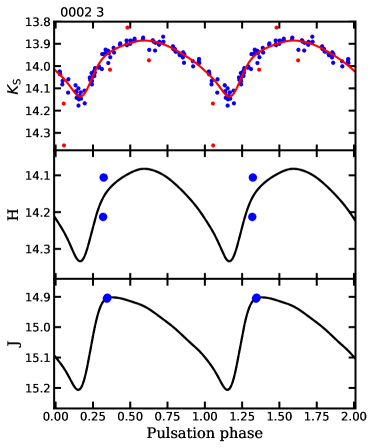
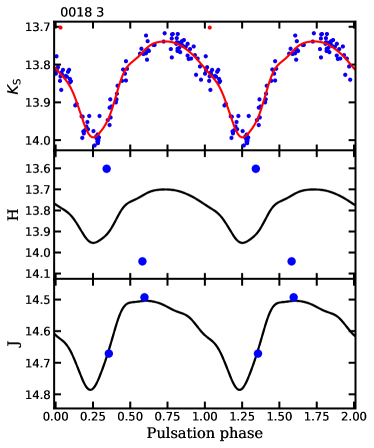
During our study of the RR Lyrae stars along the southern Galactic mid-plane (Dékány et al., 2018), a fraction of our sample showed large inconsistencies between individual -band measurements. Fig. 1 shows concrete examples of this for two different stars: on the left panel, the -band measurements of the star come from two separate pawprints at the same epoch, while on the right panel the -band data come from two different nights. In both cases, the two -band measurements are inconsistent with the predicted light variation (Hajdu et al., 2018). In the study of Dékány et al. (2018), -band measurements did not show such an anomaly, and they were available for almost all RR Lyrae stars in our sample, enabling us to estimate their reddening. However, many objects in the VVV survey, such as distant Cepheids, are extremely obscured by interstellar dust, preventing their detection in the band. As a result, -band observations play a crucial role in the characterization of distant, heavily reddened VVV sources. Thus, understanding the cause of the -band photometric inconsistencies and making the necessary corrections is essential.
An additional source of systematic bias in the VDFS photometry was discovered by Jurcsik et al. (2018) during their study of the Blazhko effect in the near-infrared. They note that part of their VVV -band RR Lyrae light curves showed systematic offsets between measurements corresponding to different pawprints and/or overlapping fields. These offsets were manually corrected by Jurcsik et al. (2018) on a relative scale, but this additional source of scatter also warrants a revision of the VISTA photometry in all passbands. As the bands are the most relevant for the study of variable stars in the VVV survey, in this study we have chosen to focus our attention on them.
3 The calibration of VISTA to 2MASS
The standard procedure of photometric calibration of VISTA data is based on the software pipeline by Hodgkin et al. (2009), developed for the Wide Field Camera (WFCAM; Casali et al., 2007) of the United Kingdom Infrared Telescope (UKIRT) on Mauna Kea, Hawai’i. CASU have provided multiple versions of the photometry, differentiated by version numbers. At the time of writing of this paper, version 1.3 has been completed for the entire VVV data set and version 1.5 is being deployed. In the case of the pawprint photometry concerned here, versions 1.3 and 1.5 share the procedures of source extraction and photometry, with the main differences between the two versions coming from the refined conversion formulae involved in the absolute calibration (González-Fernández et al., 2018), as well as from the modified procedure used to estimate the line-of-sight extinction towards individual 2MASS stars. It should be mentioned that further changes were implemented between the two versions regarding the generation of the tile catalogs, but in this work we are only concerned with the pawprint photometry.
The VISTA instrumental magnitudes are calibrated to the common VISTA photometric system on a pawprint basis by applying a zero-point shift to match the magnitudes of an ensemble of local secondary standard stars from the 2MASS survey, converted to the VISTA system. Changes in the individual detector sensitivities are accounted for by an additional offset, calculated on a monthly basis for every filter.
In order to investigate the previously discussed photometric anomalies, we retrieved the photometry provided in the 2MASS Point Source Catalog (Skrutskie et al., 2006) from the Infrared Processing & Analysis Center111www.ipac.caltech.edu for all stellar sources in the following areas:
| bulge: | ||||
| disk: |
These two data sets completely encompass the bulge and disk footprints of the VVV survey, and contain approximately 13.7 and 10.6 million point sources detected by 2MASS, respectively.
Version 1.3 of the CASU photometry uses the following transformation equations between the 2MASS and the VISTA systems (González-Fernández et al., 2018):
| (1) | |||||
| (2) | |||||
| (3) |
while their version 1.5 uses the following equations:
| (4) | |||||
| (5) | |||||
| (6) |
The color excesses and are estimated differently for each star in the two versions of the photometry. In both cases, the color excess is first interpolated at the coordinates of each 2MASS source from the extinction map of Schlegel et al. (1998), originally calculated from the measured infrared emission of dust. For version 1.3, this value is modified as:
| (7) |
for values bigger than 0.1 mag, following Bonifacio et al. (2000). Furthermore, this color excess is limited to a maximum of 10 mag, in order to account for its overestimation at low Galactic latitudes. In contrast, for version 1.5, the interpolated of Schlegel et al. (1998) is utilized directly; however, the resulting values are modified to yield a dereddened color for stars where the original would result in a dereddened color of . For the details of the estimations of extinction for 2MASS objects between the two versions of the photometry, as well as of additional quality cuts applied to the 2MASS sample of point sources, we followed the descriptions of González-Fernández et al. (2018). These final and values are used with their corresponding Eqs. 1–6 to convert the magnitudes of the 2MASS sources to both versions of the VISTA photometric system222During our discussions with the referee, it has become clear that we have inadvertently used the modified (Bonifacio et al., 2000) color excesses in our conversion procedure for version 1.5 of the VISTA photometric system. As we have otherwise followed the procedures laid out by González-Fernández et al. (2018), this only results in a minor, location-dependent photometric zero-point shift with a maximum value of less than 0.007 mag in the band (in the other bands, the extinction coefficients in the conversion formulae Eqs. 4,5 are zero). Therefore, we have chosen not to redo our analysis for this study..
González-Fernández et al. (2018) note that there are small magnitude zero-point offsets between versions 1.3 and 1.5 of VISTA photometry, mainly caused by the change in the transformation Eqs. 1–6. Our conversion of the 2MASS photometry to the versions 1.3 and 1.5 of the VISTA system show differences consistent with the ones found by González-Fernández et al. (2018, see their Eqs. C9–C11), validating our analysis333González-Fernández et al. (2018) calculate these differences on calibrated VISTA photometry over different sky regions, while here this was done for the converted 2MASS magnitudes only in the VVV sky footprint. Hence, these differences are not expected to be exactly the same, owing to the different sky areas covered by stars of the two samples, as well as the extinction terms in Eqs. 1–6..
4 Revision of the -band VVV photometry
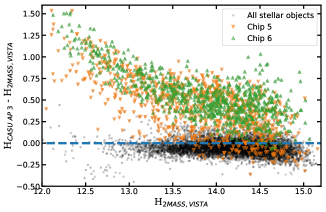
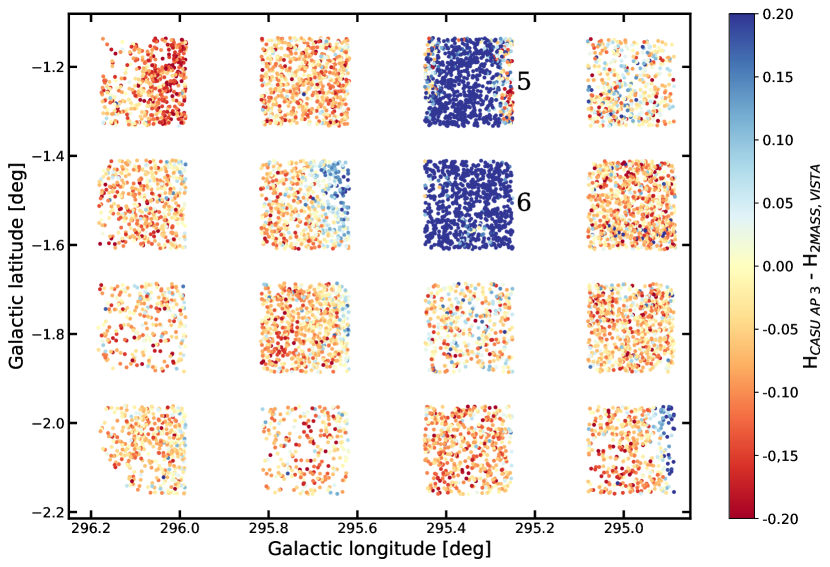
The converted 2MASS magnitudes obtained in Sect. 3 allow an independent check of the photometry delivered by the VDFS. Fig. 2 shows the differences between the converted 2MASS -band magnitudes of stellar sources and their VISTA photometry as provided by CASU (version 1.3), in one particular pawprint of the low source density VVV field d001 (see Minniti et al. 2010 for field definitions). It is immediately apparent that the joint magnitude zero-point calibration of the entire pawprint causes underestimated magnitudes on chips 5 and 6, and generally overestimated magnitudes in the rest of the chips. The distribution of magnitude differences even show small-scale systematic variations within some of the chips.
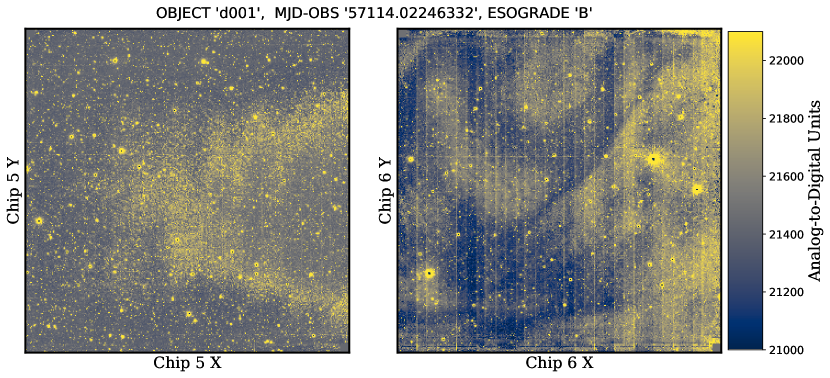
The original, reduced -band VISTA images from chips 5 and 6 are shown in Fig. 3. Both images exhibit very apparent artifacts, probably caused by the non-linearity of these two chips when the “sky background” (i.e., the atmospheric foreground flux) is high. The straight lines across chip 6 possibly originate from imperfections in the detector’s manufacturing process.
The distribution of -band magnitude differences for the same pawprint of field d001 are shown in Fig. 4. In accordance with Fig. 2, the magnitudes in chips 5 and 6 are underestimated, while they are generally overestimated on all other chips. Magnitudes measured in chips 5 and 6 also show large dispersion and non-linearity. In contrast, the magnitudes from the other chips show small dispersions and no apparent non-linearity under the same sky conditions. Therefore, photometric measurements obtained with these chips in the -band should generally be reliable after a chip-wise zero-point correction. Meanwhile, -band photometry acquired by chips 5 and 6 under suboptimal conditions should generally be treated as suspect. Indeed, the same behavior of the VIRCAM detectors can frequently be observed for other fields during the entire timespan of the VVV survey. While it is advisable to avoid using these affected observations, this is not practical in every case. Unfortunately, for most of the VVV fields, only two -band epochs have been obtained during the course of the survey, and, depending on the science case, it might be unavoidable to use them.
It has to be noted that similar offsets, apparently caused by unfavorable observing conditions, were not found in the case of the and photometry, as the atmospheric flux in those bands is generally lower.
5 VVV magnitude zero-point bias in dense stellar fields
The converted 2MASS photometry from Sect. 3 allows a general revision of the VISTA photometry for all filters. In the following, we investigate the effect of source crowding on the photometric calibration of VVV data in the , , and bands, in version 1.3 of the VISTA photometric system.
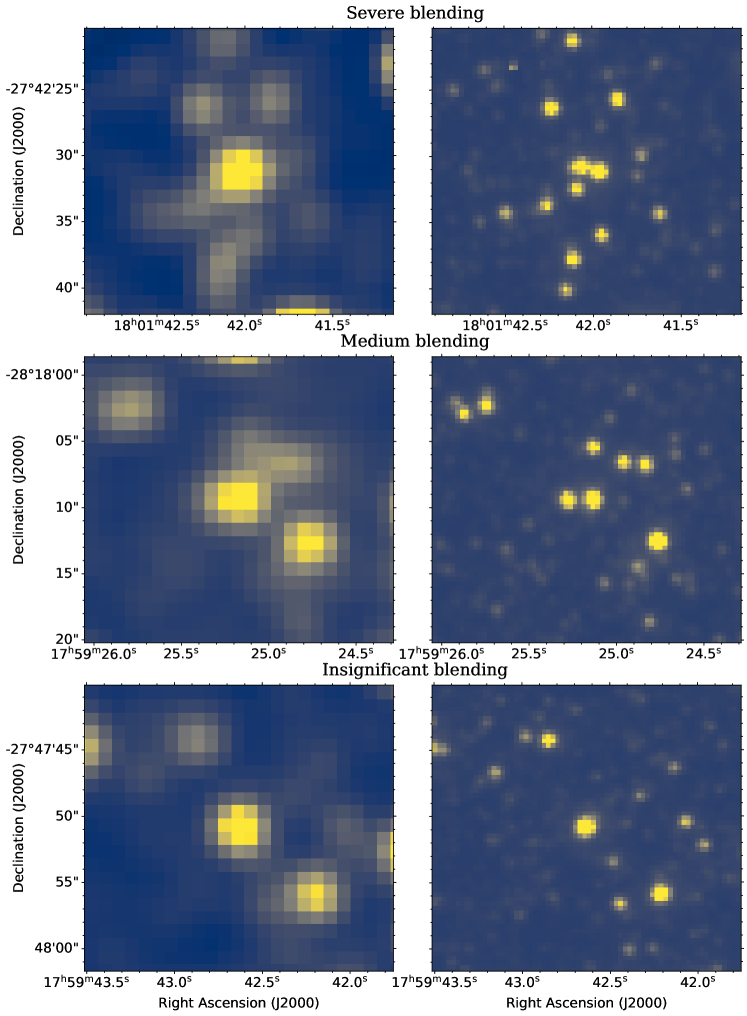
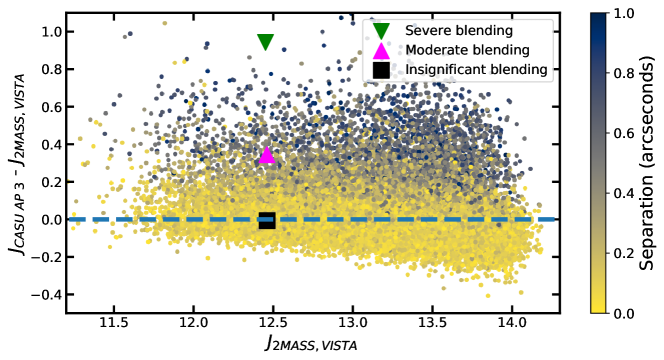
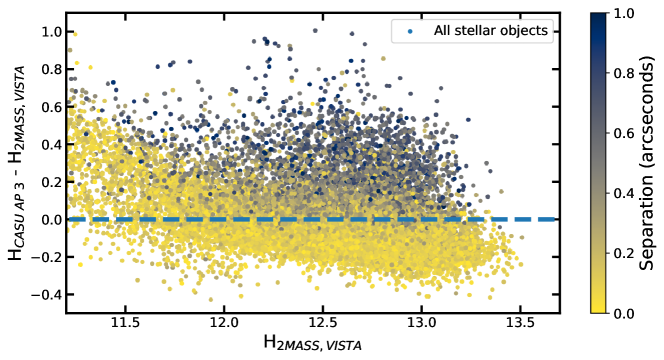
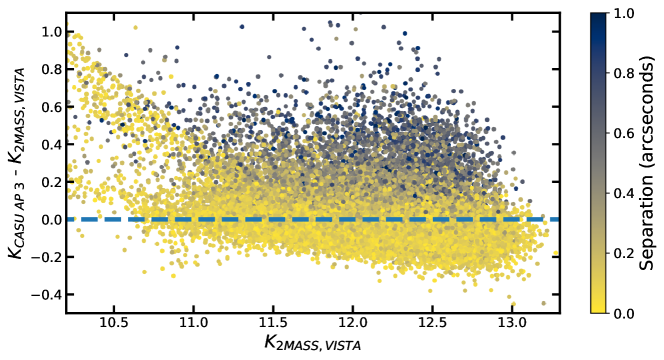
Aside from the area toward the nuclear bulge, one of the fields with the highest source density is b307, due to its position toward Baade’s Window. The top, middle and bottom panels of Fig. 5 compare the VDFS-calibrated VVV magnitudes of stellar sources and the corresponding converted 2MASS measurements for the , , and bands, respectively, for all stellar sources from a single pawprint of field b307. Most of the fainter stars (2MASS magnitude ) are offset from the fiducial line. Furthermore, most outliers from the main locus have positive deviations, meaning that the same sources appear systematically dimmer in the CASU source catalog with respect to 2MASS. Visual inspection of images taken by both surveys revealed that almost all of the latter stars are blended in the 2MASS observations, while typically being resolved into 2–4 separate point sources by VISTA. Examples of severe, medium and insignificant blending in the 2MASS observations are shown in Fig. 6, for the individually marked sources in the top panel of Fig. 5.
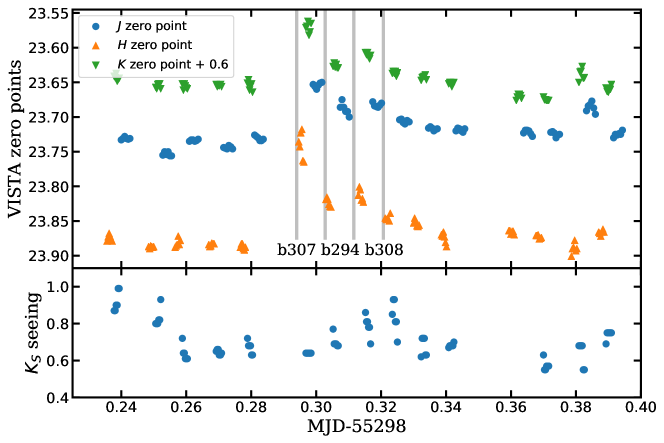
CASU’s calibration pipeline calculates the zero-points of individual pawprints as the mean difference between the instrumental magnitudes of point sources and their converted 2MASS counterparts. In fields of high stellar density, several VISTA sources can be blended into one 2MASS source. The positional cross-matching procedure of CASU does not take this effect properly into account by allowing loose tolerances, leading to the photometric zero-point bias revealed here. Fig. 7 illustrates the spatial dependence of this bias, showing the change in magnitude zero-points as measured by the CASU pipeline during 4 hours of VISTA observations of VVV fields. For comparison, the variation in the atmospheric seeing measured on the -band observations is also shown. These two quantities are clearly not correlated with each other. During this particular night, VISTA was acquiring multi-band observations for the VVV survey, hence the availability of all three of the bands , , and . Near the beginning and the end of this night, images were taken in uncrowded fields far from the Galactic plane, while during the middle of the night, the densest VVV tiles were observed. Besides low stellar densities, high extinction can also reduce the size of this bias by diminishing the detection rate of faint 2MASS sources. It should be noted that quite possibly other effects contribute to these (apparent) biases: on the one hand, it is not straightforward to disentangle sky transparency changes during the night from other photometric biases. On the other hand, stellar magnitudes converted to the VISTA version 1.3 system from 2MASS depend on the individually estimated extinction values (especially in the bands, see Eqs. 1–3), which is also estimated differently for the two versions, therefore they are not as robust as those based on the more recent v1.5 conversion formulae.
CASU also provide photometric catalogs for tile images, resulting from the combinations of six pawprints acquired at the same epoch. González-Fernández et al. (2018) describe a grouting process for the correction of tile-based photometry, whereby they take into account the photometric zero-point offsets between individual pawprints of a tile, among other effects. They attribute these offsets to variations in the PSF between successive pawprint observations. However, we stress that varying levels of zero-point calibration bias due to blending also come into play in generating such offsets within a single observational epoch. Each pawprint of a tile covers a slightly different subregion of a field due to their pointing offsets. If the distribution of interstellar extinction significantly differs between these subregions, then the amount of crowding, and hence the blending in the 2MASS catalog, will vary between pawprints. As blending biases the pawprint zero-points, varying levels of blending between VISTA pawprints increase the scatter of zero-points measured by the CASU pipeline, providing an additional source of pawprint-to-pawprint variation, measured and partially corrected in the grouting process. We hypothesize that this effect can be seen in Fig. 7 as an increased scatter in the pawprint zero-points for fields with high stellar density; however, the less robust calibration of version 1.3 of the VISTA photometry probably also contributes to the high scatter observed in Fig. 7 for crowded tiles.
6 Recalibration of the observations in the VVV survey
As the photometric biases detailed in Sects. 4 and 5 mostly manifest themselves in the zero-points of the VIRCAM detectors and the VISTA pawprint observations, respectively, they can mostly be corrected for by a revision of the per-detector zero-points.
The zero-point calculation procedure of González-Fernández et al. (2018) allows a relatively large, 1 arcsecond cross-match radius of tolerance between positions in the 2MASS catalog and the VVV source catalogs. The color scale in Fig. 5 shows the angular separation between the VVV sources and their cross-matched 2MASS equivalents. Most notably, the 2MASS stellar sources lying above the fiducial lines (hence probably being blends in the 2MASS catalog) generally have higher separations than those belonging to the main locus of unblended stars. Naturally, as many sources are blended in the 2MASS Point Source Catalog towards fields with high stellar density, not only their magnitudes, but also their measured positions are affected by the blending, which explains the increased positional errors.
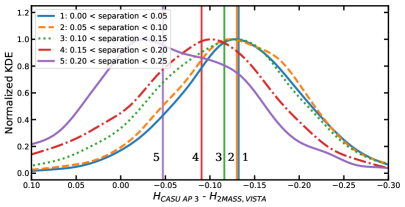
The dependence of the bias on the cross-match radius is further examined in Fig. 8 for the same -band pawprint of the VVV field b307, shown previously on the middle panel of Fig. 5. It can be seen that for higher angular separations, the VVV magnitudes become progressively fainter due to the increasing fraction of blending in the 2MASS catalog with increasing tolerance in the cross-matching. With a tolerance of 0.1 arcseconds, the effect of blending becomes minimal, as shown by the median values of the samples, marked by vertical bars.
We developed a method for correcting the magnitude zero-points of individual detectors, taking into account the specific properties of the VVV survey’s observations. The calibration process described by González-Fernández et al. (2018) calculates zero-points on the pawprint level. The principal reason for this is to guarantee that enough 2MASS stars are available for the robust determination of zero-points, even in high Galactic latitude fields. As VVV fields are generally rich in stars, we calculate the zero-point corrections for each detector chip separately in each pawprint of each epoch for the five smallest apertures. The main points of this correction method are the following:
-
•
The 2MASS Point Source Catalog converted to the VISTA version 1.5 system (Sect. 3) is used as the source catalog for the (re)calibration of VVV observations. As in some cases non-linearity affects VISTA observations down to 12.5 magnitudes (see middle panel of Fig. 5), only observations fainter than this limit are used.
-
•
Unified source catalogs of each VVV field are created using the procedure of Dékány et al. (2018). They are cross-matched with the converted 2MASS catalog with a tolerance of 0.15 arcseconds. The small cross-match radius helps in diminishing the effect of the photometric bias due to the different blending characteristics between the 2MASS and VISTA observations (see Sect. 5). Although this effect becomes non-marginal for cross-match radii larger than 0.1 arcseconds, it remains fairly small until 0.15 arcseconds (see Fig. 8), and the increased source counts help in deriving a more robust zero-point correction in tiles with lower stellar densities.
-
•
The zero-point correction is calculated for each detector and each aperture of each pawprint observation as the median difference between the magnitudes of stellar sources and their corresponding converted 2MASS magnitudes. The median difference is preferred over the mean, as it is a more robust statistic in the presence of outliers (for example, variable stars).
-
•
Individual light curves are corrected for the VISTA zero-point biases by subtracting the appropriate zero-point corrections from their original CASU magnitudes, on a frame-by-frame basis.
| Aperturec | d | ||||||||||||||
| Field | OBSa | Band | Chip | ZPTb | 1 | 2 | 3 | 4 | 5 | 1 | 2 | 3 | 4 | 5 | Nstarse |
| d001 | v20100314_00245 | 1 | 23.702 | -0.011 | -0.012 | -0.011 | -0.013 | -0.017 | 0.053 | 0.046 | 0.043 | 0.044 | 0.052 | 585 | |
| d001 | v20100314_00245 | 2 | 23.699 | +0.008 | +0.007 | +0.006 | +0.002 | -0.003 | 0.055 | 0.055 | 0.051 | 0.050 | 0.052 | 834 | |
| d001 | v20100314_00221 | 1 | 23.848 | +0.009 | +0.014 | +0.014 | +0.013 | +0.007 | 0.061 | 0.056 | 0.048 | 0.048 | 0.057 | 497 | |
| d001 | v20100314_00221 | 1 | 23.850 | +0.031 | +0.033 | +0.031 | +0.028 | +0.024 | 0.060 | 0.052 | 0.050 | 0.049 | 0.056 | 787 | |
| d001 | v20100129_00205 | 1 | 22.913 | +0.009 | +0.012 | +0.013 | +0.015 | +0.021 | 0.076 | 0.063 | 0.062 | 0.058 | 0.066 | 470 | |
| d001 | v20100129_00205 | 2 | 22.907 | +0.021 | +0.024 | +0.029 | +0.032 | +0.039 | 0.068 | 0.063 | 0.059 | 0.060 | 0.063 | 651 | |
| a Identifier of the VISTA pawprint. | |||||||||||||||
| b Value of the magnitude zero-point header keyword MAGZPT in the CASU v1.3 files. | |||||||||||||||
| c Magnitude zero-point corrections for the five smallest apertures, calculated from the median difference. | |||||||||||||||
| d Standard deviation calculated from the median absolute deviation (in mag units), of the VISTA–2MASS measurements | |||||||||||||||
| (i.e., MAD). The formal error of the calculated magnitude offsets should be taken as the value given here, divided | |||||||||||||||
| by the square root of the number of stars used to estimate the offset. | |||||||||||||||
| e Number of VISTA–2MASS stars used to calculate the photometric offsets. | |||||||||||||||
The format of the correction offsets, calculated for every combination of pawprint observations, VIRCAM detectors, and the five smallest apertures provided by CASU, for the obserations in the VVV survey, are shown in Table 1.
7 Effects of the recalibration
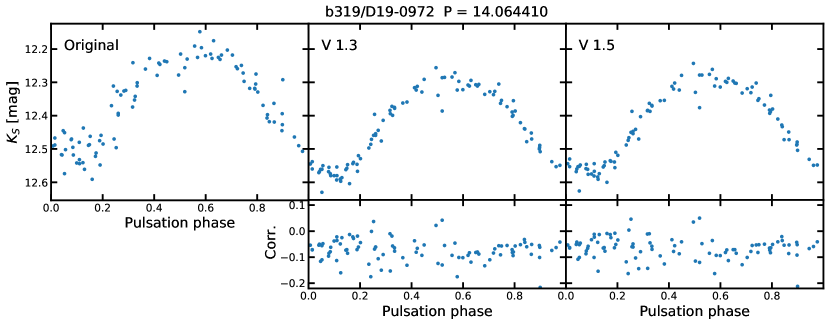
After calculating the photometric zero-point corrections as described in Sect. 6, the full effect of the zero-point biases described in Sects. 4 and 5 can be evaluated. However, in order to also assess the effect of the change of the conversion equations between versions 1.3 and 1.5 of VISTA photometric system and 2MASS photometry, we have calculated the correction offsets for the former version as well, allowing its direct estimation. Fig. 9 illustrates the effect of our recalibration on the light curves of four Cepheid variables. In the case of three Cepheids from the moderately crowded tile b319, their mean brightnesses in the band have decreased by about 0.1 magnitudes. Furthermore, the scatter in their light curves decreased by about one order of magnitude. The fourth Cepheid illustrates the mostly constant photometric offsets between different chips in the case of a VVV disk tile, which also contributes to the light curve scatter. The fact that the quality of the light curves has improved so drastically validates the choice of the chip-based recalibration of the photometric zero-points. As for the effect of staying in the VISTA v1.3 or changing to the v1.5 system, for individual stellar light curves, the only obvious difference between them are the slightly higher zero points for the latter.
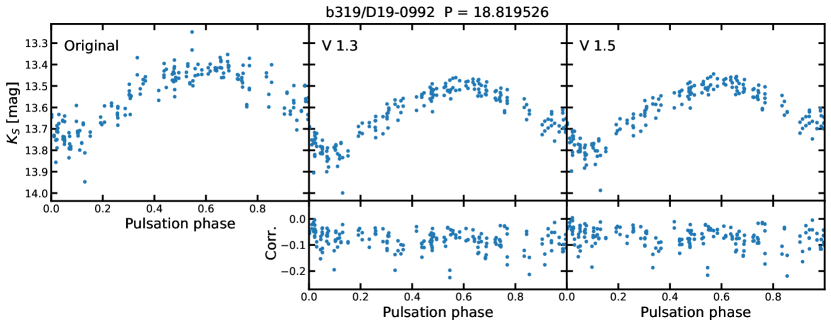
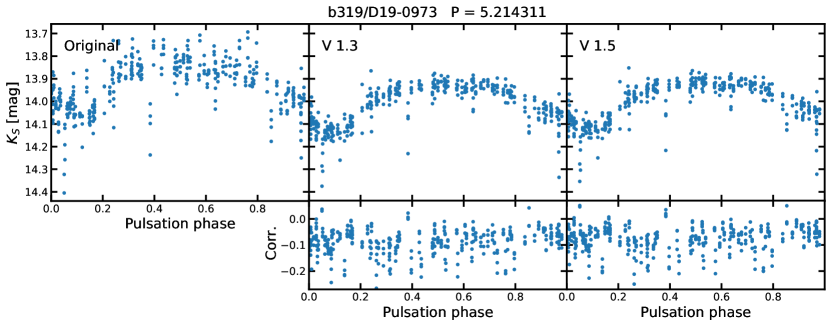
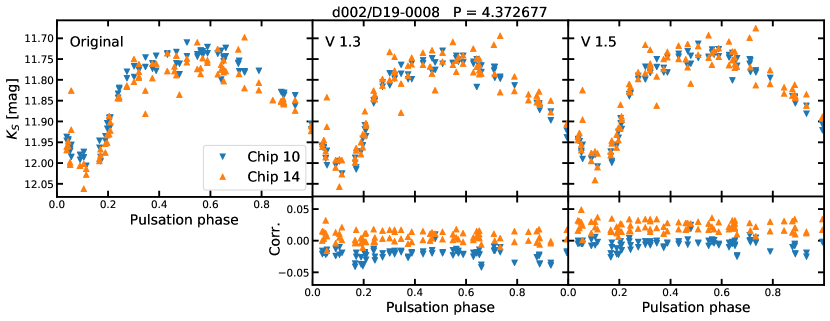
The spatial distribution of the magnitude offsets is affected by the pawprint pattern, as well as by the apparent temporal variation of the zero-point bias, most probably due to changes in the observing conditions and variations in telescope pointing. The decreased scatter of the light curves shown in Fig. 9 is a result of correcting for these effects. However, it is also necessary to visualize the effect of the zero-point bias on the VISTA photometry over small spatial scales.
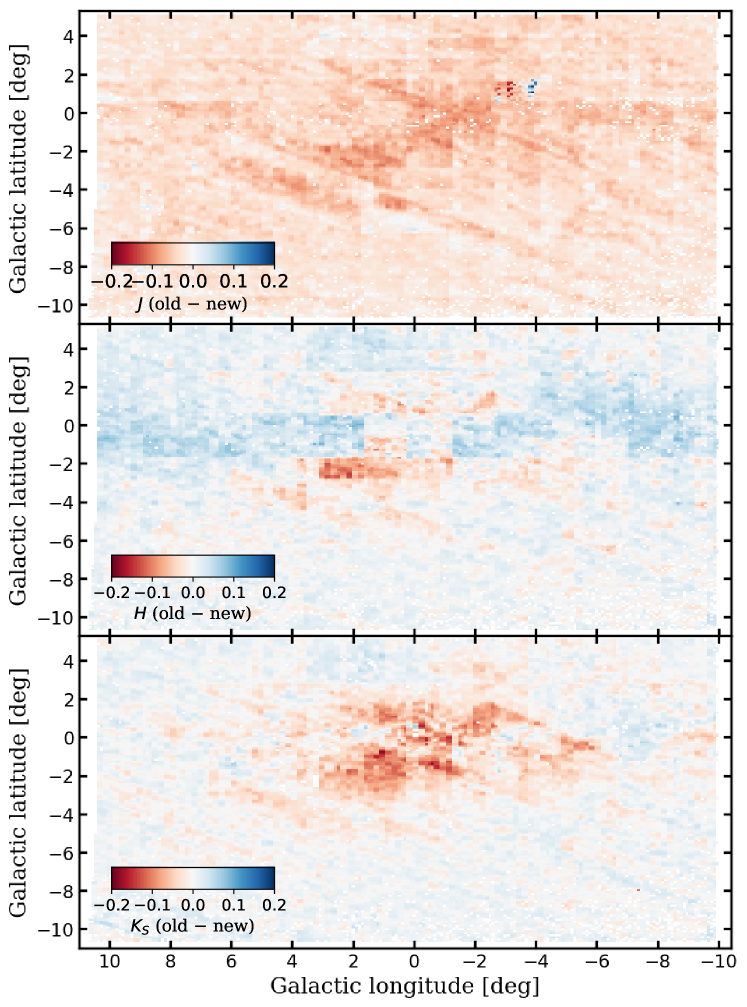
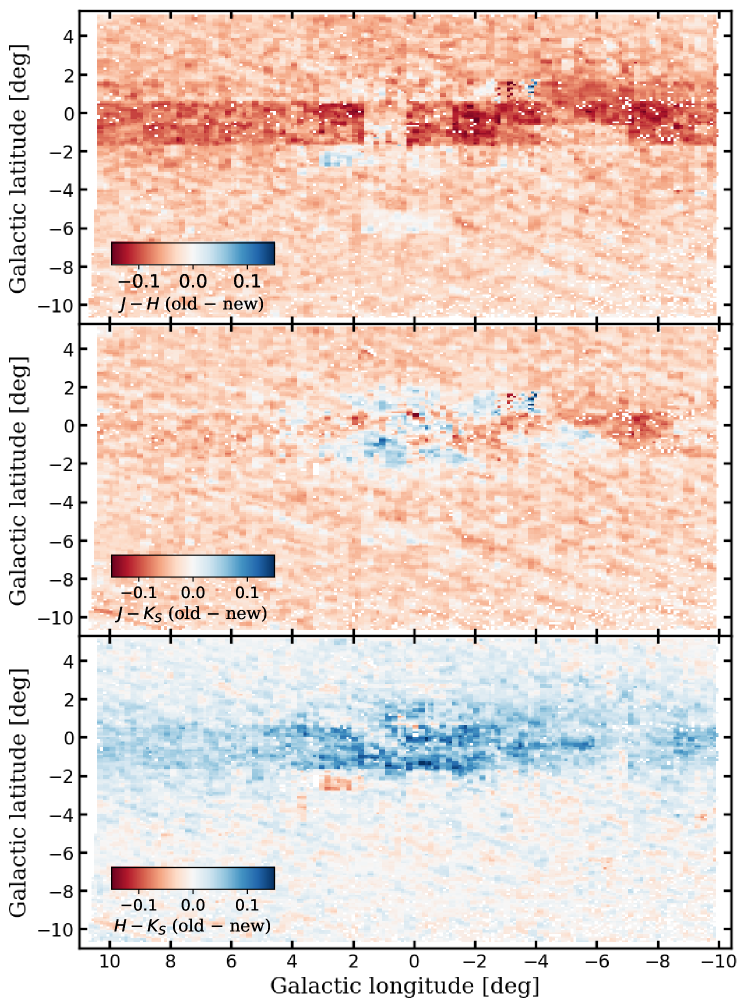
We have constructed a uniform grid in Galactic coordinates, with gridpoints separated by in both longitude and latitude, covering the entire bulge area of the VVV survey. For each of the gridpoints, all sources within a cross-match radius of were identified in the unified source catalogs (Sect. 6). These allowed us to determine which of the VIRCAM chips fell onto each of the gridpoints, along with the timings of the observations. In turn, this information allowed the identification of the magnitude offset corrections (calculated in Sect. 6) which contribute to the magnitude differences at each of these coordinates. The spatial distribution of the median values of the corrections in the , , and bands across the bulge area are shown in Fig. 10. Likewise, the biases in their color indices are shown in Fig. 11. In the outer regions of the bulge, the magnitude and color differences are minimal, due to the minimal blending of VISTA calibrator stars in the 2MASS catalog. The small systematic differences in each band, seen towards the outer regions of the Galactic bulge, are caused by the systematic difference between the VISTA version 1.3 and 1.5 photometric systems. In contrast to this, in the tiles closest to the Galactic plane, the different handling of the color excess caused by interstellar reddening in the two versions of the VISTA photometry causes an additional systematic offset: is limited to a maximum value of 10, while has a maximum value of (the exact value depends on the observed color of the particular 2MASS source). This effect can be most clearly seen on the top panel of Fig. 11. Besides these offsets, toward regions of high stellar density, such as Baade’s Window at , the difference increases drastically. It has to be noted that this difference behaves markedly differently from one filter to the next, most probably due to the different intrinsic colors and amount of extinction that each star in the converted 2MASS catalog (Sect. 3) is subject to. The diagonal streaks, mostly seen in the band across the southern side of the bulge, are artifacts following the 2MASS scanning pattern and point toward zero-point offsets on the order of 0.01 mag in those regions. These artifacts appear because while we computed the photometric zero-point offsets individually for each chip, in the original CASU photometry, the zero points were determined by per pawprint, thus they are averaged over these areas.
In order to evaluate the effect of changing the 2MASS–VISTA conversion formulae between versions 1.3 and 1.5, the construction of photometric offset maps was repeated with the correction factors calculated for the former system. The resulting maps showed the same structure as seen in Figs. 10 and 11, therefore they are not repeated here. In is worth noting that due to the offset between the magnitude scales between the two systems (Equations C9–C11 of González-Fernández et al. 2018), the calculated correction factors become virtually zero in the outer regions of the bulge in the case of version 1.3 of VISTA photometry.
8 Conclusions and recommendations for the future usage of VISTA observations
We have shown that the standard photometric source catalogs of the VVV survey produced by the VDFS suffer from space- and time-varying zero-point biases. For this reason, some of the results based on VVV (and, more generally, VISTA) observations will probably need to be revised, in order to be placed on a firmer footing. For example, studies of the extinction law would likely benefit from a revision, since both the derived apparent magnitudes and colors vary towards different regions of the Galactic bulge (Figs. 10 and 11). For example, Nataf et al. (2016) studied the spatial variation of the extinction law based on combined VVV and OGLE-IV photometry by tracing the changes in the color excesses of the red clump stars across the bulge. Although they measured stellar magnitudes by a custom point-spread function (PSF) fitting photometry, their zero-point calibration is based on the CASU photometric catalogs, and thus their data likely inherit the spatial zero-point bias structure shown in Fig. 10. Nataf et al. (2016) found pairs of sight-lines where the respective red clumps occupy the same position on the vs color-magnitude diagram, yet have very different colors (their Figs. 5 and 6). Based in part on this, they concluded that the extinction curve has a non-standard shape towards the Galactic bulge. As the compared fields are not on the same VVV pawprint or even tile, their and magnitude zero-points, and thus every color index derived from these quantities is likely affected by the zero-point bias in different ways. Studies of the nature, shape, and spatial variations of the extinction law would thus likely benefit from a deeper reexamination of the VVV photometry.
Another area profiting immensely from the improved photometry is variable star studies. A cautionary example is that of our own search for Classical Cepheids in VVV photometry. In Dékány et al. (2015), we have claimed the existence of Classical Cepheids in a thin disk within the volume of the Galactic bulge, based on VVV data. This claim was challanged by Matsunaga et al. (2016), based on their own near-infrared observations. As pointed out in Section 6 of Dékány et al. (2019), the tension was partly caused by the mag overestimation of the color excess in the uncorrected VISTA magnitudes, which propagated into the calculated absolute extinctions, and hence distances of the variables. The VISTA photometry, after applying the correction factors given in Table 1, gives consistent color excess estimates for the Cepheids common between our work and that of Matsunaga et al. (2016).
In this sense, the relatively simple recalibration procedure described in Sect. 6, and provided in Table 1, should serve only as a temporary measure in future studies utilizing VISTA observations. In the case of the anomalous -band measurements affected by the high sky background, we recommend that they are discarded in future studies. However, in some cases they might be the only -band measurements available for some sources. Therefore, zero-point corrections are also included for these data in Table 1, with the caveat that the measurements will have high errors due to the non-linearity of the detectors (especially chips 5 and 6) for such observations. The selection of non-blended 2MASS stars based on their cross-match radius that we adopted is a very preliminary approach, as it still leaves a considerable fraction of blended stars in the sample for certain fields that is used for computing the zero-point corrections. Ideally, each and every 2MASS star used in the zero-point calibration of VISTA observations should be revised and potentially discarded if the VISTA observations reveal close companions within the 2MASS PSF.
Particularly in the most crowded VVV fields, PSF photometry has already proven its great value in generating deep color-magnitude diagrams and enabling time-series studies, even of faint sources (e.g., Alonso-García et al., 2018; Contreras Ramos et al., 2018; Braga et al., 2019). For PSF photometry, the light-curve scatter caused by the varying offsets between individual epochs (see the difference in scatter between corrected and uncorrected light-curves in Fig. 9) is expected to be minimized, if the data are calibrated to a single epoch of CASU aperture photometry. However, the spatially varying zero-point offsets shown in Fig. 10 might be expected to directly propagate into the zero points of the PSF photometry if said catalogs are used to derive them (as commonly done). As an alternative, a custom calibration based on the converted 2MASS photometry can be recommended for the zero-point calibration of PSF measurements, together with implementing additional steps for rejecting blended stars in the 2MASS catalog. Towards the Galactic center, PSF photometry has the unique power of resolving individual stellar sources in the VVV survey. The centermost tiles are generally observed right after and/or before more outlying tiles. Therefore, the zero-points derived for these flanking tiles could be adopted as the zero-points for the photometry of Galactic center tiles.
Alternatively, the repeated observations of tiles under photometric conditions could be used in an “Ubercal”-like calibration scheme (Schlafly et al., 2012; Magnier et al., 2013), allowing the absolute zero points of dense tiles to be calibrated internally to less dense tiles. In the case of the VVV survey, in the bands the number of repeated observations is very low, and as seen in Sect. 4, observations were sometimes taken under poor observing conditions, prohibiting their use for Ubercal. Therefore, most probably only the repeated -band observations of VVV would be suitable for this calibration scheme for the complete survey area. Given the high amount of crowding present in the most densely populated tiles of the VVV survey, this operation should attempted using PSF photometry, preferably.
Acknowledgements.
We gratefully acknowledge the constructive comments provided by the referee, Carlos González-Fernández, which helped to improve this work. G.H. and M.C. gratefully acknowledge the support provided by FONDECYT through grant #1171273; by the Ministry for the Economy, Development, and Tourism’s Millennium Science Initiative through grant IC 120009, awarded to the Millennium Insitute of Astrophysics (MAS); and by Proyecto Basal AFP-170002. I.D. and E.K.G. were supported by Sonderforschungsbereich SFB 881 “The Milky Way System” (subproject A03) of the German Research Foundation (DFG Project-ID 138713538). The research leading to these results has received funding from the European Research Council (ERC) under the European Union’s Horizon 2020 research and innovation programme (grant agreement No 695099).References
- Alonso-García et al. (2015) Alonso-García, J., Dékány, I., Catelan, M., et al.: Variable Stars in the VVV Globular Clusters. I. 2MASS-GC 02 and Terzan 10. The Astronomical Journal 149, 99 (2015)
- Alonso-García et al. (2018) Alonso-García, J., Saito, R. K., Hempel, M., et al.: Milky Way demographics with the VVV survey. IV. PSF photometry from almost one billion stars in the Galactic bulge and adjacent southern disk. Astronomy & Astrophysics 619, A4 (2018)
- Bonifacio et al. (2000) Bonifacio, P., Monai, S., Beers, T. C.: A Search for Stars of Very Low Metal Abundance. V. Photoelectric UBV Photometry of Metal-weak Candidates from the Northern HK Survey. The Astronomical Journal 120, 2065–2081 (2000)
- Borissova et al. (2011) Borissova, J., Bonatto, C., Kurtev, R., et al.: New Galactic star clusters discovered in the VVV survey. Astronomy & Astrophysics 532, A131 (2011)
- Braga et al. (2019) Braga, V. F., Contreras Ramos, R., Minniti, D., et al.: New type II Cepheids from VVV data towards the Galactic center. arXiv:1904.12024 (2019)
- Casali et al. (2007) Casali, M., Adamson, A., Alves de Oliveira, C., et al.: The UKIRT wide-field camera. Astronomy & Astrophysics 467, 777–784 (2007)
- Chené et al. (2012) Chené, A.-N., Borissova, J., Clarke, J. R. A., et al.: Massive open star clusters using the VVV survey. I. Presentation of the data and description of the approach. Astronomy & Astrophysics 545, A54 (2012)
- Cross et al. (2012) Cross, N. J. G., Collins, R. S., Mann, R. G., et al.: The VISTA Science Archive. 548, A119 (2012)
- Contreras Ramos et al. (2018) Contreras Ramos, R., Minniti, D., Gran, F., et al.: The VVV Survey RR Lyrae Population in the Galactic Center Region. The Astrophysical Journal 863, 79 (2018)
- Dékány et al. (2013) Dékány, I., Minniti, D., Catelan, M., et al.: VVV Survey Near-infrared Photometry of Known Bulge RR Lyrae Stars: The Distance to the Galactic Center and Absence of a Barred Distribution of the Metal-poor Population. The Astrophysical Journal, 776, L19 (2013)
- Dékány et al. (2015) Dékány, I., Minniti, D., Majaess, D., et al.: The VVV Survey Reveals Classical Cepheids Tracing a Young and Thin Stellar Disk across the Galaxy’s Bulge. The Astrophysical Journal, 812, 29 (2013)
- Dékány et al. (2018) Dékány, I., Hajdu, G., Grebel, E. K., et al.: A Near-infrared RR Lyrae Census along the Southern Galactic Plane: The Milky Way’s Stellar Fossil Brought to Light. The Astrophysical Journal 857, 54 (2018)
- Dékány et al. (2019) Dékány, I., Hajdu, G., Grebel, E. K., Catelan, M.: Into the Darkness: Classical and Type II Cepheids in the Zona Galactica Incognita. The Astrophysical Journal 883, 58 (2019)
- Emerson et al. (2004) Emerson, J. P., Irwin, M. J., Lewis, J., et al.: VISTA data flow system: overview. Proceedings of SPIE 5493, 401 (2004)
- Gonzalez et al. (2012) Gonzalez, O. A., Rejkuba, M., Zoccali, M., et al.: Reddening and metallicity maps of the Milky Way bulge from VVV and 2MASS. II. The complete high resolution extinction map and implications for Galactic bulge studies. Astronomy & Astrophysics 543, A13. (2012)
- González-Fernández et al. (2018) González-Fernández, C., Hodgkin, S. T., Irwin, M. J., et al.: The VISTA ZYJHKs photometric system: calibration from 2MASS. Monthly Notices of the Royal Astronomical Society 474, 5459–5478 (2018)
- Hajdu et al. (2018) Hajdu, G., Dékány, I., Catelan, M., Grebel, E. K., Jurcsik, J.: A Data-driven Study of RR Lyrae Near-IR Light Curves: Principal Component Analysis, Robust Fits, and Metallicity Estimates. The Astrophysical Journal 857, 55 (2018)
- Hodgkin et al. (2009) Hodgkin, S. T., Irwin, M. J., Hewett, P. C., Warren, S. J.: The UKIRT wide field camera ZYJHK photometric system: calibration from 2MASS. Monthly Notices of the Royal Astronomical Society 394, 675–692 (2009)
- Irwin et al. (2004) Irwin, M. J., Lewis, J., Hodgkin, S., et al.: VISTA data flow system: pipeline processing for WFCAM and VISTA. Proceedings of SPIE 5493, 411–422 (2004)
- Magnier et al. (2013) Magnier, E. A., Schlafly, E., Finkbeiner, D., et al.: The Pan-STARRS 1 Photometric Reference Ladder, Release 12.01. The Astrophysical Journal Supplement 205, 20 (2013)
- Minniti et al. (2010) Minniti, D., Lucas, P. W., Emerson, J. P., et al.: VISTA Variables in the Vía Láctea (VVV): The public ESO near-IR variability survey of the Milky Way. New Astronomy 15, 433–443 (2010)
- Minniti (2018) Minniti, D. 2018, The Vatican Observatory, Castel Gandolfo: 80th Anniversary Celebration, 51, 63
- Matsunaga et al. (2016) Matsunaga, N., Feast, M. W., Bono, G., et al.: A lack of classical Cepheids in the inner part of the Galactic disc, Monthly Notices of the Royal Astronomical Society 462, 414 (2016)
- Nataf et al. (2016) Nataf, D. M., Gonzalez, O. A., Casagrande, L., et al.: Interstellar extinction curve variations towards the inner Milky Way: a challenge to observational cosmology. Monthly Notices of the Royal Astronomical Society 456, 2692–2706 (2016)
- Jurcsik et al. (2018) Jurcsik, J., Hajdu, G., Dékány, I., et al., Blazhko modulation in the infrared. Monthly Notices of the Royal Astronomical Society 475, 4208–4222 (2018)
- Schlafly et al. (2012) Schlafly, E. F., Finkbeiner, D. P., Jurić, M., et al.: Photometric Calibration of the First 1.5 Years of the Pan-STARRS1 Survey. The Astrophysical Journal 756, 158 (2012)
- Schlegel et al. (1998) Schlegel, D. J., Finkbeiner, D. P., Davis, M.: Maps of Dust Infrared Emission for Use in Estimation of Reddening and Cosmic Microwave Background Radiation Foregrounds. The Astrophysical Journal 500, 525–553 (1998)
- Schultheis et al. (2014) Schultheis, M., Chen, B. Q., Jiang, B. W., et al.: Mapping the Milky Way bulge at high resolution: the 3D dust extinction, CO, and X factor maps. Astronomy & Astrophysics 566, A120 (2014)
- Skrutskie et al. (2006) Skrutskie, M. F., Cutri, R. M., Stiening, R., et al.: The Two Micron All Sky Survey (2MASS). The Astronomical Journal 131, 1163–1183 (2006)
- Sutherland et al. (2015) Sutherland, W., Emerson, J., Dalton, G., et al.: The Visible and Infrared Survey Telescope for Astronomy (VISTA): Design, technical overview, and performance. Astronomy & Astrophysics 575, A25 (2015)
- Wegg, & Gerhard (2013) Wegg, C., & Gerhard, O.: Mapping the three-dimensional density of the Galactic bulge with VVV red clump stars. Monthly Notices of the Royal Astronomical Society 435, 1874–1887 (2013)