Generating an Overview Report over Many Documents
Abstract
How to efficiently generate an accurate, well-structured overview report (ORPT) over thousands of related documents is challenging. A well-structured ORPT consists of sections of multiple levels (e.g., sections and subsections). None of the existing multi-document summarization (MDS) algorithms is directed toward this task. To overcome this obstacle, we present NDORGS (Numerous Documents’ Overview Report Generation Scheme) that integrates text filtering, keyword scoring, single-document summarization (SDS), topic modeling, MDS, and title generation to generate a coherent, well-structured ORPT. We then devise a multi-criteria evaluation method using techniques of text mining and multi-attribute decision making on a combination of human judgments, running time, information coverage, and topic diversity. We evaluate ORPTs generated by NDORGS on two large corpora of documents, where one is classified and the other unclassified. We show that, using Saaty’s pairwise comparison 9-point scale and under TOPSIS, the ORPTs generated on SDS’s with the length of 20% of the original documents are the best overall on both datasets.
1 Introduction
It is a challenging task to generate an accurate overview report (ORPT) over a large corpus of related documents in reasonable time. This task arises from the need of analyzing sentiments contained in a large number of documents. By “large” we mean several thousand and by ”reasonable time” we mean a few hours of CPU time on a commonplace computer. Moreover, an ORPT should be of a reasonable size to save reading time. For a corpus of about 5,000 documents, for instance, an ORPT should not exceed 20 pages. Moreover, an OPT should be well-structured, organized in two or three levels for easier reading. It should also include figures to highlight frequencies and trends of interesting entities such as names of people and organizations contained in the documents.
Most of the early multi-document summarization (MDS) systems are designed to produce a summary for a handful of documents. For example, the MDS systems [6, 44, 4] are designed to handle the sizes of DUC datasets. The DUC-02, DUC-03, and DUC-04 datasets [9] each consists of only about five hundred documents, and provide bench-marking summaries for MDS tasks each consisting of 10 or fewer documents. Directly applying these MDS systems to generating an ORPT for a corpus containing thousands of documents could possibly generate a proportionately longer and disorganized summary. More recently, T-CMDA [25] was devised to generate an English Wikipedia article on a specific topic over thousands of related documents. However, T-CMDA is still not suitable for generating a well-organized ORPT for a large corpus of documents containing multiple topics.
To accomplish our task, we devise a document generation scheme called NDORGS, which stands for Numerous Documents’ Overview Report Generation Scheme. NDORGS is capable of generating a coherent and well-structured ORPT over a large corpus of input documents. In particular, NDORGS first filters out noisy data, and then uses a suitable SDS algorithm to generate single-document summaries for each document with a length ratio (e.g., , or 0.3) of the original document. For simplicity, we refer to a summary with a length ratio of the original document as a -summary. NDORGS then uses a suitable clustering algorithm to partition the corpus of -summaries into two-level clusters. For each cluster of -summaries, NDORGS generates a section or a subsection using a suitable MDS algorithm, and uses a suitable title generation algorithm to generate a title for that cluster. Finally, NDORGS generates an ORPT by integrating sections and corresponding subsections in the order of descending salience of clusters.
We devise an evaluation method using human evaluations and text mining techniques to measure the quality of ORPTs generated by NDORGS, and use the running time to measure efficiency. We combine the following criteria in descending order of importance: human evaluations, running time, coverage, and diversity, and use multi-attribute decision-making techniques to find the best value of .
Human evaluations follow the standard criteria given in DUC-04 [9], while coverage and diversity are evaluated by comparing, respectively, keyword scores in an ORPT and the original corpus of documents, and the symmetric difference of clusters of keywords. We use Saaty’s pairwise comparison 9-point scale and TOPSIS to determine the best overview. We apply NDORGS to a corpus of 2,200 classified BBC news articles, thereafter referred to as BBC News; and a corpus of 5,300 unclassified articles extracted from Factiva [18] under the keyword search of “Marxism” from the year of 2008 to the year of 2017, hereafter referred to as Factiva-Marx, for a project of analyzing public sentiments. We show that for both datasets, using Semantic WordRank [47] to generate single-document summaries, Latent Dirichlet Allocation (LDA) [2] to cluster summaries, GFLOW [6] to generate a summary over a cluster of summaries, and DTATG [40] to generate a title for a section (or subsection), the ORPTs generated on 0.2-summaries provide the best overall ORPTs. Sensitivity analysis shows that this result is stable.
The rest of this paper is organized as follows: In Section 2 we describe related work, and in Section 3 we present the architecture of NDORGS and the algorithms. We present experiment and evaluation results in Section 4, and trending methods and sample figures in Section 5. We conclude the paper in Section 6.
2 Related Work
We discuss related work on topic modeling, text summarization, and title generation.
2.1 Topic modeling
Topic modeling partitions documents into topic clusters with each cluster representing a unique topic. Latent Dirichlet Allocation (LDA) [2] and Spectral Clustering (SC) [31] are popular topic clustering methods. LDA treats each document in a corpus as a mixture of latent topics that generate words for each (hidden) topic with certain probabilities. As a probabilistic algorithm, LDA may produce somewhat different clusters on the same corpus of documents on different runs. It also needs to predetermine the number of topics. SC is a deterministic and faster clustering algorithm, which also needs to preset the number of topics. It uses eigenvalues of an affinity matrix to reduce dimensions. It then uses k-means to generate clusters over eigenvectors corresponding to the smallest eigenvalues.
Other clustering methods, such as PW-LDA [21], Dirichlet multinomial mixture [45], and neural network models [42], are targeted at corpora of short documents such as abstracts of scientific papers, which are not suited for our task. The documents we are dealing with are much longer. Even if we use summaries to represent the original documents, a summary may still be significantly longer than a typical abstract. We note that the k-NN graph model [26] may also be used for topic clustering.
2.2 Text summarization
Text summarization includes SDS, MDS, hierarchical summarization, and structural summarization.
2.2.1 Single-document summarization
SDS algorithms have been studied intensively and extensively for several decades (for example, see [27, 46, 5, 29, 47]). As it is today, unsupervised, extractive algorithms are still more efficient, more accurate, and more flexible than supervised or abstractive summarization.
Among unsupervised extractive algorithms, the Semantic WordRank (SWR) [47] algorithm is currently the best in terms of both accuracy and efficiency. Built on a weighted word graph with semantic and co-occurrence edges, SWR scores sentences using an article-structure-biased PageRank algorithm [33] with a Softplus function elevation adjustment, and promotes topic diversity using spectral subtopic clustering under the Word-Movers-Distance metric. SWR outperforms all previous algorithms (supervised and unsupervised) over DUC-02 under the standard ROUGE-1, ROUGE-2, and ROUGE-SU4 measures. Over the SummBank dataset, SWR outperforms each of the three human annotators and compares favorably with the combined performance of the three annotators.
2.2.2 Multi-document summarization.
An MDS algorithm takes several documents as input and generates a summary as output. Most MDS algorithms are algorithms of selecting sentences. Sentences may be ranked using features of term frequencies, sentence positions, and keyword co-occurrences [16, 27], among a few other things. Sentences may be selected using algorithms such as graph-based lexical centrality LexRank [10], centroid-based clustering [34], Support Vector Regression [24], syntactic linkages between text [41], and Integer Linear Programming [13, 22]. Selected sentences may be reordered to improve coherence using probabilistic methods [20, 30].
Among all the MDS algorithms, the GLFOW algorithm [6] is focused on sentence coherency. GFLOW is an unsupervised graph-based method that extracts a coherent summary from multiple documents by selecting and reordering sentences to balance coherence and salience over an approximate discourse graph (ADG) of sentences. An ADG considers sentence discourse relations among documents based on relations such as deverbal noun reference, event/entity continuation, discourse markers, sentence inference, and co-reference mentions. In an ADG graph, each node represents a sentence. Two nodes are connected if they have one of the aforementioned sentence relations. Edge weight is calculated based on the number of sentence relations between two sentences.
Based on GFLOW, Yasunaga et al. [44] devised a supervised neural network model that combines Personalized Discourse Graph (PDG), Gated Recurrent Units (GRU), and Graph Convolutional Network (GCN) [19] to rank and select sentences . TCSum [4] is another neural network model that leverages text classification to improve the quality of multi-document summaries. However, neural network methods require large-scale training data to obtain a good result.
More recently Liu et al. [25] devised a large-scale summarization method named T-DMCA to generate an English Wikipedia article. T-DMCA combines extractive summarizations and abstractive summarizations trained on a large-scale Wikipedia dataset to summarize the text. While T-CMDA is capable of creating summaries with specified topics as Wikipedia article, it can hardly generate an overview report for a large corpus of documents containing multiple topics. Moreover, T-DMCA fails on ranking its sub-topics based on their salience.
2.2.3 Hierarchical and structural summarization.
Hierarchical summarization and structural summarization are two approaches to enhancing SDS and MDS algorithms. Buyukkokten et al. [3] and Otterbacher et al. [32] devised algorithms for generating a hierarchical summary of a single document. A hierarchical summarizer for Twitter tweets based on Twitter-LDA summarizes the news tweets into a flexible, topic-oriented hierarchy [12]. SUMMA [7] is a system that creates coherent summaries hierarchically in the order of time, locations, or events. These methods focus on single documents or short texts, or require documents be written with a certain predefined structure template, making them unsuited for our task.
Structured summarization algorithms first identify topics of the input documents. Sauper et al. [38] presented an overview generation system that uses a high-level structure of human-authored documents to generate a topic-structure multi-paragraph overview with domain-specific templates. Li et al. [23] developed a summary template generation system [23] based on an entity-aspect LDA model to cluster sentences and words and generate sentence patterns to represent topics. Autopedia [43] is a Wikipedia article generation framework that selects Wikipedia templates as article structures.
2.3 Title generation
Generating an appropriate title for a block of text is an important task for generating an overview report of multilevel structure, as sections and subsections each needs a title. Alexander et al. [36] attempted to generate an abstractive sentence summary as title for a given document. Ramesh et al. [28] devised an attentional encoder-decoder neural-network model used for machine translation [1] to generate a title for short input sequences (one or two sentences). Shao and Wang [40] devised DTATG for automatically generating an adequate title for a given block of text using dependency tree pruning. In particular, DTATG first extracts a few critical sentences that convey the main meanings of the text and are more suitable to be converted into a title. Each critical sentence is given a numerical ranking score. It then constructs a dependency tree for each of these sentences, and trims certain non-critical branches from the tree to form a new sentence that retains the original meanings and is still grammatically sound. DTATG uses a title test consisting of a number of rules to determine if a sentence is suited for a title. If a trimmed sentence passes the title test, then it becomes a title candidate. DTATG selects the title candidate with the highest ranking score as the final title. Evaluations by human judges showed that DTATG can generate adequate titles.
3 Description of NDORGS
NDORGS (see Fig. 1) consists of five modules: (1) Preprocessing. (2) Hierarchical Topic Clustering. (3) Cluster Summarizing. (4) Cluster Titling. (5) Report Generating.
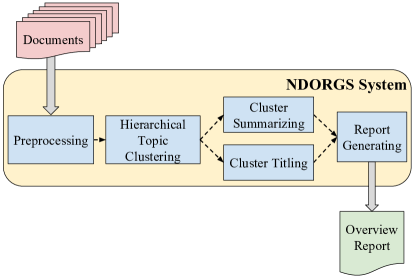
Step 1. Preprocessing (PP)
The PP module performs text filtering and SDS. In particular, it first determines what language an input document is written in, eliminates irrelevant text (such as non-English articles, URLs, and duplicates), and extracts, for each document, the title and subtitles (if any), publication time, publication source, and the main content. It also removes any “interview” type of articles because contents in interviews are too subjective and the structure of an interview is essentially a different genre. It then generates a summary of appropriate length for each document. Extracting summaries is necessary for speeding up the process and is sufficient for generating a good overview because only a small part of the most important content of an article will ultimately contribute to the overview report (also noted in [25]).
Step 2. Hierarchical Topic Clustering (HTC)
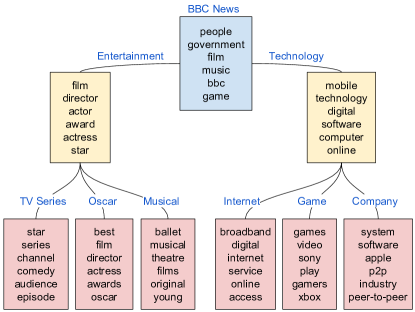
Multiple topics are expected over a large corpus of documents, where each topic may further contain subtopics. Fig. 2 is an example of a hierarchical topic subtree over BBC News. In this subtree, each node is a topic with six most frequent words under the topic. The root illustrates the most frequent words of the corpus. The first level topic cluster contains two subtopics: Entertainment and Technology. When words such as “series”, “comedy”, and “episode” under topic Entertainment are discovered for a substantial number of times, a subtopic of TV Series may be detected. The hierarchically structured topic clusters provide detail information about topic relationships contained in a large corpus of documents.
HTC is designed to capture topic relations. In particular, the HTC module partitions a corpus of documents into multilevel topic clusters and ranks the topic clusters based on their salience. We present a two-level topic clustering algorithm in this paper (three or more level topic clustering is similarly designed). The input can be either the original documents or the summaries generated in Step 1. Note that clustering on the original documents and clustering on the summaries of the documents may result in different partitions (see Section 4.5). For simplicity, we use “documents” to denote both.
In particular, HTC first partitions documents into clusters, denoted by , using a clustering method such as LDA or SC. These are referred to as the top-level clusters. For each top-level cluster , if , where denotes the number of documents contained in and is a preset number (for example, ), then HTC further partitions into sub-clusters as the second-level clusters, where . If in this new clustering, all but one cluster are empty, then this means that documents in cannot be further divided into sub-topics. In this case, we sort the documents in in descending order of document scores and split evenly into clusters (except the last one).
For a second-level cluster of , if , we may further create a third-level sub-clustering by clustering or simply splits evenly into clusters (except the last one), still at the second-level. Note that at each level of clustering, it is possible to have empty clusters.
Assume that cluster consists of documents, denoted by , where . Let denote the probability that belongs to cluster . (Such a probability can be easily computed using LDA.) We define the score of cluster using the following empirical formula:
Step 3. Cluster Summarizing (CSum)
The CSum module generates a coherent summary of an appropriate length for all SDS summaries in a given cluster using an MDS algorithm. This cluster is typically at the second level except when a first-level cluster does not have a second-level cluster (in this case, the cluster is at the first level). In particular, for each second-level cluster, CSum takes its corresponding SDS summaries as input and uses an appropriate MDS to produce a summary of a suitable length.
Step 4. Cluster Titling (CT)
A series of good section headings is one of the most important components in a clear and well-organized overview reports. Since an overview report contains multiple topics, section headings help readers identify the main point of each section in the overview report.
The CT module creates appropriate titles for both first-level and second-level clusters using a title generation algorithm.
Step 5. Report Generating (RG)
As mentioned in Step 2, each cluster has a topic score and each document summary has a corresponding probability score. A higher cluster score represents a more significant topic. The RG module reorders clusters at the same level according to cluster scores in descending order and generates an overview report of up to top-level sections, where each top-level section may also contain up to second-level sections. Each section and subsection has a section title, and each subsection contains an MDS summary.
Example
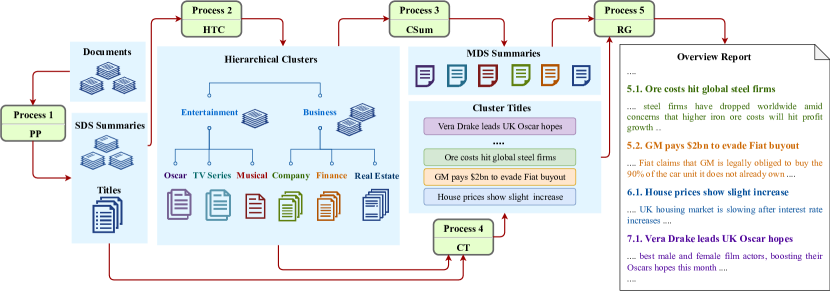
Fig. 3 is an example of the processes of NDORGS with an input of 15 documents. The PP module determines what language an input document is written in, eliminates irrelevant text (such as non-English articles, URLs, and duplicates), and extracts information including the title and the main content. It then generates an SDS summary for each main content. The HTC module groups the fifteen summaries into two-level hierarchical topic clusters, with two top-level clusters, where the cluster Entertainment consists of five document summaries and the cluster Business consists of ten summaries. Both of the top-level clusters have three second-level clusters, where each second-level cluster consists of a number of SDS summaries and is labeled with a unique color. In Step 3, CSum extracts a coherent MDS summary for each second-level cluster summaries and the first-level cluster if there are no second-level clusters. In Step 4, NDORGS produces a section title for each cluster and sub-cluster. Finally, the RG module rearranges the summaries and section titles based on their salience to generate an overview report with a multilevel structure.
4 Evaluations
We describe datasets, selections of algorithms, and parameter setting for evaluating NDORGS.
4.1 Datasets
We use the following two types of corpora:
-
1.
The BBC News dataset [14] of 2,225 classified articles stemmed from BBC News in the years of 2004 and 2005 labeled in business, entertainment, politics, sports, and technology.
-
2.
The Factiva-Marx dataset111The Factiva-Marx dataset is available at http://www.ndorg.net. [11] of 5,300 unclassified articles extracted from Factiva under the keyword search of “Marxism”.
The statistics of these two datasets are shown in Table 1.
| Dataset | # of docs | avg. # of docs / task | # of tokens | avg. # of tokens / doc | vocabulary size |
|---|---|---|---|---|---|
| Factiva-Marx | |||||
| BBC News |
4.2 Selection of algorithms
We use the state-of-the-art Semantic WordRank [47] as the SDS algorithm and GFLOW [6] as the MDS algorithm for NDORGS. In particular, GFLOW needs to solve the following ILP problem:
| maximize | ||||
| subject to | ||||
where variable is a summary, is the number of sentences in the given summary, is the salience score of , is the coherence score of , is a measure between two sentences and , and is the length of sentence . Parameters , , and are learned using the DUC-03 dataset.
4.3 Parameter settings
We determine empirically the setting of parameters that lead to the best overall performance for both BBC News and Factiva-Marx. For each dataset, NDORGS produces three ORPTs222The six ORPTs generated by NDORGS are available at http://www.ndorg.net. corresponding to three summaries, where . The parameter settings are listed below:
-
1.
In the PP module, NDORGS generates single-document summaries for each document with the length ratio , and 0.3.
-
2.
In the HTC module, NDORGS creates two-level topic clusters using LDA. To achieve a higher topic clustering accuracy, we set the number of the top-level clusters to as suggested in Section 4.4 (see Fig. 4). To generate the second-level clusters, we set to determine if a sub-cluster should be further divided (recall that if a cluster contains more than documents, a further division will be performed). The number of second-level clusters is automatically determined by NDORGS using the method mentioned in Step 2 from Section 3.
-
3.
In the CSum module, NDORGS uses GFLOW to produce cluster summaries. The length of an MDS summary of (nonempty) cluster is determined by
-
4.
In the CT module, NDORGS applies DTATG to generate a title for each cluster and sub-cluster.
-
5.
In the RG module, NDORGS reorders clusters at the same level according to cluster scores defined in Section 3. For each level of clusters, if a cluster contains less than 70 documents, then we consider this cluster a minor topic. NDORGS merges such cluster MDS’s into a section under the title of “Other Topics”, where the MDS’s are each listed as a bullet item, in descending order of cluster scores.
4.4 Text clustering evaluations for deciding
Let be a corpus of text documents. Suppose that we have a gold-standard partition of into clusters , and a clustering algorithm generates clusters, denoted by . We rearrange these clusters so that the symmetric difference of and , denoted by , is minimum, where . That is, for all , We define CSD F1-score for and as follows, where CSD stands for Clusters Symmetric Difference:
with and being precision and recall defined by and . Clearly, and is the best possible.
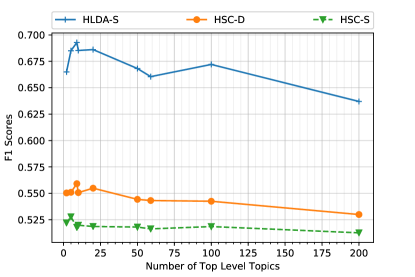
Let HLDA-D, HSC-D, HLDA-S, and HSC-S denote, respectively, the algorithms of applying HLDA and HSC on original documents and 0.3-summaries generated by Semantic WordRank [47].
Comparisons of clustering quality
Fig. 4 compares the CSD F1-scores of HLDA-D, HLDA-S, HSC-D, and HSC-S over the labeled corpus of BBC News articles. We can see that HLDA-D is better than HLDA-S, which is better than HSC-D, and HSC-D is better than HSC-S. All of these algorithms have the highest CSD F1-scores when the number of top-level topics . This is in line with a general experience that the number of top-level sections in an overview report should not exceed 10.
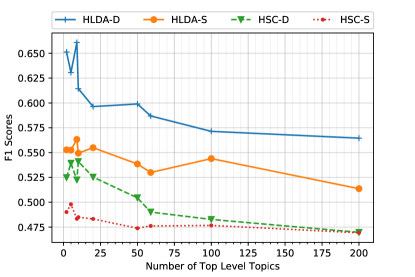
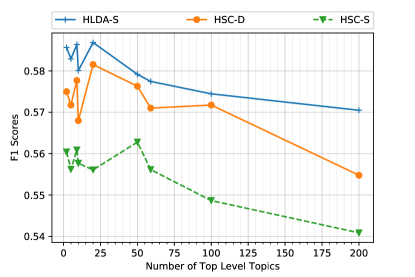
We observe that HLDA-D offers the best accuracy. Thus, we will use the clustering generated by HLDA-D as the baseline for comparing CSD F1 scores. Fig. 5a and Fig. 5b depict the comparison results of HLDA-S, HSC-D, and HSC-S against HLDA-D on BBC News and Factiva-Marx.
Comparisons of clustering running time
Fig. 6 depicts the running time of clustering the BBC News and Factiva-Marx datasets by different algorithms into two-level clusters on a Dell desktop with a quad-core Intel Xeon 2.67 GHz processor and 12 GB RAM. We choose the top-level clusters numbers .
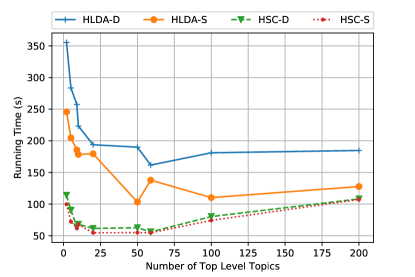
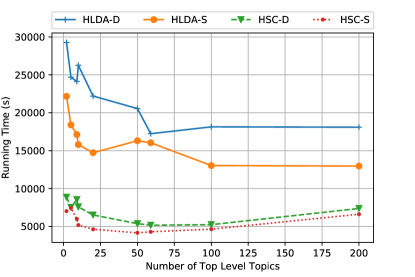
We can see that for both corpora, HSC-S is the fastest, HSC-D is slightly slower, HLDA-D is the slowest, and HLDA-S is in between HLDA-D and HSC-D. We note that this result is expected due to the following two facts: (1) Generating clusters over shorter documents is more time efficient than over longer documents. (2) Spectral clustering SC is much faster than topic-word distribution clustering LDA. We also see that when the number of top-level clusters is small, the two-level clustering running time is high. This is because, for a given corpus, a smaller number of top-level clusters would mean a larger number of second-level clusters, requiring significantly more time to compute. The turning points are around . On the other hand, when the number of top-level clusters is larger, the number of second-level clusters is smaller, which implies a lower time complexity. However, if the number of sections at the same level is too large, it would make a report harder to read. Thus, we need to find a balance.
4.5 Overview reports evaluations
Human judgments
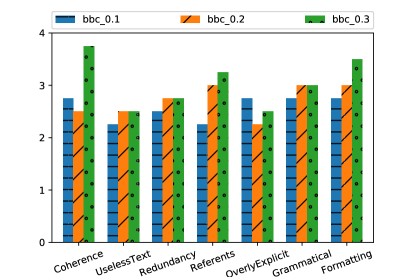
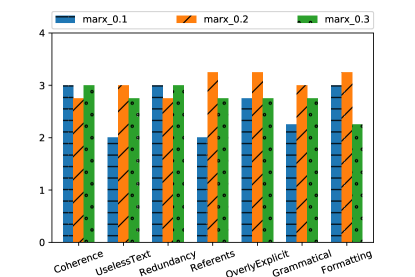
We recruited human annotators from Amazon Mechanical Turk (AMT) to evaluate six ORPTs generated by NDORGS on, respectively, 0.1, 0.2, and 0.3-summaries of documents in the two corpora, where each report was evaluated by four human annotators. Human judgments are based on the following seven categories: Coherence, UselessText, Redundancy, Referents, OverlyExplicit, Grammatical, and Formatting.
An ORPT has a high quality if the following seven categories all have good ratings: (1) Sentences in the report are coherent. (2) The report does not include useless or confusion text. (3) The report does not contain redundancy information. (4) Common nouns, proper nouns, and pronouns are well referenced in the report. (5) The entity re-mentions are not overly explicit. (6) Grammars are correct. (7) The report is well formatted. In particular, we asked AMT annotators to follow the DUC-04 evaluation schema [8] in their evaluations. The evaluation scores are provided in Appendix Table 5.
Fig. 7 depicts the average scores of human annotators using a 4-point system, with 4 being the best. For the BBC News corpus, Fig. 7a shows that the report generated on 0.3-summaries outperforms reports generated on 0.2-summaries and 0.1-summaries in all categories except “OverlyExplicit”. Fig. 7b shows that the report generated on 0.2-summaries is better than reports generated on 0.3-summaries and 0.1-summaries in most of the categories; they are“UselessText”, “Referents”, “OverlyExplicit”, “Grammatical”, and “Formatting”. Note that a larger length ratio of summaries would help NDORGS generate a better report on BBC News, while a smaller length ratio may help NDORGS generate a better report on Factiva-Marx. The reason is likely that the Factiva-Marx corpus contains almost three times more documents than the BBC News corpus, and each document in Factiva-Marx contains on average over ten times larger number of tokens than that in a document from BBC News. This indicates that for a larger corpus, we may want to use summaries of a smaller length ratio for NDORGS to generate a human preferred overview report.
Time efficiency
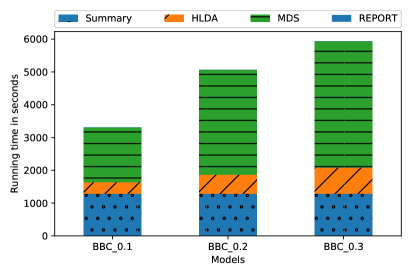
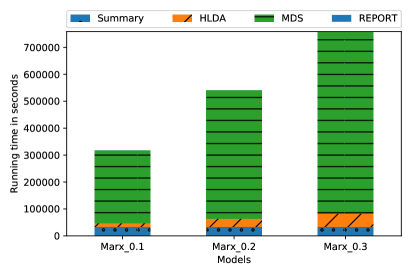
Fig. 8 illustrates the running time of NDORGS on BBC News and Factiva-Marx, with the following results:
-
1.
NDORGS incurs, respectively, about 80% and 56% more time to generate an overview report on 0.3-summaries and 0.2-summaries than 0.1-summaries (see Fig. 8a).
-
2.
NDORGS incurs, respectively, over 2 times and 1.8 times longer to generate an overview report on 0.3-summaries and 0.2-summaries than it does on 0.1-summaries (see Fig. 8b).
-
3.
NDORGS achieves the best time efficiency on 0.1-summaries and the summary length ratios have significantly impacts on time efficiency: Working on a larger summary length ratio incurs a longer running time.
The seven evaluation criteria do not include information coverage and topic diversity, for it is formidable for a human annotator to read through several thousand documents and summarize information coverage and topic diversity of these documents. To overcome this obstable, we use text mining techniques described in the following two subsections.
Information coverage
We evaluate information coverage via comparison of the top words in an overview report and the top words in the corresponding corpus (see Section A.2 in Appendix). Listed below are the summary of the comparison results:
-
1.
For BBC News, over 70% of the top words in the corpus are also top words in the three overview reports combined, over one-third of the top words in the corpus are top words in the report on 0.1-summaries, over one half of the top words in the corpus are top words in the report on 0.2-summaries as well as in the report on 0.3-summaries, and over 80% of the top 10 words in the corpus are top words in each report.
-
2.
For Factiva-Marx, 82% of the top words in the corpus are also top words in the three overview reports combined, 70% of the top words in the corpus are top words in the report on 0.1-summaries as well as in the report on 0.3-summaries, 64% of the top words in the corpus are top words in the report on 0.2-summaries, and the top 12 words in the corpus are top words in each summary. These results indicate that NDORGS is capable of capturing important information of a large corpus.
Let be a set of top words from the original corpus and a set of top words from a generated report. Let denote the information coverage score of and . Then with being the best possible score. The information coverage scores for reports over BBC News and Factiva-Marx are listed in Table 2. We can see that the report generated on 0.2-summaries achieves the highest information coverage score over BBC News, and the report generated on 0.1-summaries or 0.3-summaries achieves the highest information coverage score over Factiva-Marx.
| BBC News | 0.38 | 0.54 | 0.52 |
| Factiva-Marx | 0.70 | 0.64 | 0.70 |
Topic diversity
We generate LDA clusters for the original corpus and for the report by treating each sentence as a document in the latter case. We then evaluate the top words among these clusters using CSD F1-scores to measure topic diversity (see Table 3). We can see that, regarding topic diversity, reports generated on 0.2-summaries outperform reports generated on 0.1-summaries and 0.3-summaries for both BBC News and Factiva-Marx.
| BBC News | 0.1278 | 0.1444 | 0.1278 |
| Factiva-Marx | 0.1056 | 0.1167 | 0.1111 |
Overall performance
We evaluate the overall performance of overview reports using the following criteria (listed in the order of preference): human evaluation, time efficiency, information coverage, and topic diversity. We then use Saaty’s pairwise comparison 9-point scale and the Technique for Order Preference by Similarity to an Ideal Solution (TOPSIS) [17] to determine which length ratio of summaries produces the best overview report.
Let the three reports for the same corpus be the three alternatives, denoted by . Let the human evaluation mean score, running time, information coverage score, and topics diversity score be four criteria, denoted by . Next, we use Saaty’s pairwise comparison 9-point scale to determine weights for each criterion. A weight vector is then computed using the Analytic Hierarchy Process (AHP) procedure, where is the weight for criterion . A weighted normalization decision matrix is then generated from the normalized matrix and the weight vector . The alternatives , , and are ranked using Euclidean distance and a similarity method (see Table 4). We can see that the overview report generated on 0.2-summaries achieves the best overall performance on both BBC News and Factiva-Marx.
| rank | model | human eval. | time | coverage | diversity |
| 3 | BBC-0.1 | 3.57 | 3310 | 0.38 | 0.1278 |
| 1 | BBC-0.2 | 3.71 | 5060 | 0.54 | 0.1444 |
| 2 | BBC-0.3 | 4.03 | 5930 | 0.52 | 0.1278 |
| 2 | Marx-0.1 | 3.57 | 317023 | 0.70 | 0.1056 |
| 1 | Marx-0.2 | 4.03 | 539474 | 0.64 | 0.1167 |
| 3 | Marx-0.3 | 3.75 | 758404 | 0.70 | 0.1111 |
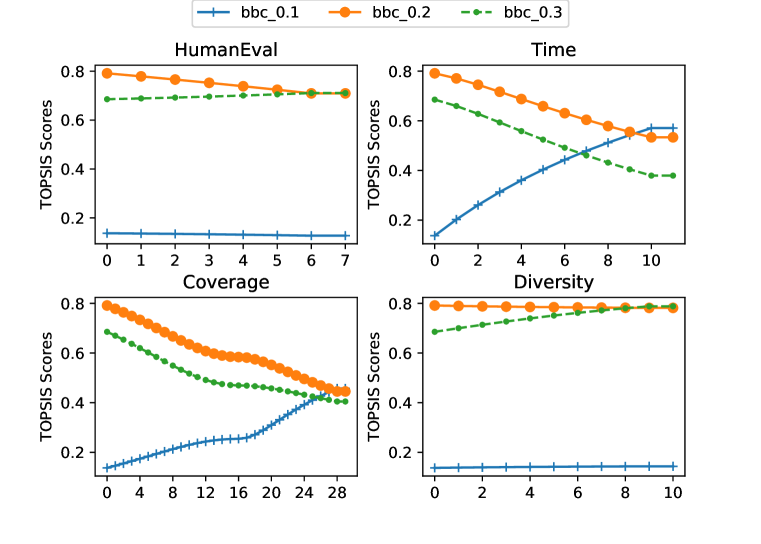
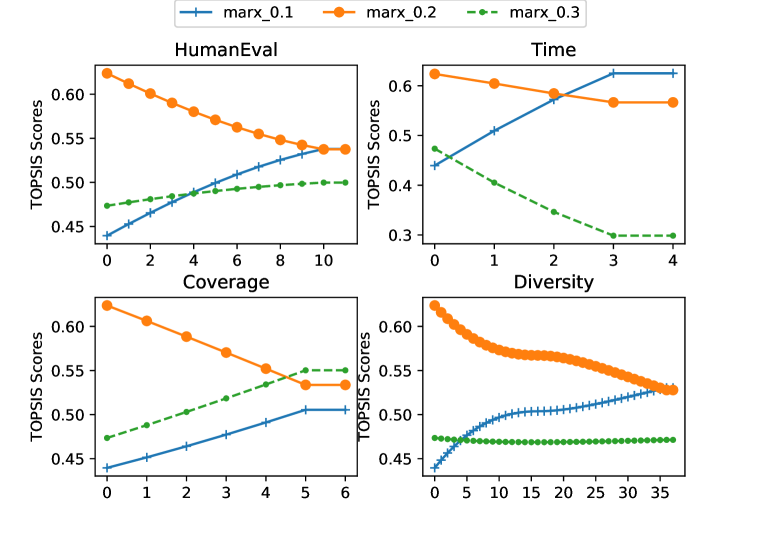
Sensitivity analysis
A stable decision made by TOPSIS is not easily changed when adjusting the weight of the criteria. To evaluate how stable the decision TOPSIS has made, we carry out sensitivity analyses to measure the sensitivity of weights. For criterion , we vary with a small increment by . We then adjust the weights for other criteria by
We recompute the ranking until another alternative is ranked number one. Fig. 9 depicts the sensitivity analyses results. In both Fig. 9a and Fig. 9b, reports generated on 0.2-summaries keep the highest rank while adjusting the weight of criteria of “Human Evaluation”, “Time”, “Coverage”, and “Diversity” . Thus, the decision made by TOPSIS is stable over both BBC News and Factiva-Marx.
5 Trending Graphs
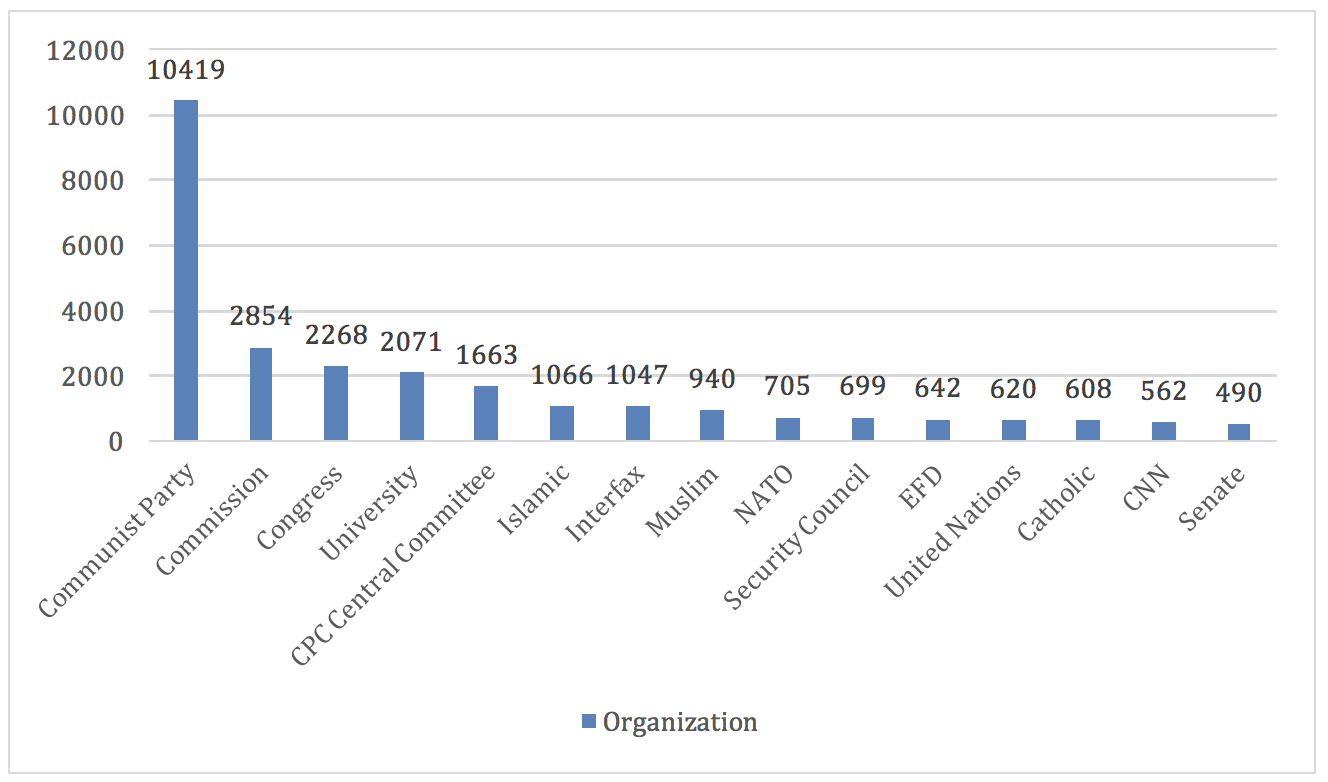
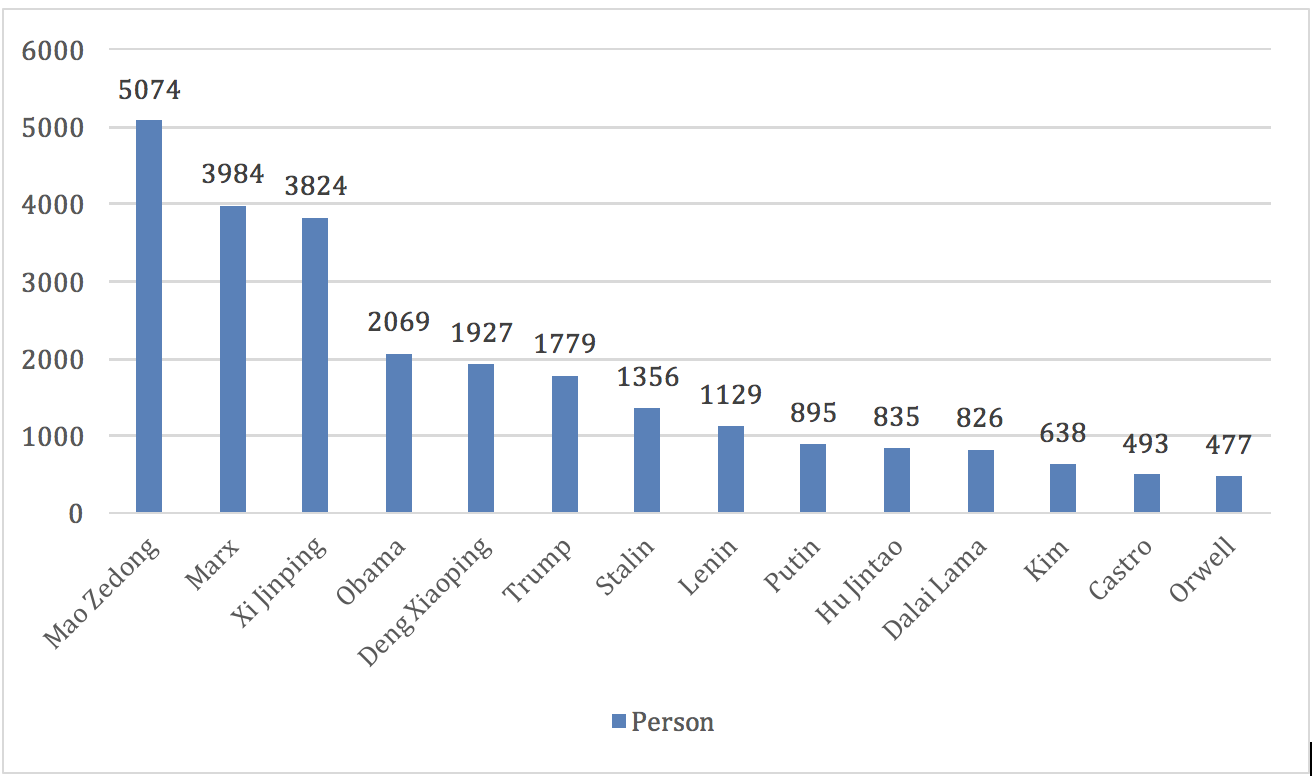
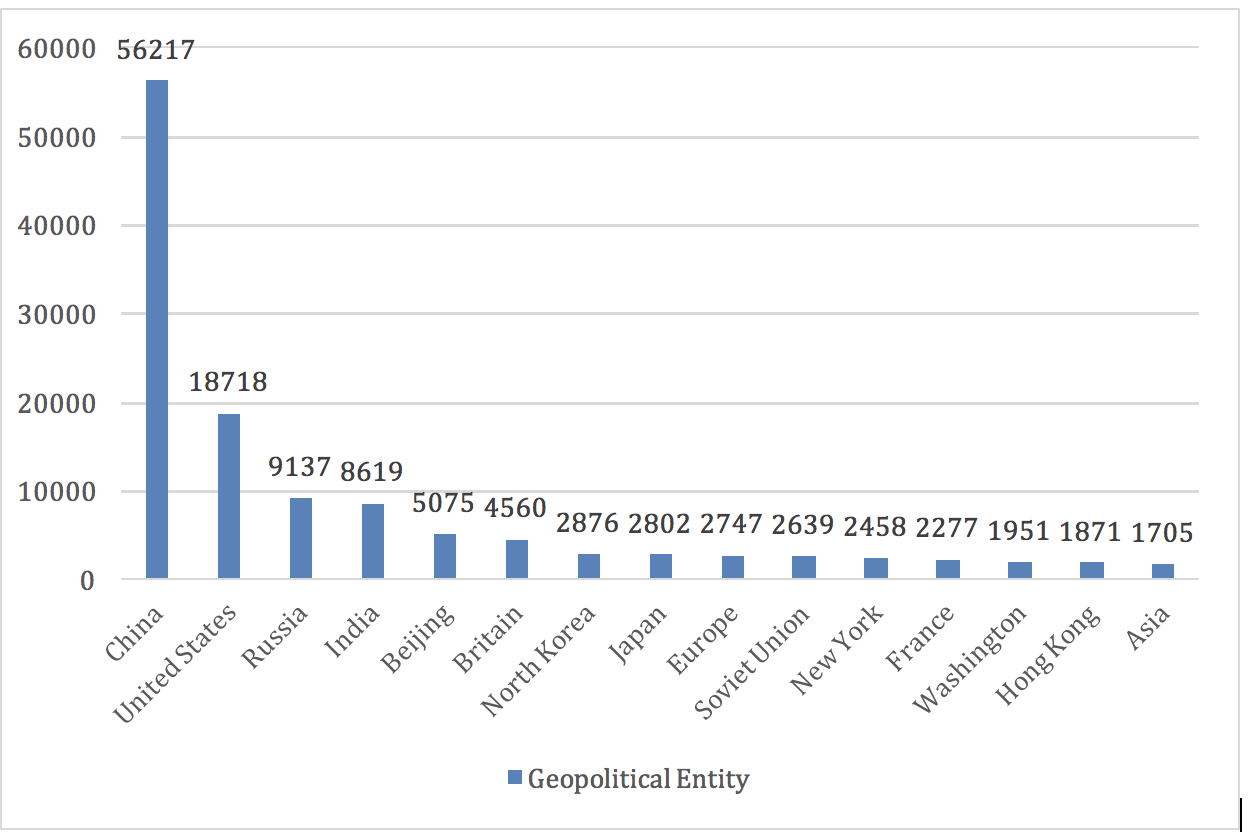
In addition to generating the text component of the overview, which is the major part, it is also much desirable to generate trending graphs to provide the reader with an easy visual on name entities of interests, including organizations, persons, and geopolitical entities. In particular, it uses a name-entity-recognition tool (such as nltk.org) to tag name entities and compute their frequencies. Figs. 10, 11, and 12 are the statistics graphs over the Factiva-Marx dataset.
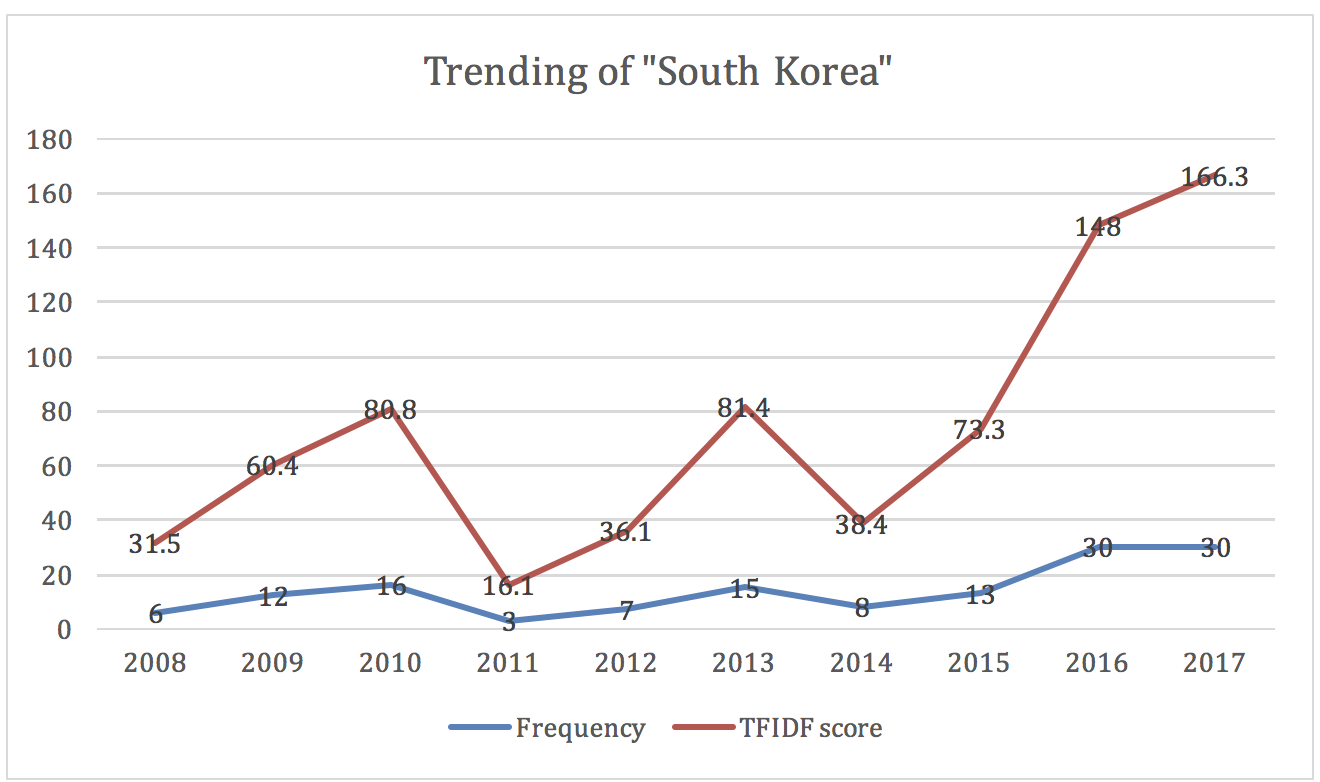
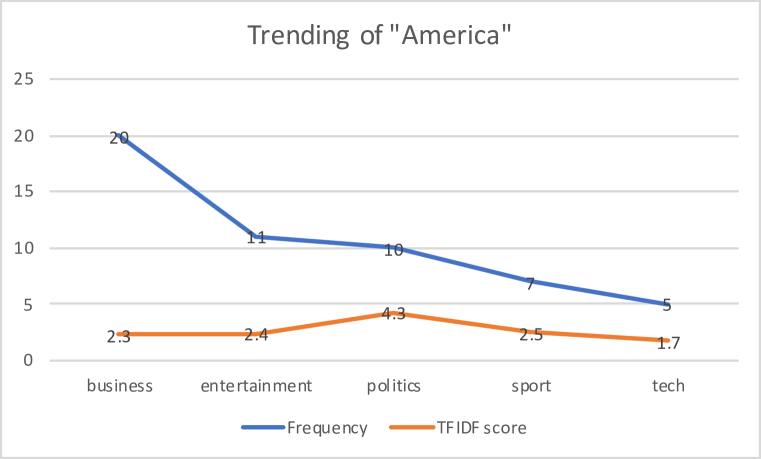
For a specific name entity of interests, we also generate a TFIDF score, in addition to its frequency. The TFIDF score of each category is the summation of the TFIDF score of each document with respect to the corpus of articles in that year, which measures its significance. Fig. 13 depicts such a trending graph for “South Korea”. It is interesting to note that, while “South Korea” was both mentioned 30 times in 2016 and 2017, its significance was much higher in 2017 than 2016. Fig. 14 is the trending graph of America over BBC News with respect to the six categories of news classifications. It is interesting to note that, while “America has one more count in Entertainment than in Politics, the importance of “America” in Politics is about twice as much as that in Entertainment.
6 Conclusion
We presented NDORGS for generating a coherent, well-structured ORPT over a large corpus of documents with acceptable efficiency and accuracy. Our experiments show that the ORPTs generated on 0.2-summaries are the best overall with respect to human evaluations, running time, information coverage, and topic diversity. Sensitivity analysis shows that this result is stable.
Acknowledgment
We thank Dr. Leif Tang and Dr. Ting Wang for making the Factiva-Marx dataset available to us. We are grateful to Dr. Peilong Li for helping some of the experiments.
References
- [1] D. Bahdanau, K. Cho, and Y. Bengio. Neural machine translation by jointly learning to align and translate. CoRR, abs/1409.0473, 2014.
- [2] D. M. Blei, A. Y. Ng, and M. I. Jordan. Latent dirichlet allocation. In Journal of Machine Learning Research, 2003.
- [3] O. Buyukkokten, H. Garcia-Molina, and A. Paepcke. Seeing the whole in parts: Text summarization for web browsing on handheld devices. In Proceedings of the 10th International Conference on World Wide Web, WWW ’01, pages 652–662. ACM, 2001.
- [4] Z. Cao, W. Li, S. Li, and F. Wei. Improving multi-document summarization via text classification. In AAAI, pages 3053–3059, 2017.
- [5] Z. Cao, W. Li, S. Li, F. Wei, and Y. Li. Attsum: Joint learning of focusing and summarization with neural attention. In Proceedings of COLING 2016, the 26th International Conference on Computational Linguistics: Technical Papers, pages 547–556, 2016.
- [6] J. Christensen, Mausam, S. Soderland, and O. Etzioni. Towards coherent multi-document summarization. In HLT-NAACL, 2013.
- [7] J. Christensen, S. Soderland, G. Bansal, et al. Hierarchical summarization: Scaling up multi-document summarization. In Proceedings of the 52nd annual meeting of the association for computational linguistics, volume 1, pages 902–912, 2014.
- [8] DUC. Duc2004 quality questions. http://duc.nist.gov/duc2004/quality.questions.txt, 2004.
- [9] DUC. Document understanding conference. https://www-nlpir.nist.gov/projects/duc/intro.html, 2014.
- [10] G. Erkan and D. R. Radev. Lexrank: Graph-based lexical centrality as salience in text summarization. Journal of Artificial Intelligence Research, 22:457–479, 2004.
- [11] Factiva-Marx. Marx dataset. http://www.ndorg.net, 2018.
- [12] W. Gao, P. Li, and K. Darwish. Joint topic modeling for event summarization across news and social media streams. In Proceedings of the 21st ACM international conference on Information and knowledge management, pages 1173–1182. ACM, 2012.
- [13] D. Gillick and B. Favre. A scalable global model for summarization. In Proceedings of the Workshop on Integer Linear Programming for Natural Langauge Processing, pages 10–18. Association for Computational Linguistics, 2009.
- [14] D. Greene and P. Cunningham. Practical solutions to the problem of diagonal dominance in kernel document clustering. In Proc. 23rd International Conference on Machine learning (ICML’06), pages 377–384. ACM Press, 2006.
- [15] J. A. Hartigan and M. A. Wong. Algorithm as 136: A k-means clustering algorithm. Journal of the Royal Statistical Society. Series C (Applied Statistics), 28(1):100–108, 1979.
- [16] K. Hong, J. M. Conroy, B. Favre, A. Kulesza, H. Lin, and A. Nenkova. A repository of state of the art and competitive baseline summaries for generic news summarization. In LREC, pages 1608–1616, 2014.
- [17] C.-L. Hwang and K. Yoon. Methods for multiple attribute decision making. In Multiple attribute decision making, pages 58–191. Springer, 1981.
- [18] D. Jones. Factiva global news database. https://www.dowjones.com/products/factiva/, 2018.
- [19] T. N. Kipf and M. Welling. Semi-supervised classification with graph convolutional networks. arXiv preprint arXiv:1609.02907, 2016.
- [20] M. Lapata. Probabilistic text structuring: Experiments with sentence ordering. In Proceedings of the 41st Annual Meeting on Association for Computational Linguistics-Volume 1, pages 545–552. Association for Computational Linguistics, 2003.
- [21] C. Li, Y. Lu, J. Wu, Y. Zhang, Z. Xia, T. Wang, D. Yu, X. Chen, P. Liu, and J. Guo. Lda meets word2vec: A novel model for academic abstract clustering. In Companion of the The Web Conference 2018 on The Web Conference 2018, pages 1699–1706. International World Wide Web Conferences Steering Committee, 2018.
- [22] C. Li, X. Qian, and Y. Liu. Using supervised bigram-based ilp for extractive summarization. In Proceedings of the 51st Annual Meeting of the Association for Computational Linguistics (Volume 1: Long Papers), volume 1, pages 1004–1013, 2013.
- [23] P. Li, J. Jiang, and Y. Wang. Generating templates of entity summaries with an entity-aspect model and pattern mining. In Proceedings of the 48th Annual Meeting of the Association for Computational Linguistics, ACL ’10, pages 640–649. Association for Computational Linguistics, 2010.
- [24] S. Li, Y. Ouyang, W. Wang, and B. Sun. Multi-document summarization using support vector regression. In Proceedings of DUC. Citeseer, 2007.
- [25] P. J. Liu, M. Saleh, E. Pot, B. Goodrich, R. Sepassi, L. Kaiser, and N. Shazeer. Generating wikipedia by summarizing long sequences. CoRR, abs/1801.10198, 2018.
- [26] A. Lulli, T. Debatty, M. Dell’Amico, P. Michiardi, and L. Ricci. Scalable k-nn based text clustering. In Big Data (Big Data), 2015 IEEE International Conference on, pages 958–963. IEEE, 2015.
- [27] R. Mihalcea and P. Tarau. Textrank: Bringing order into texts. In Proceedings of the 2004 conference on empirical methods in natural language processing, 2004.
- [28] R. Nallapati, B. Xiang, and B. Zhou. Sequence-to-sequence rnns for text summarization. CoRR, abs/1602.06023, 2016.
- [29] R. Nallapati, F. Zhai, and B. Zhou. Summarunner: A recurrent neural network based sequence model for extractive summarization of documents. In AAAI, pages 3075–3081, 2017.
- [30] M. T. Nayeem and Y. Chali. Extract with order for coherent multi-document summarization. In Proceedings of TextGraphs-11: the Workshop on Graph-based Methods for Natural Language Processing, pages 51–56. Association for Computational Linguistics, 2017.
- [31] A. Y. Ng, M. I. Jordan, and Y. Weiss. On spectral clustering: Analysis and an algorithm. In Advances in neural information processing systems, pages 849–856, 2002.
- [32] J. Otterbacher, D. Radev, and O. Kareem. News to go: hierarchical text summarization for mobile devices. In Proc. of ACM SIGIR, pages 589–596, 2006.
- [33] L. Page, S. Brin, R. Motwani, and T. Winograd. The pagerank citation ranking: Bringing order to the web. Technical report, Stanford InfoLab, 1999.
- [34] D. R. Radev, H. Jing, M. Sty, and D. Tam. Centroid-based summarization of multiple documents. Inf. Process. Manage., 40:919–938, 2004.
- [35] S. J. Rose, D. Engel, N. Cramer, and W. Cowley. Automatic keyword extraction from individual documents. In In book: Text Mining: Applications and Theory, pp.1 - 20, 2010.
- [36] A. M. Rush, S. Chopra, and J. Weston. A neural attention model for abstractive sentence summarization. CoRR, abs/1509.00685, 2015.
- [37] G. Salton and C. Buckley. Term-weighting approaches in automatic text retrieval. Inf. Process. Manage., 24:513–523, 1988.
- [38] C. Sauper and R. Barzilay. Automatically generating wikipedia articles: A structure-aware approach. In Proceedings of the Joint Conference of the 47th Annual Meeting of the ACL and the 4th International Joint Conference on Natural Language Processing of the AFNLP: Volume 1, ACL ’09, pages 208–216. Association for Computational Linguistics, 2009.
- [39] J. Shang, J. Liu, M. Jiang, X. Ren, C. R. Voss, and J. Han. Automated phrase mining from massive text corpora. IEEE Transactions on Knowledge and Data Engineering, 30(10):1825–1837, 2018.
- [40] L. Shao and J. Wang. Dtatg: An automatic title generator based on dependency trees. In Proceedings of the International Joint Conference on Knowledge Discovery, Knowledge Engineering and Knowledge Management, IC3K 2016, pages 166–173, Portugal, 2016. SCITEPRESS - Science and Technology Publications, Lda.
- [41] X. Wang, M. Nishino, T. Hirao, K. Sudoh, and M. Nagata. Exploring text links for coherent multi-document summarization. In Proceedings of COLING 2016, the 26th International Conference on Computational Linguistics: Technical Papers, pages 213–223, 2016.
- [42] J. Xu, P. Wang, G. Tian, B. Xu, J. Zhao, F. Wang, and H. Hao. Short text clustering via convolutional neural networks. In Proceedings of NAACL-HLT, pages 62––69, 2015.
- [43] C. Yao, X. Jia, S. Shou, S. Feng, F. Zhou, and H. Liu. Autopedia: Automatic domain-independent wikipedia article generation. In Proceedings of the 20th International Conference Companion on World Wide Web, WWW ’11, pages 161–162. ACM, 2011.
- [44] M. Yasunaga, R. Zhang, K. Meelu, A. Pareek, K. Srinivasan, and D. R. Radev. Graph-based neural multi-document summarization. In CoNLL, 2017.
- [45] J. Yin and J. Wang. A dirichlet multinomial mixture model-based approach for short text clustering. In Proceedings of the 20th ACM SIGKDD international conference on Knowledge discovery and data mining, pages 233–242. ACM, 2014.
- [46] D. Yogatama, F. Liu, and N. A. Smith. Extractive summarization by maximizing semantic volume. In Proceedings of the 2015 Conference on Empirical Methods in Natural Language Processing, pages 1961–1966, 2015.
- [47] H. Zhang and J. Wang. Semantic WordRank: Generating Finer Single-Document Summarizations. ArXiv e-prints, Sept. 2018.
Appendix A Appendix
A.1 Human evaluation scores
Corpus Report Human Evaluation Score BBC News 3 1 2 2 2 2 1 4 4 4 4 4 4 4 3 3 2 1 3 1 2 1 1 2 2 2 4 4 4 3 3 3 0 3 2 2 3 3 3 4 4 4 1 1 2 3 2 2 4 3 3 3 3 3 3 2 4 3 2 4 4 4 4 4 1 3 2 1 1 3 3 2 2 3 1 3 3 4 4 4 4 4 4 4 Factiva-Marx 3 3 3 1 3 2 3 4 1 4 2 4 4 4 2 2 3 2 3 1 2 3 2 2 3 1 2 3 3 2 2 3 3 4 2 2 2 2 3 3 3 4 2 4 3 3 3 3 3 4 4 4 4 4 2 4 4 3 4 4 3 3 3 3 3 3 2 3 3 2 2 2 2 2 2 2 2 3 3 3 3 3 3 2
A.2 Comparisons of top words
Top words are listed below in the corpus of BBC News and the corpus of Factiva-Marx, respectively, for comparisons, where the first item depicts the top 50 words in the original corpus, and the second, third, and fourth items depict, respectively, the top 50 words in the report generated on 0.1-summaries, 0.2-summaries, and 0.3-summaries, listed in descending order of keyword scores. The words in bold are the common top words that occur across all four rows. The words with underlines are the top words that occur in the first row and two of the other three rows. The words in italics are the top words that occur in the first row and just one of the other three rows.
Top word comparisons for BBC News
-
1.
people, told, best, government, time, year, number, three, film, music, bbc, set, game, going, years, labour, good, well, top, british, european, win, market, won, company, public, second, play, mobile, work, firm, blair, games, minister, expected, england, chief, technology, party, sales, news, plans, including, help, election, digital, players, director, economic, big
-
2.
people, best, number, government, film, year, three, game, howard, music, london, british, face, biggest, net, action, firm, deal, rise, national, foreign, singer, michael, leader, oil, blair, dollar, stock, star, cup, online, future, games, 2004, work, won, list, international, coach, win, mark, tory, labour, brown, general, prices, market, car, help, users
-
3.
year, people, number, three, best, british, film, company, won, labour, music, net, bbc, government, leader, shares, european, earlier, chart, third, games, state, win, coach, expected, second, months, political, house, economic, game, years, team, start, manchester, england, election, chief, international, michael, profit, champion, award, star, announced, service, future, firm, top, news
-
4.
people, england, year, film, labour, boss, firm, despite, number, three, wales, british, nations, best, company, music, blair, set, record, oil, time, years, won, prices, plans, net, online, including, films, bbc, court, games, game, brown, david, government, expected, club, action, beat, total, group, unit, firms, rules, mobile, second, analysts, future, computer
Top word comparisons for Factiva-Marx
-
1.
party, chinese, china, political, people, communist, economic, national, state, government, years, social, great, time, rights, development, international, president, central, war, north, university, power, united, work, country, foreign, global, military, history, south, marxism, human, western, soviet, well, system, mao, american, news, public, cultural, long, states, countries, three, left, media, british, including
-
2.
party, china, chinese, communist, political, years, economic, rights, human, president, people, national, year, state, leaders, government, central, countries, news, social, country, leader, time, foreign, power, north, nuclear, top, marxism, ideological, led, media, war, beijing, western, united, development, soviet, mao, states, history, university, capitalism, official, market, officials, march, korea, democracy, south
-
3.
china, party, communist, chinese, political, economic, years, rights, president, people, central, state, social, united, north, beijing, western, news, media, mao, cpc, war, human, anniversary, public, members, country, jinping, leader, states, government, south, marxism, democratic, national, power, year, foreign, american, education, international, july, nuclear, day, book, leadership, committee, leaders, copyright, study
-
4.
china, party, communist, chinese, economic, years, people, political, human, news, state, social, government, central, national, leader, president, media, cultural, rights, mao, power, development, year, international, university, leaders, history, united, beijing, copyright, socialist, global, great, top, nation, universities, western, revolution, nuclear, foreign, public, agency, marxism, time, members, congress, war, change, north