DC Electric Fields in Electrode-Free Glass Vapor Cell by Photoillumination
Abstract
Rydberg-atom-enabled atomic vapor cell technologies show great potentials in developing devices for quantum enhanced sensors. In this paper, we demonstrate laser induced DC electric fields in an all-glass vapor cell without bulk or thin film electrodes. The spatial field distribution is mapped by Rydberg electromagnetically induced transparency spectroscopy. We explain the measured with a boundary-value electrostatic model. This work may inspire new ideas for DC electric field control in designing miniaturized atomic vapor cell devices. Limitations and other charge effects are also discussed.
I INTRODUCTION
Recent efforts to coherently prepare and precisely manipulate physical systems at a quantum level Saffman (2019); Levine et al. (2018); Urban et al. (2009); Wade et al. (2018) have led us to the dawn of a new era for applications based on laws of quantum mechanics. These applications range from fundamental quantum-based sensorsZentile et al. (2015); Siddons et al. (2009) and transducersGard et al. (2017); Löw and Pfau (2009) to higher level quantum networks Cirac et al. (1997) suitable for quantum communications, quantum simulation and computingMonroe, Raymer, and Taylor (2019). Among all the flourishing quantum systems, Rydberg atoms are widely regarded as a valuable building block Saffman, Walker, and Mølmer (2010); C. S. Adams (2019) for these technologies because of their strong coupling to external electromagnetic fields Pritchard et al. (2010) and tunable interactions Robicheaux, Booth, and Saffman (2018); Peyrot et al. (2018).
Powered by laser cooling and coherent spectroscopy technologies Whiting et al. (2018); Sevincli et al. (2011), Rydberg atoms have demonstrated great potential in areas ranging from classical microwave Fan et al. (2015a); Sedlacek et al. (2012) and THz-wave field sensing and detection Wade et al. (2017); Downes et al. (2019); Wade et al. (2019) to the production of non-classical states of light Saffman and Walker (2002) and readout mechanisms, such as single-photon source Ripka et al. (2018); Busche et al. (2017), photonic phase gates Tiarks et al. (2019), etc.
Among different working platforms, ranging from ultra cold and ultra high vacuum systems to room-temperature chip scale devices, vapor-cell-based technologies Liew et al. (2004); Daschner et al. (2012); Simons, Gordon, and Holloway (2018); Peyrot et al. (2019) have gained significant attention over the past few decades Phillips et al. (2001). In these types of devices, Rydberg atoms are directly prepared from an ensemble of ground state atoms at moderate vapor pressures inside dielectric environments (borocilicate glasses or quartz) near room-temperature. These Rydberg atoms can be excited and proved either by cw multi-level electromagnetically-induced-transparency (EIT)Mohapatra, Jackson, and Adams (2007); Kumar et al. (2017)or through pulsed nonlinear spectroscopy schemes such as four-wave-mixing Whiting et al. (2017); Ripka et al. (2016).
These devices demonstrate amazing isolation to environmental DC electric fields outside the cellMohapatra, Jackson, and Adams (2007); Holloway et al. (2014). These fields are generally not known but could be very large due to random electrostatic build up. The DC field isolation is an essential prerequisite for radio frequency (RF) and microwave sensing Holloway et al. (2017); Simons et al. (2018). On the other hand, for applications such as Stark tuning of Rydberg transitions, the manipulation and control of electric fields inside the cell is necessary. By introducing metallic bulk electrodes Grimmel et al. (2015)or thin-film ITO electrodes Barredo et al. (2013) to apply fields, researchers have shown enhanced capabilities of such devices.
In this work, we peform an experiment in which DC electric fields are produced within the dielectric enclosure without using bulk or ITO electrodes. The method presented here may enhance the functionality of the devices while still utilizing the simple structure of electrode-free dielectric vapor cells. In addition, for applications such as RF and microwave sensing where stray DC electric fields will limit the sensitivity of the device Holloway et al. (2015); Fan et al. (2015b), a detailed understanding and characterization of the DC fields inside glass-only vapor cells is necessary, especially when miniaturized devices are required. In such devices, Rydberg atoms start to interact with the device enclosures Ritter et al. (2018); Whittaker et al. (2015) either though quasi-static or retarded image charge interactions or by resonant Rydberg-surface plasmon coupling Kübler et al. (2010).
Inside Rydberg-atom-enabled vapor-cell devices, extra charges are ubiquitous Weller et al. (2019, 2016); Abel et al. (2011). Volume or surface charges can exist inside or on the inner surfaces of the enclosure. These charges may originate directly from Rydberg atoms through blackbody or laser induced photoionization and collision processes (Penning ionization) Gallagher (1994), and can produce volume and surface charge densities through ambipolar diffusion. Due to atomic aggregate layers on the dielectric surface, free charges can also be induced by nonuniform heating (akin to a Seebeck effect) Lee et al. (2014) and laser illumination (photoelectric effect) Juray (1962), leading to surface charge layers. Active control of these charging mechanisms can be used to control of the electric fields inside vapor-cell devices, and improve the Rydberg atom response in specified applications. In this paper, we show experimental evidence that both Penning ionization and Seebeck-like effects can be suppressed and, at the same time, a photoelectric effect can be used to produce a controllable DC electric field. We also show good agreement between the measured electric field distributions and solutions of electrostatic boundary-value problems (where the geometrical effects of the enclosure boundaries are included).
II EXPERIMENTAL SETUP
In order to investigate the electric field distributions inside an all-glass (borosilicate in our setup) vapor cell, DC-Stark shifts are measured through EIT resonances of a Rydberg state. The Stark shifts are mapped out as a function of position along the direction by translating the EIT channel across the vapor cell, as illustrated in Fig. 1.

An -long and -I.D. cylindrical glass vapor cell filled with a natural mixture of vapor (part number VTC-11/9-10/8 from Rydberg Technologies Inc.), is placed inside a magnetic-field-shielding package. There are two by apertures in both end-caps of the enclosure, which allow us to illuminate the cell walls with a - laser beam and to introduce the EIT beams. The vapor cell package is fixed to the optical table with a post that goes through a cutout in an optical breadboard on which the EIT beam optics are mounted. A translation stage connecting the breadboard and optical table is used to translate the EIT probe region within the vapor cell relative to the cell walls.
Both the probe and coupler beams of the EIT channel are launched from single mode polarization maintaining fibers on the breadboard. The beam sizes are chosen such that we achieve the best spatial resolution under the condition that the Rayleigh length matches the vapor cell length. Measured beam sizes are plotted in the insert of Fig. 1.
The - photoelectric illumination beam is sent into the cell via a periscope mounted on the optical table, which allows us to adjust position of the beam relative the vapor cell. The beam size can also be adjusted via apertures (not shown in Fig. 1) placed before the periscope.
This setup provides an adjustable illumination configuration of the vapor cell. Further the EIT channel position can be translated relative to the cell along the direction, while maintaining a good overlap between the EIT probe and coupler beam. However, due to some warping of the vapor cell windows, slight position mismatch between probe and coupler beams is expected. This mismatch is largest when the EIT channel is brought close to the vapor cell windows edges, where the warping occurs. This limits the EIT probing range shown in Fig. 2 along direction to about , which is about of the inner diameter of the cell.
III DC Electric Fields Creation and Mapping in all glass vapor cell
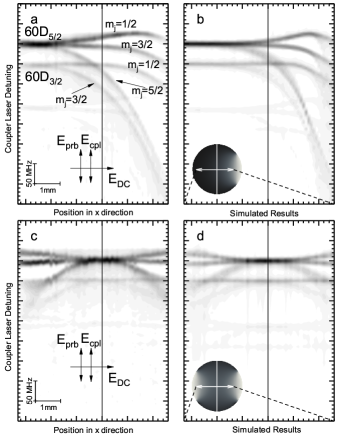
In order to achieve a high EIT signal to noise ratio the magnetic-field-shielding package is uniformly heated to ℃. The cell walls are then illuminated by the - laser beams to create photoelectric charges inside the cell. The EIT resonances of the states of are then mapped out as function of position of the EIT probe along direction. The Rydberg EIT resonances clearly demonstrate position-dependent DC Stark shifts. Two such DC Stark maps are shown in Fig. 2 (a) and 2 (c), corresponding to two different photoelectric illumination conditions. Somewhat surprisingly, the Stark-split lines remain quite narrow up to considerable electric field strength, indicating a simple electric field structure that is homogeneous along the direction.
In Fig. 2 (a), the beam is shifted to the side of the entrance aperture, so that it illuminates only one side of the cylindrical cell wall, and the illumination of the flat cell windows is negligible. In Fig. 2 (c), the beam is centered on the aperture and the beam size is expanded to by before being launched from the periscope. In this case, both sides of the cylindrical cell wall are uniformly illuminated, as well as parts of the cell windows. In both cases, the top and bottom parts of the cell are not illuminated because of the 5-mm height of the optical-access slit in the cell enclosure.
In order to quantitatively understand the experimental data, we numerically simulate the density matrix by solving Master Equations based on measured optical and geometrical parameters, similar to the procedure described in Ref.Ma, Anderson, and Raithel (2017). This model includes the position-dependent Rabi frequencies in the gaussian EIT beams (see inset of Fig. 1) and position-dependent Stark shifts of the atomic energy levels due to the non-uniform volume-distribution of the electric fields inside the cell. The absorption coefficient of the probe laser is calculated by using the position-averaged density matrix over all three dimensions. The simulated EIT probe beam absorption signals, shown in Fig. 2 (b) and Fig. 2 (d) for both illumination scenarios, are then obtained from Beer’s absorption law. The only unknown parameter in this model is the electric field distribution.
IV DC Electric Field Model
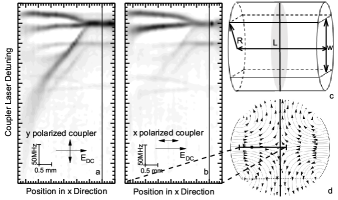
The electric potential inside the cell is determined by solving the Laplace equation numerically with Dirichlet boundary conditions on the inner surfaces of the cell walls. These boundary conditions simulate the steady state of the photoelectric processes inside the vapor cell. We assign a fixed nonzero potential to the area that is illuminated by the -nm laser, whereas the dark regions of the cell walls are set to zero potential. We also assume that there are no free space charges inside the cell. A detailed discussion follows in Sec. V. A sketch of the model for the simulations in Fig. 2 (d) is depicted in Fig. 2 (c) (). It should be noted that is the only free parameter in this model that we use to fit the experimental data.
A second way of obtaining the potential is to perform a series expansion of the potential in a volume-charge-free cylindrical volume with end-caps Jackson (1998). The result for single sided illumination, used in Fig. 2 (b), is shown in Eq. 1; the best fit value for the surface potential is in this case. We use numerical solutions of the Laplace equation and series expansions interchangeably; the results of both methods have been cross-checked for consistency.
| (1) |
We find that the electric fields are relatively uniform in magnitude and direction within the EIT probe region, for both scenarios shown in Fig. 2 (a) and Fig. 2 (c). The electric-field lines on the shaded cross section in Fig. 3 (c) are plotted in Fig. 3 (d) for the case of double-sided illumination scenario. The electric field exhibits the expected quadrupole characteristics in most parts of the cell, and within the EIT probe region, the field is fairly uniform.
The direction of the DC electric field is verified by changing the polarization direction of the coupler beam from perpendicular (as shown in Fig. 3 (a)) to parallel ( Fig. 3 (b)) relative to the DC electric field. In the case of vertically polarized coupler beam, the atoms see an effective superposition of left- and right- circular polarized light relative to the quantization axis (direction of DC electric fields).This allows a much stronger component in the EIT spectrum (Fig. 3 (a)) compare to the case in Fig. 3 (b).
V Discussion section
Using only one unknown parameter , the model developed in Sec. IV describes the electric-field distributions inside the cell relatively well. The electric potential generated by the photoelectric processes on the surfaces of a material is generally related to the energy difference between the incident photon energy (in this work, - photon has a energy of ) and the work function of the surface. In our work, surface potentials in the range of a few hundred millivolts fit the experiment results best. Due to the complex composition of the glass materials and thin atomic layers (aggregates) deposited on the inner surface of the glass cell, precise determination of the work function and charge affinity of such surfaces is nontrivial (see reference Sedlacek et al. (2016) and citations therein) and lies outside the scope of this work. Nevertheless, several other (surface / free-space) charge generation mechanisms can also play a role in vapor cell Rydberg-EIT experiments, such as Penning ionization of Rydberg states, Seebeck effects , etc.
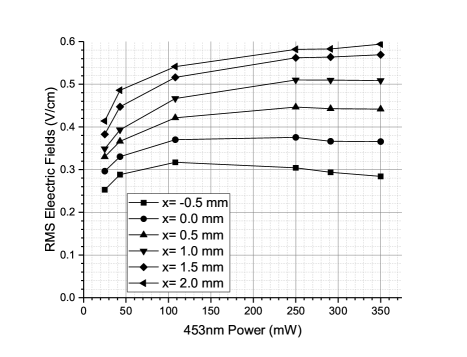
In Fig. 4, the rms electric field strengths along the EIT probe propagation direction is measured as a function of incident power of the - beam. Fig. 4 shows that for a wide range (more than one order of magnitude change) of power investigated, the rms electric fields vary only moderately, suggesting that the photoelectric charging effect is almost saturated even at lowest power used.
The other well known charge generation mechanism is Penning ionization and blackbody ionization of Rydberg atoms. This process can be adjusted by varying the power of the EIT beams. We do not observe significant changes in the DC electric field strength in the cell. (The power of both probe and coupler beams are nevertheless kept as low as possible in this work in order to achieve low power broadening and hence better spectral resolution.) These observations motivate us not to include spatial charges in our model. The results also suggest that the photoelectric effect on the cell walls is the only major source of the charges in the present work.
We observe a decrease in electric field strength when a second - beam is introduced into the system and overlapped with the - beam (see supplementary materials). The second - beam is tuned into resonant with isotope hence does not interfere with our EIT probe beam. We believe additional charges are injected into environment caused by the direct photoionization of Rydberg states using the energy provided by the - and - photons. The details of the mechanism are not the focus of this work and are subject to future investigation.
It should be noted that the electric fields predicted by our model decay, as a function of position in direction, somewhat faster than fields measured in the experiment near the zero fields region for all photoelectric illumination conditions tested. This behavior is also observed for different cell temperatures. This faster decay is not a result of underestimating parameter and cannot be explained by taking an average of EIT beam direction along the cell length.
We relate these observed differences to three possible causes. The first one relates to the accuracy of geometric dimensions of the vapor cells. For example, the inner surface geometry of the small nipple is not included in the model. The second relates to the underestimation of the illuminated surface area on the cell wall. In the model, this area is restricted by the aperture size of the magnetic field shielding package. Due the diffraction of - beam on the edges of the aperture, the real illuminated area on the cell wall can be larger. The third reason may relate to the non-negligible free spacial charge shielding generated by the EIT probe beam itself when it is probing the near zero fields created by the surface charges on the wall.
VI CONCLUSION
In this work, we have investigated the DC electric fields generated by the photoelectric process on the inner surfaces of the glass vapor cell by introducing a - beam. The field distributions are mapped out using Rydberg-EIT spectroscopy. Although detailed characterization of the photoelectric effects on the cell inner surface is non-trivial, we have developed a simple phenomenological model that has reproduced the measured electric fields quite well.
The ability to understand and manipulate the local electromagnetic fields is critical for developing miniaturized vapor cell based devices. The characterization of spurious photoelectric effects on the cell walls is important to avoid stray electric fields inside the cell. On the other hand, the effect described in this paper can also be used to Stark-tune Rydberg transitions in vapor cells without the use of electrodes inside the cell. This functionality would allow to frequency-tune Rydberg-atom-based detectors and receivers using a laser for electric-field and Stark shift control.
Acknowledgments This work is supported by NSF Grant PHY-1707377. We also thanks Dr. David Anderson for valuable discussions.
References
- Saffman (2019) M. Saffman, “The next step in making arrays of single atoms,” Nature 567, 468–470 (2019).
- Levine et al. (2018) H. Levine, A. Keesling, A. Omran, H. Bernien, S. Schwartz, A. S. Zibrov, M. Endres, M. Greiner, V. Vuletić, and M. D. Lukin, “High-fidelity control and entanglement of rydberg-atom qubits,” Physical Review Letters 121 (2018), 10.1103/PhysRevLett.121.123603.
- Urban et al. (2009) E. Urban, T. A. Johnson, T. Henage, L. Isenhower, D. D. Yavuz, T. G. Walker, and M. Saffman, “Observation of rydberg blockade between two atoms,” Nature Physics 5, 110–114 (2009).
- Wade et al. (2018) C. G. Wade, M. Marcuzzi, E. Levi, J. M. Kondo, I. Lesanovsky, C. S. Adams, and K. J. Weatherill, “A terahertz-driven non-equilibrium phase transition in a room temperature atomic vapour,” Nature Communications 9, 3567 (7 pp.) (2018).
- Zentile et al. (2015) M. A. Zentile, D. J. Whiting, J. Keaveney, C. S. Adams, and I. G. Hughes, “Atomic faraday filter with equivalent noise bandwidth less than 1 ghz,” Optics Letters 40, 2000–2003 (2015).
- Siddons et al. (2009) P. Siddons, N. C. Bell, Y. Cai, C. S. Adams, and I. G. Hughes, “A gigahertz-bandwidth atomic probe based on the slow-light faraday effect,” Nature Photonics, Nature Photonics 3, 225–229 (2009).
- Gard et al. (2017) B. T. Gard, K. Jacobs, R. McDermott, and M. Saffman, “Microwave-to-optical frequency conversion using a cesium atom coupled to a superconducting resonator,” Physical Review A 96 (2017), 10.1103/PhysRevA.96.013833.
- Löw and Pfau (2009) R. Löw and T. Pfau, “Magneto-optics: Hot atoms rotate light rapidly,” Nature Photonics 3, 197–199 (2009).
- Cirac et al. (1997) J. I. Cirac, P. Zoller, H. J. Kimble, and H. Mabuchi, “Quantum state transfer and entanglement distribution among distant nodes in a quantum network,” Physical Review Letters 78, 3221–3224 (1997).
- Monroe, Raymer, and Taylor (2019) C. Monroe, M. G. Raymer, and J. Taylor, “The u.s. national quantum initiative: From act to action,” Science, 364, 440–442 (2019).
- Saffman, Walker, and Mølmer (2010) M. Saffman, T. G. Walker, and K. Mølmer, “Quantum information with rydberg atoms,” Reviews of Modern Physics 82, 2313–2363 (2010).
- C. S. Adams (2019) J. P. S. C. S. Adams, J. D. Pritchard, “Rydberg atoms quantum technologies,” arXiv:1907.09231 [physics.atom-ph] (2019).
- Pritchard et al. (2010) J. D. Pritchard, D. Maxwell, A. Gauguet, K. J. Weatherill, M. P. Jones, and C. S. Adams, “Cooperative atom-light interaction in a blockaded rydberg ensemble,” Physical Review Letters 105, 193603 (4 pp.) (2010).
- Robicheaux, Booth, and Saffman (2018) F. Robicheaux, D. W. Booth, and M. Saffman, “Theory of long-range interactions for rydberg states attached to hyperfine-split cores,” Physical Review A 97 (2018), 10.1103/PhysRevA.97.022508.
- Peyrot et al. (2018) T. Peyrot, Y. R. P. Sortais, A. Browaeys, A. Sargsyan, D. Sarkisyan, J. Keaveney, I. G. Hughes, and C. S. Adams, “Collective lamb shift of a nanoscale atomic vapor layer within a sapphire cavity,” Physical Review Letters 120 (2018), 10.1103/PhysRevLett.120.243401.
- Whiting et al. (2018) D. J. Whiting, R. S. Mathew, J. Keaveney, C. S. Adams, and I. G. Hughes, “Four-wave mixing in a non-degenerate four-level diamond configuration in the hyperfine paschenback regime,” Journal of Modern Optics 65, 713–722 (2018).
- Sevincli et al. (2011) S. Sevincli, C. Ates, T. Pohl, H. Schempp, C. S. Hofmann, G. Gunter, T. Amthor, M. Weidemuller, J. D. Pritchard, D. Maxwell, A. Gauguet, K. J. Weatherill, M. P. A. Jones, and C. S. Adams, “Quantum interference in interacting three-level rydberg gases: Coherent population trapping and electromagnetically induced transparency,” Journal of Physics B: Atomic, Molecular and Optical Physics 44 (2011), 10.1088/0953-4075/44/18/184018.
- Fan et al. (2015a) H. Fan, S. Kumar, J. Sedlacek, H. Kübler, S. Karimkashi, and J. P. Shaffer, “Atom based rf electric field sensing,” Journal of Physics B: Atomic, Molecular and Optical Physics 48 (2015a), 10.1088/0953-4075/48/20/202001.
- Sedlacek et al. (2012) J. A. Sedlacek, A. Schwettmann, H. Kübler, R. Löw, T. Pfau, and J. P. Shaffer, “Microwave electrometry with rydberg atoms in a vapour cell using bright atomic resonances,” Nature Physics 8, 819–824 (2012).
- Wade et al. (2017) C. G. Wade, N. ibali, N. R. De Melo, J. M. Kondo, C. S. Adams, and K. J. Weatherill, “Real-time near-field terahertz imaging with atomic optical fluorescence,” Nature Photonics 11, 40–43 (2017).
- Downes et al. (2019) L. A. Downes, A. R. MacKellar, D. J. Whiting, C. Bourgenot, C. S. Adams, and K. J. Weatherill, “Ultra-high-speed terahertz imaging using atomic vapour,” arXiv:1903.01308 [physics.atom-ph] (2019).
- Wade et al. (2019) C. G. Wade, M. Marcuzzi, E. Levi, J. M. Kondo, I. Lesanovsky, C. S. Adams, and K. J. Weatherill, “Terahertz-driven phase transition applied as a room-temperature terahertz detector,” arXiv:1709.00262 [physics.atom-ph] (2019).
- Saffman and Walker (2002) M. Saffman and T. G. Walker, “Creating single-atom and single-photon sources from entangled atomic ensembles,” Physical Review A - Atomic, Molecular, and Optical Physics 66, 4 (2002).
- Ripka et al. (2018) F. Ripka, H. Kübler, R. Löw, and T. Pfau, “A room-temperature single-photon source based on strongly interacting rydberg atoms,” Science 362, 446–449 (2018).
- Busche et al. (2017) H. Busche, P. Huillery, S. W. Ball, T. Ilieva, M. P. A. Jones, and C. S. Adams, “Contactless nonlinear optics mediated by long-range rydberg interactions,” Nature Physics 13, 655–8 (2017).
- Tiarks et al. (2019) D. Tiarks, S. Schmidt-Eberle, T. Stolz, G. Rempe, and S. Dürr, “A photon–photon quantum gate based on rydberg interactions,” Nature Physics 15, 124–126 (2019).
- Liew et al. (2004) L. A. Liew, S. Knappe, J. Moreland, H. Robinson, L. Hollberg, and J. Kitching, “Microfabricated alkali atom vapor cells,” Applied Physics Letters 84, 2694–2696 (2004).
- Daschner et al. (2012) R. Daschner, R. Ritter, H. Kübler, N. Frühauf, E. Kurz, R. Löw, and T. Pfau, “Fabrication and characterization of an electrically contacted vapor cell,” Optics Letters, Optics Letters 37, 2271–2273 (2012).
- Simons, Gordon, and Holloway (2018) M. T. Simons, J. A. Gordon, and C. L. Holloway, “Fiber-coupled vapor cell for a portable rydberg atom-based radio frequency electric field sensor,” Applied Optics 57, 6456–6460 (2018).
- Peyrot et al. (2019) T. Peyrot, C. H. Beurthe, S. Coumar, M. Roulliay, K. Perronet, P. Bonnay, C. S. Adams, A. Browaeys, and Y. R. P. Sortais, “Fabrication and characterization of super-polished wedged borosilicate nano-cells,” Optics Letters 44, 1940–1943 (2019).
- Phillips et al. (2001) D. F. Phillips, A. Fleischhauer, A. Mair, R. L. Walsworth, and M. D. Lukin, “Storage of light in atomic vapor,” Physical Review Letters 86, 783–786 (2001).
- Mohapatra, Jackson, and Adams (2007) A. K. Mohapatra, T. R. Jackson, and C. S. Adams, “Coherent optical detection of highly excited rydberg states using electromagnetically induced transparency,” Physical Review Letters 98 (2007), 10.1103/PhysRevLett.98.113003.
- Kumar et al. (2017) S. Kumar, H. Fan, H. Kübler, A. J. Jahangiri, and J. P. Shaffer, “Rydberg-atom based radio-frequency electrometry using frequency modulation spectroscopy in room temperature vapor cells,” Optics Express 25, 8625–8637 (2017).
- Whiting et al. (2017) D. J. Whiting, N. Sibalic, J. Keaveney, C. S. Adams, and I. G. Hughes, “Single-photon interference due to motion in an atomic collective excitation,” Physical Review Letters 118, 253601 (6 pp.) (2017).
- Ripka et al. (2016) F. Ripka, Y.-H. Chen, R. Löw, and T. Pfau, “Rydberg polaritons in a thermal vapor,” Physical Review A 93, 053429– (2016).
- Holloway et al. (2014) C. L. Holloway, J. A. Gordon, S. Jefferts, A. Schwarzkopf, D. A. Anderson, S. A. Miller, N. Thaicharoen, and G. Raithel, “Broadband rydberg atom-based electric-field probe for si-traceable, self-calibrated measurements,” IEEE Transactions on Antennas and Propagation 62, 6169–6182 (2014).
- Holloway et al. (2017) C. L. Holloway, M. T. Simons, J. A. Gordon, A. Dienstfrey, D. A. Anderson, and G. Raithel, “Electric field metrology for si traceability: Systematic measurement uncertainties in electromagnetically induced transparency in atomic vapor,” Journal of Applied Physics 121 (2017), 10.1063/1.4984201.
- Simons et al. (2018) M. T. Simons, M. D. Kautz, C. L. Holloway, D. A. Anderson, G. Raithel, D. Stack, M. C. St John, and W. Su, “Electromagnetically induced transparency (eit) and autler-townes (at) splitting in the presence of band-limited white gaussian noise,” Journal of Applied Physics 123 (2018), 10.1063/1.5020173.
- Grimmel et al. (2015) J. Grimmel, M. Mack, F. Karlewski, F. Jessen, M. Reinschmidt, N. Sándor, and J. Fortágh, “Measurement and numerical calculation of rubidium rydberg stark spectra,” New Journal of Physics 17, 053005 (2015).
- Barredo et al. (2013) D. Barredo, H. Kübler, R. Daschner, R. Löw, and T. Pfau, “Electrical readout for coherent phenomena involving rydberg atoms in thermal vapor cells,” Phys. Rev. Lett. 110, 123002 (2013).
- Holloway et al. (2015) C. L. Holloway, J. A. Gordon, M. T. Simons, H. Fan, S. Kumar, J. P. Shaffer, D. A. Anderson, A. Schwarzkopf, S. A. Miller, N. Thaicharoen, and G. Raithel, “Atom-based rf electric field measurements: An initial investigation of the measurement uncertainties,” (Institute of Electrical and Electronics Engineers Inc., National Institute of Standards and Technology (NIST), Electromagnetics Division, 325 Broadway, Boulder, CO 80305, United States, 2015) pp. 467–472.
- Fan et al. (2015b) H. Fan, S. Kumar, J. Sheng, J. P. Shaffer, C. L. Holloway, and J. A. Gordon, “Effect of vapor-cell geometry on rydberg-atom-based measurements of radio-frequency electric fields,” Physical Review Applied 4 (2015b), 10.1103/PhysRevApplied.4.044015.
- Ritter et al. (2018) R. Ritter, N. Gruhler, H. Dobbertin, H. Kübler, S. Scheel, W. Pernice, T. Pfau, and R. Löw, “Coupling thermal atomic vapor to slot waveguides,” Physical Review X 8, 021032– (2018).
- Whittaker et al. (2015) K. A. Whittaker, J. Keaveney, I. G. Hughes, A. Sargsyan, D. Sarkisyan, and C. S. Adams, “Spectroscopic detection of atom-surface interactions in an atomic-vapor layer with nanoscale thickness,” Physical Review A 92 (2015), 10.1103/PhysRevA.92.052706.
- Kübler et al. (2010) H. Kübler, J. P. Shaffer, T. Baluktsian, R. Löw, and T. Pfau, “Coherent excitation of rydberg atoms in micrometre-sized atomic vapour cells,” Nature Photonics 4, 112–116 (2010).
- Weller et al. (2019) D. Weller, J. P. Shaffer, T. Pfau, R. Löw, and H. Kübler, “Interplay between thermal rydberg gases and plasmas,” Physical Review A 99 (2019), 10.1103/PhysRevA.99.043418.
- Weller et al. (2016) D. Weller, A. Urvoy, A. Rico, R. Löw, and H. Kübler, “Charge-induced optical bistability in thermal rydberg vapor,” Physical Review A 94 (2016), 10.1103/PhysRevA.94.063820.
- Abel et al. (2011) R. P. Abel, C. Carr, U. Krohn, and C. S. Adams, “Electrometry near a dielectric surface using rydberg electromagnetically induced transparency,” Physical Review A - Atomic, Molecular, and Optical Physics 84 (2011), 10.1103/PhysRevA.84.023408.
- Gallagher (1994) T. F. Gallagher, Cambridge Monographs on Atomic, Molecular and Chemical Physics (Cambridge University Press, Cambridge, 1994).
- Lee et al. (2014) E.-S. Lee, S. Cho, H.-K. Lyeo, and Y.-H. Kim, “Seebeck effect at the atomic scale,” Phys. Rev. Lett. 112, 136601 (2014).
- Juray (1962) J. J. Juray, “Photoelectric effect induced by high-intensity laser light beam from quartz and borosilicate glass,” (1962).
- Ma, Anderson, and Raithel (2017) L. Ma, D. A. Anderson, and G. Raithel, “Paschen-back effects and rydberg-state diamagnetism in vapor-cell electromagnetically induced transparency,” Physical Review A 95, 061804– (2017).
- Jackson (1998) J. D. Jackson, Classical Electrodynamics, 3rd ed. (Wiley, 1998).
- Sedlacek et al. (2016) J. A. Sedlacek, E. Kim, S. T. Rittenhouse, P. F. Weck, H. R. Sadeghpour, and J. P. Shaffer, “Electric field cancellation on quartz by rb adsorbate-induced negative electron affinity,” Physical Review Letters 116 (2016), 10.1103/PhysRevLett.116.133201.