X-ToM: Gaining Justified Trust by Explaining with Theory-of-Mind
Appendix A Appendix
A.1 X-ToM Evaluator Interface and Questions
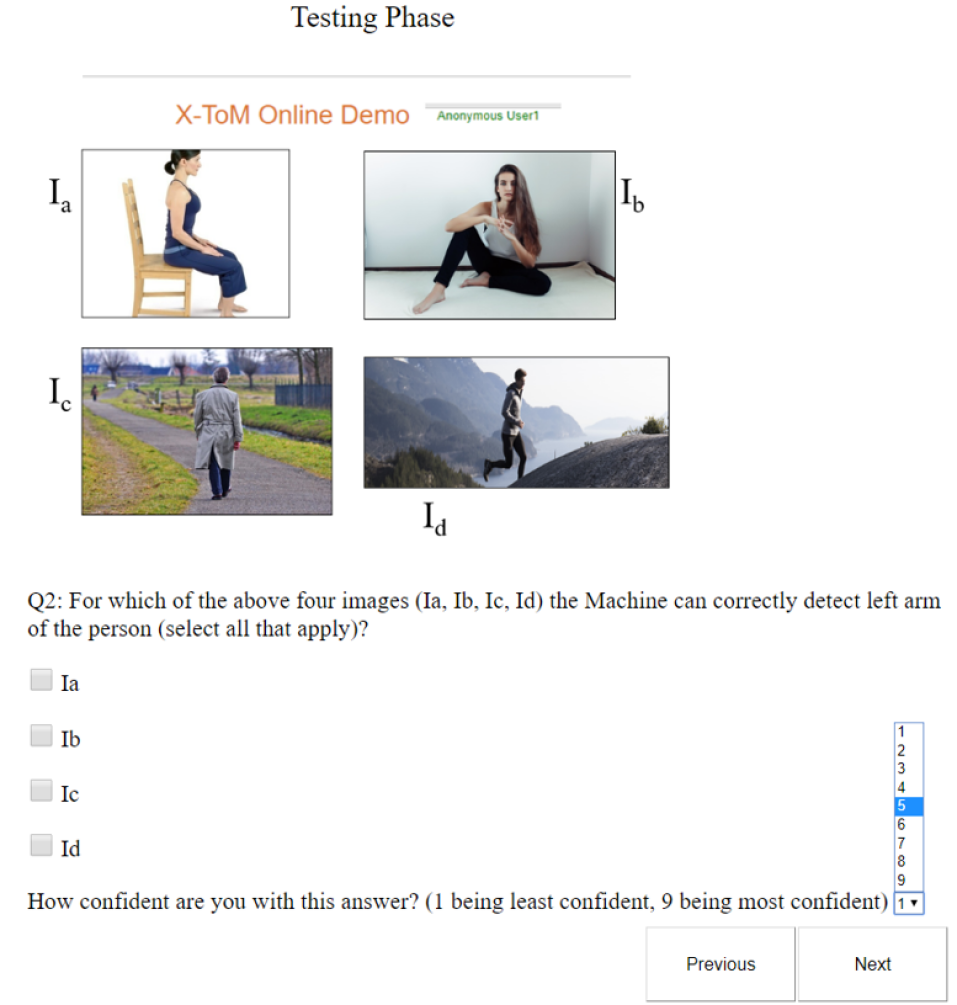
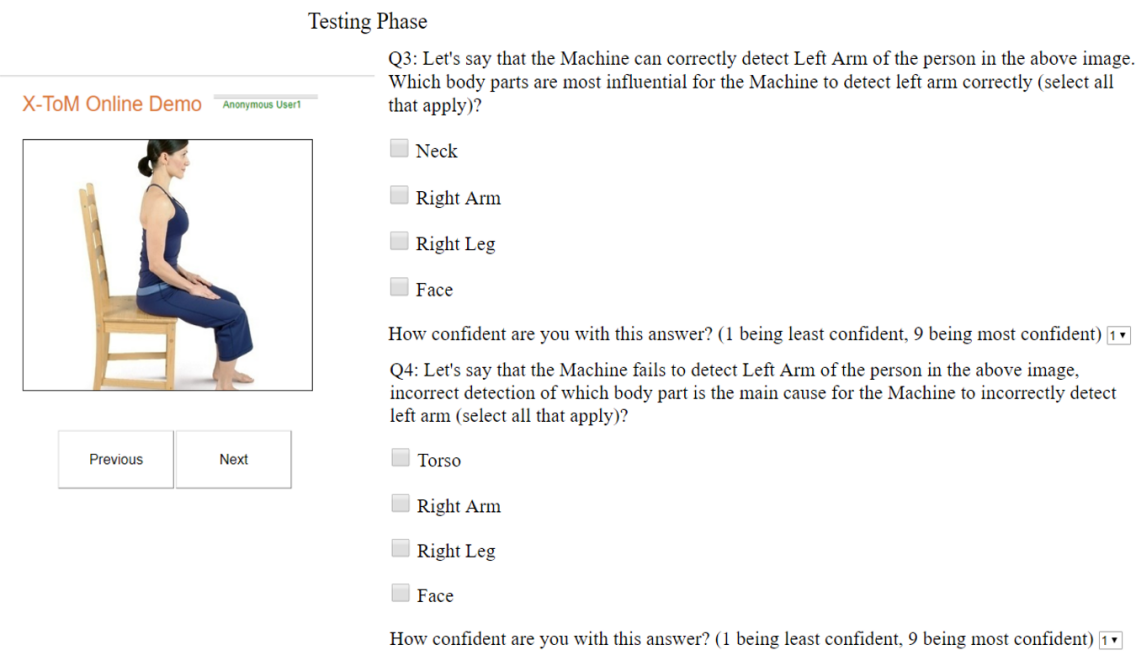
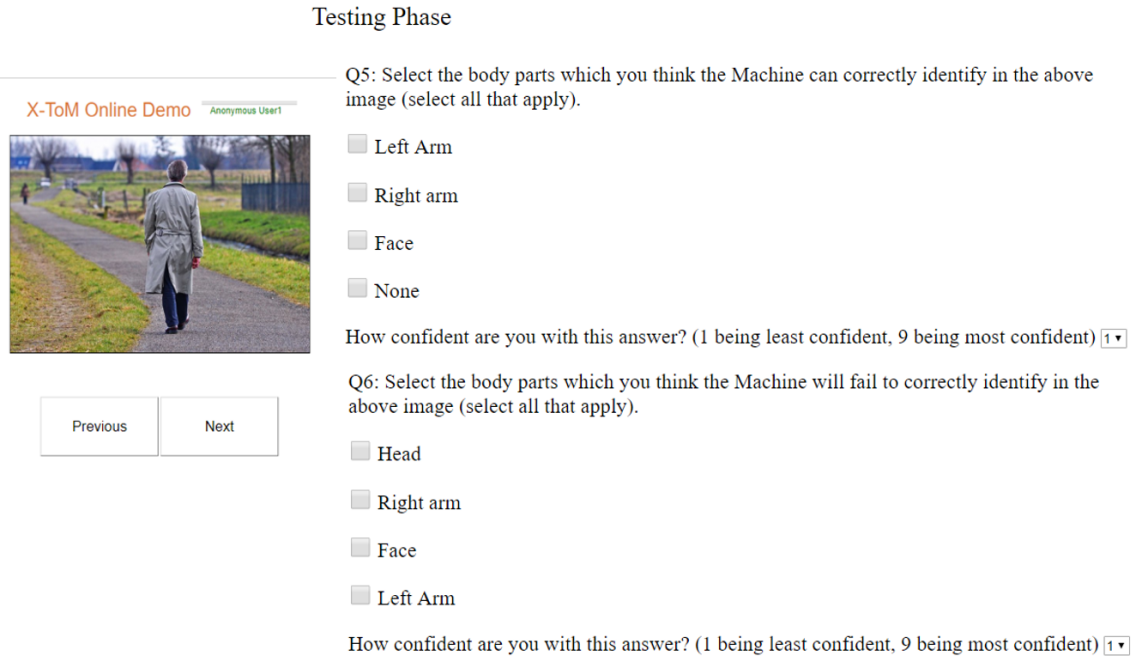
Specifically, there are two main types of evaluator questions about the user’s prediction: (1) whether the Performer would successfully or incorrectly detect objects, parts and other concepts encoded by AOG; and (2) which image parts are most influential for the Performer’s successful or incorrect object detection. For example, the evaluator’s questions include “which parts of the image are most important for the machine to recognize that the person is running”, and “which small part of image contributes most to inferring the surrounding larger part of image”. Figures 4, 5 and 6 show few sample screenshots (from our web interface) of the exact questions, on the detection of the body part “Left-Arm”, that we pose to the subjects.
A.2 Evaluation with Psychology Subject Pool
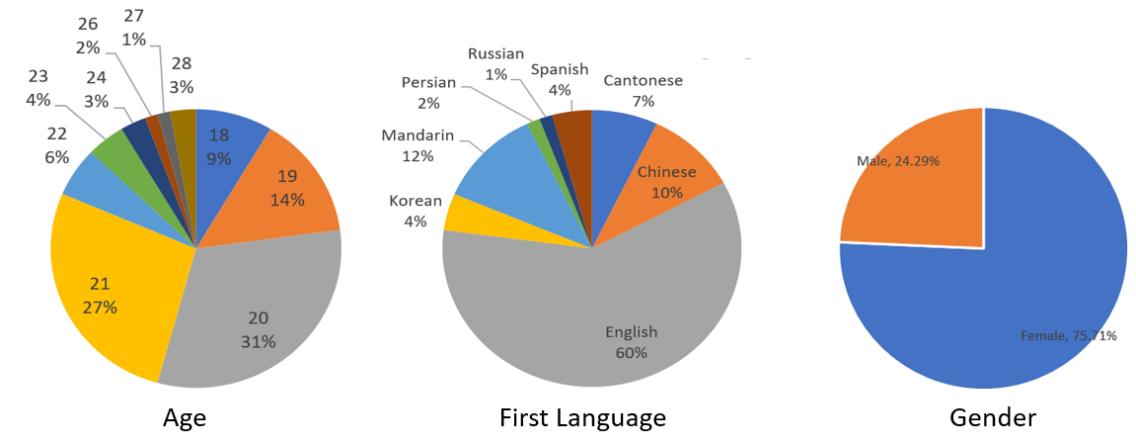
Figure 1 shows the statistics (Age, First Language, Gender) of the 120 human subjects, recruited from our institution’s Psychology subject pool.
A.3 Human Subject Evaluation: Additional Results
In addition to the metrics Justified Trust and Reliance, we also measure the following metrics for comparing our X-ToM framework with the baselines (QA and Saliency Maps):
-
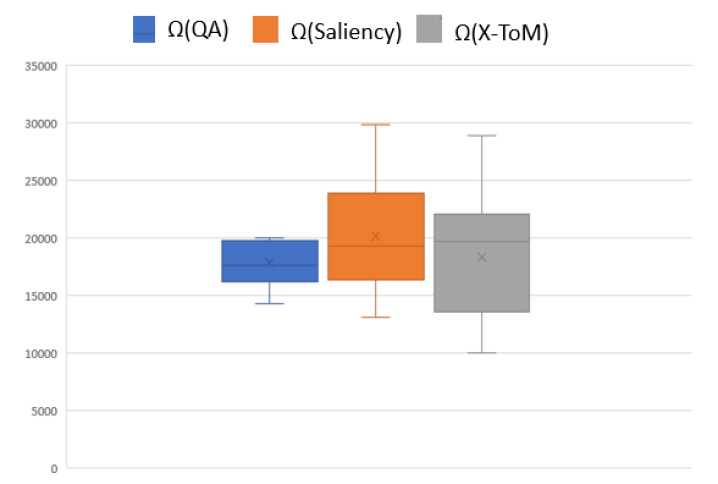
Figure 2: Response Times (in milliseconds per question). Error bars denote standard errors of the means. -
•
Response Time: We record the time taken by the human subject in answering evaluator questions. Figure 2 shows the average response times (in milliseconds per question) for each of the three groups (X-ToM, QA and Saliency Maps). We expected the participants in X-ToM group to take less time to respond compared to the baselines. However, we find no significant difference in the response times across the three groups.
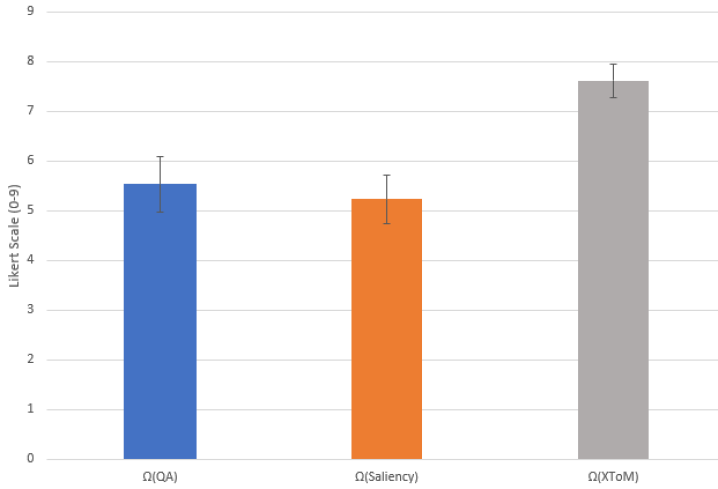
Figure 3: Qualitative Reliance. Error bars denote standard errors of the means. -
•
Explanation Satisfaction: We measure human subjects’ feeling of satisfaction at having achieved an understanding of the machine in terms of usefulness, sufficiency, appropriated detail, confidence, understandability, accuracy and consistency [hoffman17explanation, hoffman2018metrics, miller2018explanation, hoffman2010metrics]. We ask them to rate each of these metrics on a Likert scale of 0 to 9. Figure LABEL:fig:satisfaction shows the average explanation satisfaction rates obtained from each of the three groups. As we can see, subjects in X-ToM experiment group found that explanations were highly useful, sufficient and detailed compared to the baselines (). However, we did not find significant differences across the three groups in terms of other satisfaction measures: confidence, understandability, accuracy and consistency.
-
•
Subjective Evaluation of Reliance: We collect subjective Reliance values (on a Likert scale of 0 to 9) from the subjects in the three groups. The results are shown in Figure 3. These results are consistent with our quantitative reliance measures. It may be noted that subjects’ qualitative reliance in Saliency Maps is lower compared to the QA baseline.
(NOTE: Please see the figures shown in the next few pages.)