ALMACAL VI: Molecular gas mass density across cosmic time via a blind search for intervening molecular absorbers
Abstract
We are just starting to understand the physical processes driving the dramatic change in cosmic star-formation rate between and the present day. A quantity directly linked to star formation is the molecular gas density, which should be measured through independent methods to explore variations due to cosmic variance and systematic uncertainties. We use intervening CO absorption lines in the spectra of mm-bright background sources to provide a census of the molecular gas mass density of the Universe. The data used in this work are taken from ALMACAL, a wide and deep survey utilizing the ALMA calibrator archive. While we report multiple Galactic absorption lines and one intrinsic absorber, no extragalactic intervening molecular absorbers are detected. However, thanks to the large redshift path surveyed (), we provide constraints on the molecular column density distribution function beyond . In addition, we probe column densities of N(H2) > 1016 atoms cm-2, five orders of magnitude lower than in previous studies. We use the cosmological hydrodynamical simulation IllustrisTNG to show that our upper limits of at already provide new constraints on current theoretical predictions of the cold molecular phase of the gas. These results are in agreement with recent CO emission-line surveys and are complementary to those studies. The combined constraints indicate that the present decrease of the cosmic star-formation rate history is consistent with an increasing depletion of molecular gas in galaxies compared to .
keywords:
quasars: absorption lines – galaxies: evolution – galaxies: formation – ISM: molecules1 Introduction
Understanding the efficiency of converting baryons into stars is a challenge in studies of galaxy formation and evolution.
The star-formation rate history (SFH) is well established from observations of star-forming galaxies across cosmic time at infrared, ultra violet, submillimetre, and radio wavelengths (Madau &
Dickinson, 2014, and references therein). The star-formation rate (SFR) density increased at high redshift, reached a peak at around and decreased until today (see Madau &
Dickinson, 2014, for a review). Which physical processes are driving this dramatic change and their relative importance represent two of the main unanswered questions of modern astrophysics. Whether this is due to a lack of cold gas supply, or a lower efficiency in converting the gas into stars, or to the presence of strong outflows preventing the infall of new cold material, is still debated
(e.g. Madau &
Dickinson, 2014; Katsianis et al., 2017, and references therein). Simple expectations would have the SFH mirror the cold gas evolution, as gas is being consumed by star formation (e.g. Putman, 2017; Driver
et al., 2018). The atomic gas density, , is the original reservoir of gas for star formation and is indeed well constrained locally and at . Most recent results, however, indicate a mild evolution in with cosmic lookback time (e.g. Noterdaeme et al., 2009; Zafar et al., 2013; Rhee et al., 2018). Neutral hydrogen provides the essential reservoir, but it has to cool and transform to the molecular phase in order to provide the necessary conditions for star formation. Further studies using damped Lyman absorbers as well as H i 21 cm absorption traced with the Square Kilometre Array (SKA) path finder observations provide important clues on physical state of the atomic gas and the neutral inter-stellar medium (ISM) physics (Kanekar, 2014; Allison
et al., 2016). However, a direct probe of the fuel for star formation has to come from measurements of the molecular phase of the gas.
In order to probe this essential phase of baryons over cosmic time, a number of deep cosmological surveys for CO emission lines have been conducted. The first study used the Institute de Radioastronomie Millimétrique (IRAM) Plateau de Bure Interferometer to perform molecular line scans in the Hubble Deep Field North and provided upper limits on the cosmic molecular gas mass density (Decarli et al., 2014; Walter et al., 2014). More recently, the ALMA Spectroscopic Survey in the Hubble Ultra Deep Field (ASPECS), provided the first measurements of at redshift (Decarli et al., 2016, 2019). The CO Luminosity Density at High Redshift (COLDz) survey (Riechers et al., 2018) undertaken with the VLA offers first indications of the molecular mass density at high redshift ( 2–3 and 5–7). An alternative approach using the dust mass as a tracer of the molecular gas mass is presented by Scoville et al. (2017). The fact that multiple transitions of CO at different redshifts can be searched in a given observed frequency setting greatly increases the redshift path, and hence the searched volume. These emission-line surveys are especially sensitive to the high-mass end of the molecular gas mass function. However, such observations require large investments in telescope time, and since typically only a small contiguous area is covered, the results are prone to cosmic variance effects.
Four intervening molecular absorbers have been detected in targeted surveys of strongly lensed systems and galaxy merger pairs that were known to show H i absorption (e.g. Wiklind & Combes, 1995; Kanekar et al., 2005; Wiklind et al., 2018; Combes et al., 2019). Only the molecular absorber towards PKS 1830-211 was detected before any other lines were known (Wiklind & Combes, 1996b). In addition, associated molecular absorption lines have been found in three intermediate-redshift AGN (Wiklind & Combes, 1994, 1996a; Allison et al., 2018). Similar, intrinsic absorption is observed more frequently in low redshift AGNs (e.g. Tremblay et al., 2018; Maccagni et al., 2018; Rose et al., 2019) and in high-redshift submillimetre galaxies (SMGs) (e.g. George et al., 2014; Falgarone et al., 2017; Indriolo et al., 2018). de Ugarte Postigo et al. (2018) also reported CO absorption lines against Gamma Ray Bursts (GRBs) observed with Atacama Large Millimetre and Submillimetre Array (ALMA). However, to measure the cosmic molecular gas mass density in an unbiased way, blind detections of intervening molecular absorbers are required.
Here, we present a complementary approach to probing the molecular phase of the gas and its evolution with cosmic time free from cosmic variance issues. In analogy with studies at optical wavelengths (e.g. Péroux et al., 2003; Zafar et al., 2013), we use (sub)mm-bright ( Jy) background sources to probe intervening molecular absorption lines. Moving from optical to mm wavelengths has the advantage that this study is not affected by dust attenuation in the quasar spectra which might be expected for molecular absorbers. Therefore, by choosing (sub)mm-bright background objects we are not biased against potentially dusty absorbers. Furthermore, tracing molecular absorption offers a measurement of the cosmic molecular gas density free from cosmic variance.
A similar “blind” study was performed at lower frequencies using the Green Bank Telescope (Kanekar et al., 2014). The authors surveyed a redshift path, defined as the sum of the redshift intervals covered by the individual spectra (), of at and did not detect any molecular absorbers with N(H2) . In the present work, we perform a “blind” search for CO absorbers against a large sample of (sub)mm bright background galaxies. These objects are all 880 ALMACAL targets observed up until December 2018. ALMACAL consists of observations of a large sample of bright, compact sources (generally blazars, see Bonato et al., 2018) which are used as calibrator sources for ALMA. These calibrators are ideal targets for an unbiased search for CO absorbers for two main reasons. First, the total integration time spent on ALMACAL sources is hours, orders of magnitude more than what would be attainable in a targeted ALMA survey programme for intervening absorption lines. Secondly, since the calibrators are distributed all over the sky observable with ALMA, it is possible to quantify the effect of cosmic variance. In addition, the sensitivity of the absorption survey is independent of redshift and solely relies on the brightness of the unrelated background sources. Using absorption lines we are able to reach low gas column densities, providing us with a more complete and unbiased (with respect to excitation conditions) view of the molecular gas content of the Universe over cosmic time.
There are also several caveats using this blind absorption line approach. For example, a single identification of an absorption line cannot uniquely linked to a species, and hence not to the column density and the redshift of the absorber. However, since CO is a much stronger absorber than all other molecular species we can safely assume that any detected absorption line is tracing CO. Furthermore, unlike emission-line surveys in well-studied cosmological deep fields, our survey does not have the luxury of extensive ancillary data that can be used to identify source redshifts. Our sample of quasars is magnitude limited and therefore susceptible to effects of gravitational magnification. First, the probability of finding quasars with absorbers is increased by the flux boosting from gravitational lensing by the absorber. Second, the solid angle behind absorbers is gravitationally enlarged diluting the flux of the background quasar. Ménard & Péroux (2003) find indeed an excess of bright quasars with absorbers. Furthermore, ALMA calibrators are selected to be (sub)mm bright and have therefore redshifts of .
The paper is organised as follows: the ALMACAL survey including the optimised data reduction for this data-intensive project is presented in Sec. 2, in Sec. 3 we describe the absorption line search as well as the derivation of the limits on the CO column density distribution function from our observations and the molecular gas column density distribution function from the IllustrisTNG simulation, in Sec. 4 we present our limits on the molecular gas mass density evolution as a function of cosmic time and in Sec. 5 we summarize our conclusions. Throughout this paper we adopt a CDM cosmological model with , and .
2 ALMACAL observations and data reduction

We extract from the ALMA archive all phase, amplitude and bandpass calibrator data from PI observations from Cycles 1 to 6, taken before the 4th December 2018. We only consider data taken with the ALMA 12-m array. This amounts to observations of 880 calibrators. To determine the redshift of the calibrators, we use the compilation of redshifts from the database presented by Bonato et al. (2018), combined with the updated redshift estimates of the Australian Telescope 20 GHz survey (AT20G Ekers et al., 2007) sources (Mahony et al. (2011) and E. Mahony private comm.). For the remaining calibrators, we perform an additional query to the Simbad (Wenger et al., 2000) and NED111 The NASA/IPAC Extragalactic Database (NED) is operated by the Jet Propulsion Laboratory, California Institute of Technology, under contract with the National Aeronautics and Space Administration. databases. We note, however, that the accuracy of these redshifts might be limited. This results in redshift measurements of 622 calibrators. We test whether our samples of calibrators with and without redshift information are drawn from the same population of WISE colours (Band1 - Band4) and find that, based on a Kolmogorov- Smirnov test, we have to reject this hypothesis with a 96.4% confidence level. However, we perform the line search on all quasar spectra irrespective of the availability of the redshift and therefore do not introduce a bias in our sample of calibrators. The line identification of absorption signals towards background quasars without redshift information is not straightforward since without a known redshift, the absorption line could both be intervening and associated to the background source. For such cases it would be important to obtain a redshift of the quasar using follow-up observations. Thus far, this is a hypothetical problem since we do not find any extragalactic absorption lines towards background quasars at unknown redshifts. In the following we discuss only the spectra of quasars with known redshifts.
We devise a new, optimised data processing strategy to handle the large data volume comprising several tens of thousands of spectra while maintaining the highest spectral resolution. This is necessary to keep the data volume manageable. For reference, we store in our ALMACAL archive fully-calibrated ms-files with a reduced spectral resolution which amounts to more than 26 Tb of data. The reduced spectral resolution of 15 kHz is too low to study absorption lines that are expected to be narrower than km s-1 (Wiklind et al., 2018). A schematic view of the data reduction chain is illustrated by Fig. 1. To this end, the spectrum of the calibrator is extracted directly from the data, by fitting a point source model at the phase centre. For technical reasons, we extract the XX and YY polarisation data separately and add those in quadrature to obtain Stokes I spectra. We choose to only consider dual-polarization mode scans to keep the data retrieval simple and uniform, full polarisation data represents only a small fraction of the total ALMA archival data. For each calibrator observation, each spectral window is treated individually, resulting in a total of 28,644 spectra in our database. To remove unwanted structures from the spectra, we apply a bandpass correction by taking ratios of the spectra of pairs of calibrators from the same execution block. This procedure also removes some of the atmospheric absorption line signatures imprinted on the spectra. An example of this procedure is shown in Fig. 2. For the vast majority of the calibrator observations, this simple algorithm results in flat spectra, apart from those narrow spectral regions that correspond to strong atmospheric absorption. If more than two calibrators were used in one observation, all possible combinations of calibrator spectra pairs are used to produce bandpass-calibrated spectra. This approach allows us to confirm a potential detection identified in one ratio-ed spectrum using a second ratio.
For further processing of the spectra, we mask 5 per cent of the channels on each end of the spectrum to remove edge effects. These edge channels are often strongly affected by non-flat bandpass effects. Furthermore, we mask a 0.2 GHz wide window centred on the central frequencies of the strongest H2O, O2 and O3 atmospheric absorption lines identified from the ALMA atmosphere model provided by Juan Pardo222https://almascience.nrao.edu/about-alma/atmosphere-model. Spectra covering more than one atmospheric transition are not further considered. Finally, contiguous parts of the spectra narrower than 15 per cent of the total spectrum bandwidth are discarded to ensure a possible detection of the full absorption line and the continuum.
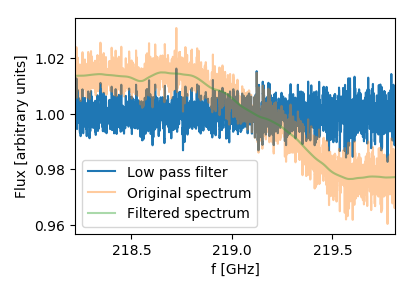
Despite the success of this simple algorithm, we observe that on several occasions, a second-order correction of the bandpass is required to remove all unwanted signal. To this end, we use a Butterworth low-pass filter developed as a maximally flat low-pass filter for signal processing. For each spectrum, we create a template of the spectrum including only structures wider than km s-1. The original spectrum is divided by this template of its low frequency shape. An example of this procedure is shown in Fig. 3. We expect molecular absorption lines to be narrow ( km s-1) and moreover, the quality of the spectra does not allow us to search for wider spectral lines since they would be indistinguishable from instrumental artefacts and imperfect bandpass calibration.
3 Analysis and Results


3.1 Blind Search for Intervening Absorbers

After the data processing described in the previous section and discarding spectra based on the criteria described above, we are left with 28,644 flattened spectra, cleaned from any unwanted atmospheric or instrumental effects, in which we search for absorption lines of astrophysical origin. The key properties of the data including observed frequencies and velocity resolution are shown in Fig. 4. We note that the spectra have varying bandwidth and spectral resolution, ranging from 0.03 MHz to 2 GHz, and from 256 to 3840 channels, respectively. We devise a search algorithm based on a signal-to-noise threshold of , and apply this algorithm to both the ratios and the inverted ratios to search for absorption in both calibrator spectra. Since the spectra show no significant bandpass variations based on manual inspection, we can apply a global -threshold for each individual spectrum. Before running the finder algorithm, we smooth each spectrum to increase the signal-to-noise ratio. We use a range of smoothing kernels between 10 and 190 in steps of 10 . Furthermore, we only record detections if the signal is significant in two consecutive channels.
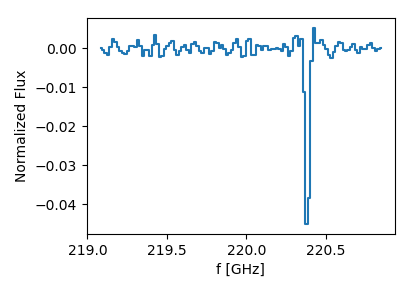
From this initial list of candidates, we remove all detections which occur within the lowest or the highest 5 per cent of channels to remove absorption line candidates for which we do not see the continuum on both sides. Furthermore, we discard detections that lie within 200 of the velocities of the centres of known Galactic CO lines. We apply an additional manual cleaning of candidate detections that can be identified as obvious electronic artefacts (such as strong periodic signals). For the remaining candidates, we identify atmospheric and Galactic transitions by cross-matching the detected frequencies observed in multiple sight lines. Finally, we match the candidate list with a list of frequencies corresponding to rare molecular species from SPLATALOGUE (Remijan et al., 2007) to filter out remaining absorption lines of Galactic origin. Examples of a detection of Galactic absorption and associated absorption are shown in Fig. 5. The Galactic absorption lines will be the subject of a forthcoming paper. Additionally, we compare the redshift of the lowest possible CO transition with the calibrator redshift and exclude implausible lines (i.e. the redshift of the absorber would be higher than the redshift of the background quasar). After performing these checks, we are left with one significant detection of an extragalactic molecular absorption line shown in Fig. 5, which we identify to be intrinsic CO(1-0) absorption in the spectrum of the background calibrator J1415+1320 () (Wiklind & Combes, 1994). This detection validates the robustness of our finding algorithm.
3.2 The Column Density Distribution Function Based on Intervening Absorbers
We calculate the column density distribution function from the sensitivity limits we reach in the calibrator spectra. To illustrate the potential of this method we derive predictions of the column density distribution function from the IllustrisTNG100 cosmological hydrodynamical simulation (Pillepich et al., 2018; Naiman et al., 2018; Nelson et al., 2018b; Marinacci et al., 2018; Springel et al., 2018).


| CO | Redshift | ||
|---|---|---|---|
| transition | range | ||
| CO(1–0) | 48.4 | 61.2 | |
| CO(2–1) | 13.4 | 16.3 | |
| CO(3–2) | 20.4 | 28.6 | |
| CO(4–3) | 9.8 | 14.6 | |
| CO(5–4) | 1.4 | 2.1 | |
| CO(1–0) | 0.0 | 0.0 | |
| CO(2–1) | 34.1 | 80.8 | |
| CO(3–2) | 18.5 | 42.0 | |
| CO(4–3) | 18.8 | 41.5 | |
| CO(5–4) | 17.5 | 40.0 |


We first calculate the redshift path probed by the 28,644 spectra included in our survey. For each spectrum, we compute the redshift path observed (see e.g. Zafar et al., 2013) given the observed frequencies and assuming CO transitions from up to . The frequency coverage of the fully reduced and masked spectra is used for this calculation. The maximum probed redshift in each spectrum is set by the redshift of the calibrator. The cumulative redshift path surveyed, , is 182.2 for CO transitions between and . We further split the sample in two redshift ranges, at and with mean redshifts of and . The two subsamples are covering approximately the same pathlength of at and at . Details of the redshift paths for each CO transition in the two sub-samples are listed in Table 1.
We then calculate the limiting CO column densities probed in our survey following Mangum & Shirley (2015). We assume an excitation temperature equal to the CMB temperature at the redshift probed with the spectrum, because this is the lowest possible temperature. The physical conditions of the molecular absorbing gas in the galaxy lensing the quasar PKS1830–211 were investigated by Muller et al. (2013). They found that for polar molecules, the excitation temperature is close to that of the CMB at the corresponding redshift. A molecule like CO, on the other hand, is easier to excite due to its low electric dipole moment, and in general, we would not be able to constrain for CO to better than , without constraints from additional lines/species. Since we have no detections, we perform the calculation using the level from each spectrum as the detection threshold and an expected FWHM of the absorption line of km s-1 (Wiklind et al., 2018). The CO column density limit is converted into a H2 column density limit using a mean column density ratio of (Burgh et al., 2007). In order to bound the large uncertainty on this conversion factor, we also present CO column densities derived with upper and lower limits of to , respectively. The column density limits from non-detections are calculated for each observation using the corresponding frequency coverage and rms. We note that the column density ratio of over a large range of H2 column densities is not constant (Balashev et al., 2017). However, with the currently available data this is challenging to quantify.
Next, we estimate the limits on the column density distribution function following the definition (Carswell et al., 1984):
| (1) |
where the number of absorbers detected within the column density range is less than one. is the comoving pathlength for the specific column density under consideration. The comoving pathlength ensures that for a constant physical size and comoving number density, the absorbers have a constant (Bahcall & Peebles, 1969). The comoving pathlength of a single sightline, , is defined as follows:
| (2) |
| (3) |
The limiting column densities and covered path length are then combined for the whole survey.
The non-detections from our survey translate to upper limits on the column density distribution function. However, in the definition of the choice of the bin size influences the values of upper limits in the case of non-detections. Here, we use a bin width of dex, as it is common practice in H i absorption line studies (e.g. Péroux et al., 2003). The resulting upper limits on the column density distribution function are shown in Fig. 6 for the two redshift ranges.
To remedy the dependence on the bin size, we also calculate the cumulative number of absorbers per (Péroux et al., 2003) as a function of column density, which is independent of the binning choice (see Fig. 7). We also calculate the cumulative number of absorbers expected based on the results from BIMA SONG observations of local star-forming galaxies (Zwaan & Prochaska, 2006) for comparison.
3.3 Predicting the Column Density Distribution Function from IllustrisTNG

From a modelling point of view, the molecular phase of the cold gas is challenging to assess because of the complexity of the physics involved and because it requires sub-grid modelling to capture the unresolved physics. Semi-analytical techniques of pressure-based models (Blitz & Rosolowsky, 2006; Gnedin & Kravtsov, 2011; Krumholz, 2013) are used to split the cold hydrogen from hydrodynamical simulations (such as the EAGLE or IllustrisTNG) into its atomic and molecular components (Obreschkow et al., 2009; Popping et al., 2014; Lagos et al., 2015; Chen et al., 2018).
Here we use the TNG100 volume of the IllustrisTNG simulations (Pillepich et al., 2018; Naiman et al., 2018; Nelson et al., 2018b; Marinacci et al., 2018; Springel et al., 2018) through its publicly available data (Nelson et al., 2018a) in order to compare our observations against the theoretical expectation for the column density distribution function. An example of the column density map in a typical galaxy from the simulations is shown in Fig. 8. We construct the column density distribution function at the mean redshift of the two subsamples () using the modeling methodology of Popping et al. (2019) (see also Stevens et al. (2019); Diemer et al. (2019) for assessments of the H i and outcomes of TNG) and the column density distribution function gridding procedure as described in Nelson et al. (2019). The column density is integrated over a path length of 10 cMpc . In order to assess the sensitivity of our result to various physical and numerical choices, we present a band which encompasses several different column density distribution function calculations, which vary the model employed (three versions), the projection depth / effective path length (five values), different grid sizes for the computation of the column density (three values), and assumptions on the contents of star-forming versus non-star-forming gas cells. In Fig. 9, we show the expected evolution of the column density distribution function with redshift. We find that an increasing number of high column density absorbers at high redshift is expected. On the low column density end, on the other hand, the number of absorbers is almost constant over and increases at . We also note that in the IllustrisTNG100 results, high column densities observed by Zwaan & Prochaska (2006) are not reproduced. This may be due in part to the limited volume in the simulation. Furthermore, the simulations predict more low column density molecular gas compared to the observations. The expected error range shown in Fig. 6 also applies to this plot, but is not shown for reasons of clarity. This will not explain the full discrepancy. Additional uncertainties affecting the comparison between the simulations and observations are the assigning of a molecular gas fraction to the gas cells in the post processing as well as the CO-to-H2 conversion factor used in the observations. Furthermore, Diemer et al. (2019) compare H2 half mass radii in IllustrisTNG, relative to stellar half-mass radii, to the EDGE-CALIFA survey (based on CO), finding that although both TNG and EDGE-CALIFA have a majority of galaxies with , the median ratio in TNG is approximately 30% larger, though with a large dependence on the invoked HI/H2 model. However, this degree of difference in H2 extents cannot fully explain the large H2 column differences seen here.
The prediction of the column density distribution function and the cumulative number of absorbers are shown in Fig. 6 and 7. We have conducted the same analysis on the results from the EAGLE simulation (Schaye et al., 2015; Crain et al., 2015) and find that the qualitative expectations for the column density distribution function are in line with those from IllustrisTNG.

3.4 Cosmic Evolution of the Molecular Gas Mass Density

Finally, we calculate the molecular gas mass density from the cumulative number of absorbers per . We use the functional form of the cumulative number of absorbers per from Zwaan & Prochaska (2006) at as a proxy. We scale it to our upper limits and integrate over differential number of absorbers multiplied by the respective column density. Zwaan & Prochaska (2006) found that the contribution of low column density absorbers with to the total molecular gas mass at is only 3 per cent. Therefore, we integrate only column densities log() 21. Since we aim at a comparison with other surveys, we define similar redshift bins to those introduced by the ASPECS survey (Decarli et al., 2016, 2019) for this calculation. The resulting limits are shown in Fig. 10, where we also report measurements from the literature based on the same cosmology and CO-to-H2 conversion factor.
4 Discussion
With our “blind” survey for intervening molecular absorbers we put significantly improved constraints on the column density distribution function of molecular gas beyond . We compare our upper limits with the measurements at presented by Zwaan & Prochaska (2006) in Fig. 6 and find that our limits at and are consistent with the column density distribution function measurement at . The depth of our data translates to five orders of magnitude lower column densities than probed by Zwaan & Prochaska (2006). In addition, the absorption technique with a sensitivity independent of redshift in principle allows us to measure the redshift evolution of the column density distribution function.
We calculate limits on the limiting cross section of the molecular gas per galaxy based on the non-detection and the surveyed redshift path. We assume a Schechter (1976) galaxy luminosity function and a uniform and spherically symmetric distribution of molecular gas and follow the description in Péroux et al. (2005). We derive a maximum radius of 4.8 kpc at and 4.6 kpc at . Zwaan & Prochaska (2006) find a median impact parameter of of 2.5 kpc, consistent with our upper limits. Our results provide statistical evidence that molecular gas around galaxies have a limited extent, well below the typical size of CGM regions. It however does not exclude that the CGM may contain more clumpy molecular gas.
Compared to the predictions from IllustrisTNG from Sec. 3.3 presented in Fig. 6 our limits are already close, within 1 dex, of the expected value of at low column densities. The sensitivity reached in our survey is comparable to the column densities predicted by the simulations. However, uncertainties in this comparison are still large in both observations and simulations. The observations on the one hand involve a conversion from measured CO column densities to column densities. Cosmological simulations on the other hand are lacking the resolution and associated small-scale physics to follow molecular cloud formation and rely on sub-grid physics models. Furthermore, the uncertainty of the molecular gas fraction in gas cells assigned in the post processing and the too extended H2 disk sizes as measured by their half mass radii in IllustrisTNG (Diemer et al., 2019) make a direct comparison challenging. Improvements on both sides are necessary to further explore the molecular column density distribution.
Fig. 10 shows the cosmic evolution of the cold gas in the Universe. Dedicated efforts to measure the cosmic evolution of the molecular gas mass density from deep CO emission line observations by the ASPECS and COLDz surveys have provided the first measurements of over a large redshift range (Decarli et al., 2016, 2019; Riechers et al., 2018). Uncertainties in the measurements, such as those related to uncertain CO excitation, completeness errors, and redshift errors are discussed by the authors of these studies. At least of similar importance for deep surveys with small fields of view such as ASPECS and COLDz are the effects of cosmic variance on measurements. This has been shown to be particularly important at low redshift (Popping et al., 2019). A complementary approach using the dust emission yields comparable results on (Scoville et al., 2017). In our absorption-based study presented this paper, we provide new upper limits free from cosmic variance effects. Our limits are consistent with the measurements at z = 0 of Keres et al. (2003); Zwaan & Prochaska (2006); Boselli et al. (2014); Saintonge et al. (2017) and supportive of the results of Decarli et al. (2016, 2019); Scoville et al. (2017). A fit to observations is shown based on Rhee et al. (2018). These results show that the amount of cold gas in its atomic form is only a few times higher than that in its molecular phase from to , implying that the decrease of density is faster than for H i towards late times. While the SFH evolves by a factor 20–30 from to present day, decreases by one order of magnitude in the same time lapse and by less than 15 per cent. These findings indicate that H2 is being consumed faster than H i can replenish it unless it is constantly fed. The dramatic decrease of the cosmic star-formation rate density might therefore arise from a shortfall of molecular gas supply. On the contrary the MUFASA simulation predicts a shallower evolution of the molecular gas mass density than indicated by the observations (Davé et al., 2017).
Future blind absorption line surveys will offer more stringent constraints on the evolution of the cosmic molecular gas mass density by either moving to higher redshifts, where more high column density absorbers are predicted per , or by increasing the surveyed redshift path. For our current survey we would be sensitive to the measurements from ASPECS if we would cover a 1.3 times larger comoving redshift path (). To put this into perspective, it is important to realize that the ALMACAL results presented in this paper are based on more observing time than the sum of all ALMA Large Programs from Cycles 4 to 7. ALMACAL is an ongoing survey, so more redshift pathlength is accumulated continuously. But even a modest increase of a factor of two will take several years of observing. Another significant improvement in the covered redshift pathlength would be achieved by increasing the instantaneous frequency coverage of ALMA observations from its current 8 GHz per polarisation to at least 16 GHz, as is recommended in the ALMA development roadmap (Carpenter et al., 2019). Apart from this technological improvement, an increase of the redshift path could be achieved by measuring more optical redshifts for ALMA calibrator sources, which is under way. However, the uncertainties introduced by lensing of the background quasar by the foreground absorber will remain a systematic issue.
5 Summary and Conclusions
| 0.003 – 0.369 | |
|---|---|
| 0.2713 – 0.6306 | |
| 0.6950 – 1.1744 | |
| 1.006 – 1.738 |
We present constraints on the cosmic evolution of the molecular gas density of the Universe from a “blind” search for extragalactic intervening molecular absorbers using the ALMACAL survey. The novelty of the approach resides in i) its redshift-independent sensitivity, ii) its ability to reach low gas densities, and iii) the fact that it overcomes cosmic variance effects. Our survey is sensitive to column densities as low as N(CO)>1011 cm-2 (). This is five orders of magnitude lower than probed in previous surveys (Zwaan & Prochaska, 2006; Kanekar et al., 2014).
To keep the data reduction simple and uniform, we use an simple data processing method to handle the large data volume while maintaining the data at its highest spectral resolution. The resulting sample of 622 unique quasar spectra is searched “blindly" for CO absorption lines. At , we survey a total pathlength of and a total comoving pathlength of . At , and . The large path length surveyed allows us to put constraints on the CO column density distribution functions at and . While we detect multiple Galactic absorption lines and one known extragalactic intrinsic absorber, no extragalactic intervening molecular absorbers have been found.
The upper limits on the molecular mass density reported in this survey are presented in Table 2. These upper limits are consistent with previous surveys. Together, these findings indicate that the dramatic decrease of the star-formation rate history might arise from a shortfall of molecular gas supply. Our limits add a constraint on the contribution from low column density molecular hydrogen. In addition, the new absorption line technique offers a characterization of cosmic variance issues possibly affecting emission surveys (Popping et al., 2019).
We present the theoretical estimates of the molecular gas column density distribution from post-processing of the IllustrisTNG results. These estimates are consistent with our observational upper limits. However, both are subject to systematic uncertainties. Both a better understanding of the CO-to-H2 conversion factor and advances in the modelling of molecular gas in cosmological simulations will decrease the uncertainties.
To put stronger constraints on the evolution of the molecular gas mass, a significant improvement on the redshift path covered per observation with ALMA is needed. This will occur naturally over time and will be accelerated by the proposed technological upgrades. Further improvement will result from the measurement of background quasar redshifts.
Acknowledgements
The authors thank Ryan J. Cooke for useful discussions, Jonghwan Rhee for providing the fit to and Sergei Balashev for discussions on the CO-to-H2 column density conversion. AK acknowledges support from the STFC grant ST/P000541/1 and Durham University. CP thanks the Alexander von Humboldt Foundation for the granting of a Bessel Research Award held at MPA. IRS acknowledges support from the ERC Advanced Grant DUSTYGAL (321334), a Royal Society/Wolfson Merit Award and STFC (ST/P000541/1). RD thanks the Alexander von Humboldt Foundation for support. ALMA is a partnership of ESO (representing its member states), NSF (USA), and NINS (Japan), together with NRC (Canada), NSC and ASIAA (Taiwan), and KASI (Republic of Korea), in cooperation with the Republic of Chile. The Joint ALMA Observatory is operated by ESO, AUI/NRAO, and NAOJ. This research has made use of the SIMBAD database, operated at CDS, Strasbourg, France . This research has made use of the NASA/IPAC Extragalactic Database (NED), which is operated by the Jet Propulsion Laboratory, California Institute of Technology, under contract with the National Aeronautics and Space Administration.
References
- Allison et al. (2016) Allison J. R., Zwaan M. A., Duchesne S. W., Curran S. J., 2016, MNRAS, 462, 1341
- Allison et al. (2018) Allison J. R., et al., 2018, MNRAS
- Bahcall & Peebles (1969) Bahcall J. N., Peebles P. J. E., 1969, ApJ, 156, L7
- Balashev et al. (2017) Balashev S. A., et al., 2017, MNRAS, 470, 2890
- Blitz & Rosolowsky (2006) Blitz L., Rosolowsky E., 2006, ApJ, 650, 933
- Bonato et al. (2018) Bonato M., et al., 2018, MNRAS, 478, 1512
- Boselli et al. (2014) Boselli A., Cortese L., Boquien M., Boissier S., Catinella B., Lagos C., Saintonge A., 2014, A&A, 564, A66
- Burgh et al. (2007) Burgh E. B., France K., McCandliss S. R., 2007, ApJ, 658, 446
- Carpenter et al. (2019) Carpenter J., Iono D., Testi L., Whyborn N., Wootten A., Evans N., 2019, arXiv:1902.02856 [astro-ph]
- Carswell et al. (1984) Carswell R. F., Morton D. C., Smith M. G., Stockton A. N., Turnshek D. A., Weymann R. J., 1984, ApJ, 278, 486
- Chen et al. (2018) Chen L.-H., Hirashita H., Hou K.-C., Aoyama S., Shimizu I., Nagamine K., 2018, MNRAS, 474, 1545
- Combes et al. (2019) Combes F., Gupta N., Jozsa G. I. G., Momjian E., 2019, arXiv:1901.04683 [astro-ph]
- Crain et al. (2015) Crain R. A., et al., 2015, MNRAS, 450, 1937
- Davé et al. (2017) Davé R., Rafieferantsoa M. H., Thompson R. J., Hopkins P. F., 2017, MNRAS, 467, 115
- Decarli et al. (2014) Decarli R., et al., 2014, ApJ, 782, 78
- Decarli et al. (2016) Decarli R., et al., 2016, ApJ, 833, 69
- Decarli et al. (2019) Decarli R., et al., 2019, arXiv:1903.09164 [astro-ph]
- Diemer et al. (2019) Diemer B., et al., 2019, arXiv:1902.10714 [astro-ph]
- Driver et al. (2018) Driver S. P., et al., 2018, MNRAS, 475, 2891
- Ekers et al. (2007) Ekers R. D., Massardi M., Sadler E. M., 2007, in From Planets to Dark Energy: The Modern Radio Universe. p. 47
- Falgarone et al. (2017) Falgarone E., et al., 2017, Nature, 548, 430
- George et al. (2014) George R. D., et al., 2014, MNRAS, 442, 1877
- Gnedin & Kravtsov (2011) Gnedin N. Y., Kravtsov A. V., 2011, ApJ, 728, 88
- Indriolo et al. (2018) Indriolo N., Bergin E. A., Falgarone E., Godard B., Zwaan M. A., Neufeld D. A., Wolfire M. G., 2018, ApJ, 865, 127
- Kanekar (2014) Kanekar N., 2014, ApJ, 797, L20
- Kanekar et al. (2005) Kanekar N., et al., 2005, Phys. Rev. Lett., 95, 261301
- Kanekar et al. (2014) Kanekar N., Gupta A., Carilli C. L., Stocke J. T., Willett K. W., 2014, ApJ, 782, 56
- Katsianis et al. (2017) Katsianis A., Tescari E., Blanc G., Sargent M., 2017, MNRAS, 464, 4977
- Keres et al. (2003) Keres D., Yun M. S., Young J. S., 2003, ApJ, 582, 659
- Krumholz (2013) Krumholz M. R., 2013, MNRAS, 436, 2747
- Lagos et al. (2015) Lagos C. d. P., et al., 2015, MNRAS, 452, 3815
- Maccagni et al. (2018) Maccagni F. M., Morganti R., Oosterloo T. A., Oonk J. B. R., Emonts B. H. C., 2018, A&A, 614, A42
- Madau & Dickinson (2014) Madau P., Dickinson M., 2014, ARA&A, 52, 415
- Mahony et al. (2011) Mahony E. K., et al., 2011, MNRAS, 417, 2651
- Mangum & Shirley (2015) Mangum J. G., Shirley Y. L., 2015, PASP, 127, 266
- Marinacci et al. (2018) Marinacci F., et al., 2018, MNRAS
- Ménard & Péroux (2003) Ménard B., Péroux C., 2003, A&A, 410, 33
- Muller et al. (2013) Muller S., et al., 2013, A&A, 551, A109
- Naiman et al. (2018) Naiman J. P., et al., 2018, MNRAS, 477, 1206
- Nelson et al. (2018a) Nelson D., et al., 2018a, arXiv:1812.05609 [astro-ph]
- Nelson et al. (2018b) Nelson D., et al., 2018b, MNRAS, 475, 624
- Nelson et al. (2019) Nelson D., et al., 2019, Computational Astrophysics and Cosmology, 6, 2
- Noterdaeme et al. (2009) Noterdaeme P., Ledoux C., Srianand R., Petitjean P., Lopez S., 2009, A&A, 503, 765
- Obreschkow et al. (2009) Obreschkow D., Croton D., De Lucia G., Khochfar S., Rawlings S., 2009, ApJ, 698, 1467
- Péroux et al. (2003) Péroux C., McMahon R. G., Storrie-Lombardi L. J., Irwin M. J., 2003, MNRAS, 346, 1103
- Péroux et al. (2005) Péroux C., Dessauges-Zavadsky M., D’Odorico S., Sun Kim T., McMahon R. G., 2005, MNRAS, 363, 479
- Pillepich et al. (2018) Pillepich A., et al., 2018, MNRAS, 475, 648
- Popping et al. (2014) Popping G., Somerville R. S., Trager S. C., 2014, MNRAS, 442, 2398
- Popping et al. (2019) Popping G., et al., 2019, arXiv:1903.09158 [astro-ph]
- Putman (2017) Putman M. E., 2017, in Gas Accretion onto Galaxies. eprint: arXiv:1612.00461, p. 1, doi:10.1007/978-3-319-52512-9_1
- Remijan et al. (2007) Remijan A. J., Markwick-Kemper A., ALMA Working Group on Spectral Line Frequencies 2007, in Bulletin of the American Astronomical Society. p. 132.11
- Rhee et al. (2018) Rhee J., Lah P., Briggs F. H., Chengalur J. N., Colless M., Willner S. P., Ashby M. L. N., Le Fèvre O., 2018, MNRAS, 473, 1879
- Riechers et al. (2018) Riechers D. A., et al., 2018, arXiv:1808.04371 [astro-ph]
- Rose et al. (2019) Rose T., et al., 2019, arXiv:1902.01863 [astro-ph]
- Saintonge et al. (2017) Saintonge A., et al., 2017, ApJS, 233, 22
- Schaye et al. (2015) Schaye J., et al., 2015, MNRAS, 446, 521
- Schechter (1976) Schechter P., 1976, ApJ, 203, 297
- Scoville et al. (2017) Scoville N., et al., 2017, ApJ, 837, 150
- Springel et al. (2018) Springel V., et al., 2018, MNRAS, 475, 676
- Stevens et al. (2019) Stevens A. R. H., et al., 2019, MNRAS, 483, 5334
- Tremblay et al. (2018) Tremblay G. R., et al., 2018, ApJ, 865, 13
- Walter et al. (2014) Walter F., et al., 2014, ApJ, 782, 79
- Wenger et al. (2000) Wenger M., et al., 2000, A&AS, 143, 9
- Wiklind & Combes (1994) Wiklind T., Combes F., 1994, A&A, 286, L9
- Wiklind & Combes (1995) Wiklind T., Combes F., 1995, A&A, 299, 382
- Wiklind & Combes (1996a) Wiklind T., Combes F., 1996a, A&A, 315, 86
- Wiklind & Combes (1996b) Wiklind T., Combes F., 1996b, Nature, 379, 139
- Wiklind et al. (2018) Wiklind T., Combes F., Kanekar N., 2018, ApJ, 864, 73
- Zafar et al. (2013) Zafar T., Péroux C., Popping A., Milliard B., Deharveng J.-M., Frank S., 2013, A&A, 556, A141
- Zwaan & Prochaska (2006) Zwaan M. A., Prochaska J. X., 2006, ApJ, 643, 675
- de Ugarte Postigo et al. (2018) de Ugarte Postigo A., et al., 2018, A&A, 620, A119