The extended Main Sequence Turnoff of the Milky Way open cluster Collinder 347
Abstract
We made use of the Gaia DR2 archive to comprehensively study the Milky Way open cluster Collinder 347, known until now as a very young object of solar metal-content. However, the versus colour-magnitude diagram (CMD) of bonafide probable cluster members, selected on the basis of individual stellar proper motions, their spatial distribution and placement in the CMD, reveals the existence of a Hyades-like age open cluster (log( /yr) = 8.8) of moderately metal-poor chemical content ([Fe/H] = -0.4 dex), with a present-day mass of 3.3103 M⊙. The cluster exhibits an extended Main Sequence turnoff (eMSTO) of nearly 500 Myr, while that computed assuming Gaussian distributions from photometric errors, stellar binarity, rotation and metallicity spread yields an eMSTO of 340 Myr. Such an age difference points to the existence within the cluster of stellar populations with different ages.
keywords:
(Galaxy:) open clusters and associations: general – (Galaxy:) open clusters and associations: individual – technique: photometric.1 Introduction
Extended Main-Sequence Turnoffs (eMSTOs) have recently been confirmed to be a common feature in the colour-magnitude diagrams (CMDs) of Milky Way open clusters (Cordoni et al., 2018). It has gained an increasing consensus that its origin could be linked to stellar rotation (Bastian et al., 2018; Sun et al., 2019; Li et al., 2019). Indeed, Marino et al. (2018b, a) spectroscopically measured different rotational velocities of Main Sequence stars of Milky Way open clusters and Magellanic Cloud clusters with observed eMSTOs. However, other previous works have concluded that age variation, together with rotation, are necessary to explain the eMSTO (Gossage et al., 2019, and references therein). D’Antona et al. (2017) have suggested that if the bluest stars in the eMSTO are interpreted as stars initially rapidly rotating, but that have later slowed down, the age difference disappears, and "braking" also helps to explain the apparent age differences of the eMSTO (see also Georgy et al., 2019).
Besides eMSTOs, clusters younger than 1 Gyr also exhibit split Main Sequences (see Milone et al., 2018, and references therein). The comparison between the observations and isochrones suggests that the blue Main Sequences are made of slow-rotating stars, while the red ones host stars with rotational velocities close to the breakup value. Note that there would be a minimum mass for rotating stars in order to make MSTOs significantly wider than the rest of the cluster’s Main Sequence (Goudfrooij et al., 2018). Large populations of Be stars, which are fast-rotating stars, have also been detected (Bastian et al., 2017; Dupree et al., 2017).
Here we report a serendipitous discovery for an open cluster, Collinder 347, to exhibit an eMSTO much wider than that predicted considering altogether photometric uncertainties, binarity, metallicity spread and stellar rotation. The finding is twofold, because the cluster was known to be young ( 15 Myr) and of solar metal content (Bukowiecki et al., 2011; Kharchenko et al., 2013; Clariá et al., 2019), but we show that it would seem to be a Hyades-like age cluster with a moderately metal-pool overall abundance. The anomalous wide eMSTO of Collinder 347 deserves further investigation to answer the very question about whether it could come from a intrinsic age spread. If such a hypothesis were confirmed, it would impact in the way we understand how star clusters could form and evolve.
In Section 2 we describe the used data sets and the applied filtering criteria in order to select probable cluster members. Section 3 deals with the cluster structural and astrophysical properties estimates, while in Section 4 we discuss the unveiled cluster eMSTO.
2 Data handing
We used the Gaia DR2 archive111http://gea.esac.esa.int/archive/ to retrieve astrometric positions (RA,DEC,l,b), proper motions in Right Ascension (pmra) and Declination (pmdec) and photometry of stars in a field of 22 centred on Collinder 347. We limited our sample to stars with excess noise (epsi 2) and significance of excess of noise (sepsi 1) to prune the data (Lindegren et al., 2018; Piatti et al., 2019). Top-left panel of Fig. 1 shows a group of stars inside the drawn circle that arises as an overdensity in the vector proper motion diagram; they clearly reveal Collinder 347 on the sky (see the top-right panel). Furthermore, the group of stars encircled within the central circle mainly define the cluster CMD (bottom-right panel), which seems to correspond to a populous and intermediate-age open cluster. The radius of that circle is the cluster radius (log( /arcsec) = 3.0), defined as the intersection of the cluster stellar radial profile with the mean background level (see bottom-left panel of Fig. 1).
We first inspected to quality of the kinematic and photometric information of all the stars located inside both, the circle in the vector proper motion diagram and the central circle in the finding chart. Fig. 2 shows that there is no dependence of the individual proper motions with the magnitude nor with the distance from the cluster centre. Their uncertainties increase with the magnitude, as expected. As for the Gaia DR2 photometry, there would seem to be no trend with crowding. Furthermore, according to Arenou et al. (2018, see Section 3), the Gaia DR2 photometry completeness is 90 per cent for stars with 19 mag in the inner region of a globular cluster with 104 stars/sq deg, so that we deal with basically a complete photometry data sets.
In order to clean the cluster CMD from the contamination of field stars with similar cluster kinematics projected along the cluster line-of-sight, we used as reference six circular regions distributed around the cluster circle as shown in Fig. 1 (top-right panel). For each reference star field CMD, we generated a sample of boxes (, ( - )o) centred on each star, with sizes ((), ( - )) defined in such a way that one of their corners coincides with the closest star in that CMD region. The intrinsic magnitudes and ( - )o colours where computed from individual reddenings obtained from the interstellar absorption maps produced by Lallement et al. (2019), and the relationships = 2.44 and = 1.27 (Cardelli et al., 1989; Wang & Chen, 2019). Lallement et al. (2019) used the Gaia DR2 and 2MASS photometric data sets to estimate the extinction towards 27 millions carefully selected stars, from which a 3D map of Milky Way interstellar dust within 3 kpc from the Sun was generated. The mean differential-reddening resolution is 0.003 mag/pc.
Details of the procedure of representing the reference star field CMD with an assembly of boxes can be found in Piatti & Bica (2012) and Piatti et al. (2018). It has the advantage of accurately reproducing the reference star field in terms of stellar density, luminosity function and colour distribution. Note that this also implies to consider the variations of the interstellar reddening across the cluster field. The generated box sample of each reference star field CMD was superimposed at a time to the cluster CMD and subtracted from it one star per box; that closest to the box centre. We merged all the six cleaned cluster CMDs and produced one with membership probabilities () on the basis of the number of times a star kept unsubstracted. In the subsequent analysis we only retain star with 90 per cent, i,e., the most probable cluster members as judged by their kinematics, spatial distribution in the cluster field and position in the cluster CMD.
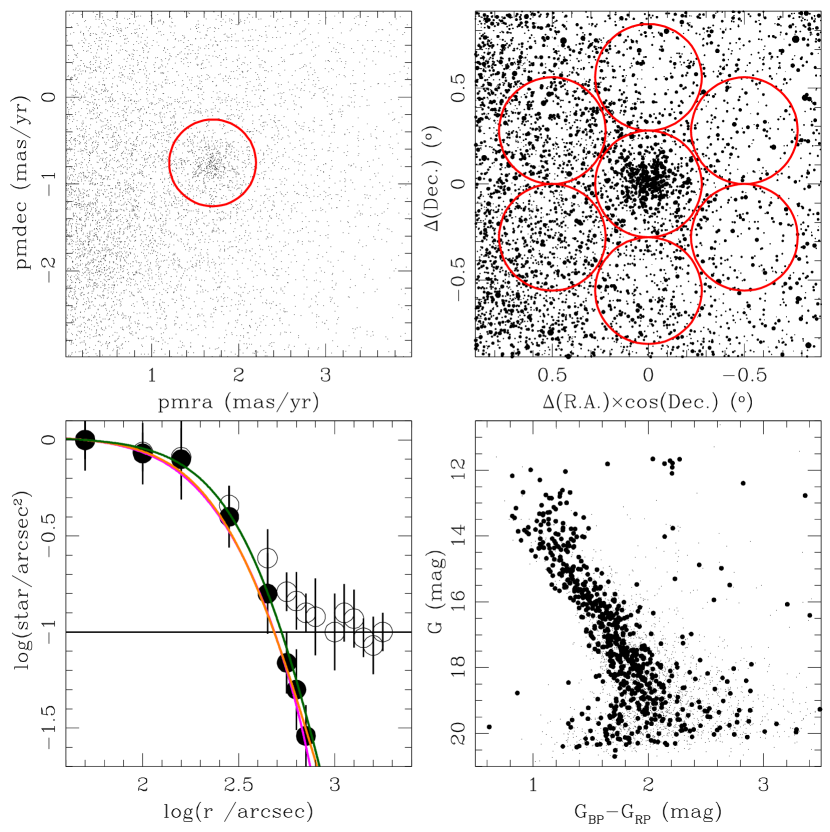


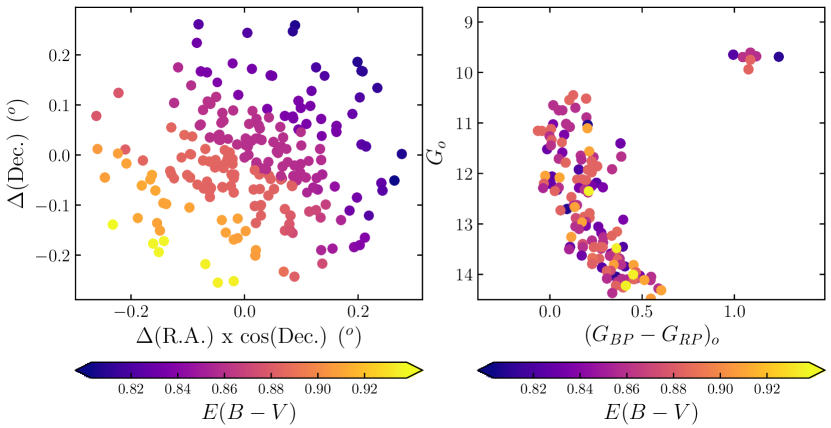
Fig. 3 illustrates the spatial distributions (left panel) and the intrinsic cluster CMD (right panel) of stars with 90 per cent, respectively. We have coloured the stars according to the reddening values provided by Lallement et al. (2019), which were used to obtain the intrinsic magnitudes and colours. As can be seen, the total differential reddening across the cluster field amounts 0.14 mag, which represents a spatial reddening variation of 0.003 mag/pc (= 0.006 mag/arcmin). The errors of the individual values spans the range 0.095 - 0.115 mag, which could blur any signature in the cluster CMD with a resolution smaller than 0.10 mag. Nevertheless, it does not appear to be any differential reddening effects affecting the distribution of stars along the cluster’s Main Sequence. For instance, reddest Main Sequence stars – particularly those grouped around 12.0 mag and 0.25 mag – are spread over the whole cluster field, i.e., they come from cluster regions with different values.
3 cluster’s astrophysical properties
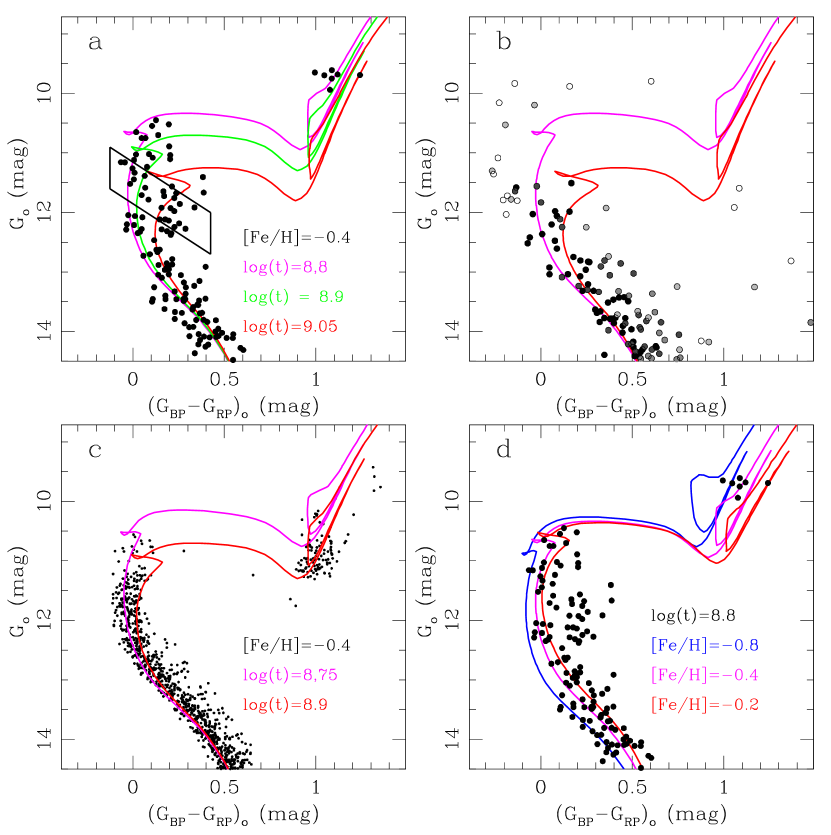
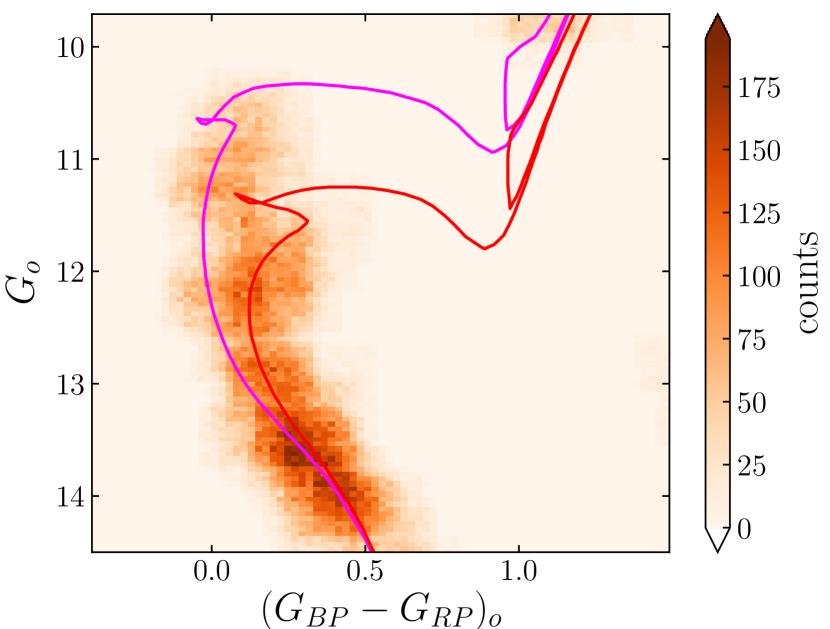
Fig. 4 (panel a) shows the resulting intrinsic cluster CMD for stars with 90 per cent. At first glance, there is no evidence for Collinder 347 to be a young open cluster, but one of intermediate-age. In order to estimate its age, distance and metallicity, we used that CMD to which we superimposed a subset of theoretical isochrones computed by Bressan et al. (2012). Taking into account as a reference the colour difference between the red clump and the MSTO, and the curvature and its extent of the lower envelope of the upper Main Sequence, we restricted the isochrone sample to those with 8.5 log( /yr) 9.1, in steps of (log( /yr)) = 0.05, and metallicities spanning almost all the Galactic open cluster metallicity range, namely, -0.8 [Fe/H] (dex) +0.2 (Heiter et al., 2014), in steps of [Fe/H] = 0.10 dex. We fitted all possible isochrone combination and found that it is necessary to allow isochrones spanning a range of ages in order to satisfactorily reproduce the upper Main Sequence bluest and reddest envelopes, simultaneously, provided that all of them are fitted using the the same true distance modulus and metallicity. Particularly, we found that = (10.70 0.15) mag, equivalent to a Galactocentric distance of = 6.9 kpc, [Fe/H] = (-0.40 0.15) dex and log( /yr) = 8.80 - 9.05, provide with the best resemblance of the cluster CMD. The youngest isochrone reproduces at a (log( /yr)) = 0.05 level the bluest lower and upper parts of the cluster Main Sequence, simultaneously, while that of log( /yr)= 8.9 could be associated to the mean fiducial cluster Main Sequence. The cluster CMD also hints at the existence of an eMSTO, as judged by the satisfactory match of the isochrone of log( /yr) = 9.05.
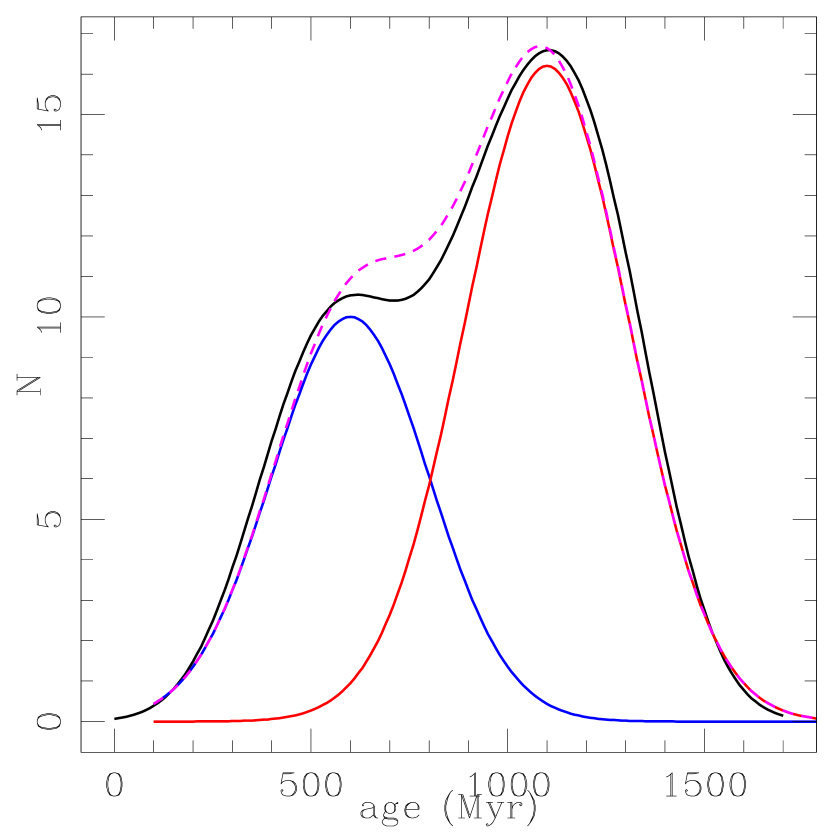
In order to quantify the extent of the eMSTO we counted the number of stars () located within the rectangle drawn in Fig. 4 (panel a), using as independent variable the coordinate (X) along the long axis (Goudfrooij et al., 2011; Piatti, 2013). We then built the distribution by summing all the individual X values. We represented each X value by a Gaussian function with centre and full-width half maximum equal to the X value and 2.355 times the associated error (X), respectively, and assigned to each Gaussian the same mean intensity. (X) was computed taking into account the photometric errors (see Fig. 2) and the individual errors. Thus, we avoid the problem of the histogram dependence on the bin size and the end points of bin, which frequently lead to a difficulty in interpreting the results. The result is a continuous distribution – instead of a discrete histogram – that allows to appreciate the finest structures. Fig. 5 depicts the resulting distribution with a black curve. As can be seen, a bimodal profile emerges, with blue and red peaks at 60030 Myr and 110030 Myr, respectively, as fitted by the iraf.ngaussfit routine. We then adopted as a mean eMSTO extent the difference between both mean values, i,e. 50060 Myr.
For completeness purposes. we exploited the Gaia DR2 data sets to build the cluster stellar radial density profile. We used all the stars retrieved in the 22 region centred on the cluster with proper motions within the circle drawn in Fig. 1 (top-left panel) and brighter than 18 mag, to secure photometry completeness. We then counted the number of stars in rings centred on the cluster of width 15 up to 110 in steps of 15, and averaged all the constructed individual radial profiles. Fig. 1 (bottom-left panel) depicts the resulting radial profile with open circles, while the background subtracted one – the mean background level was estimated from rings far away the cluster region – is drawn with filled circles. We fitted King (1962), Plummer (1911) and Elson et al. (1987) models by minimisation and obtained core (), half-light () and tidal ( ) radii of 1.600.15 pc, 2.800.15 pc and 8.001.50 pc, respectively. The EFF’s power-law at large radii () turned out ot be 5.00.5.
If the cluster mass were confined to , and a Milky Way mass enclosed at the cluster Galactocentric distance were assumed to be log( = 11.41 + 0.527log( = 11.85 (Taylor et al., 2016), the present-day cluster’s mass from Chernoff & Weinberg (1990) would result (3.31.8)103 M⊙. From Lamers et al. (2005b, eqs. 2, 3, 7 and 11) and Lamers et al. (2005a, Table 1), we found that the fraction of initial mass still bound to the cluster is 0.04, after lived more than 20 times its mean relaxation time = 324 Myr, computed from Spitzer & Hart (1971, eq. 5) for a mean MSTO stellar mass of 2.8 M⊙.
4 Analysis and discussion
The reddest MSTO stars observed in Fig. 4,a unlikely belong to the field,
since every stars located
within the cluster’s circle and with 90 per cent have intrinsic magnitudes
and colours clearly different. Fig. 4,b depicts the loci of these
stars with grey-coded symbols, where black and white filled circles
corresponding to 85 (%) 90 and 10 (%) 15, respectively.
We thoroughly also investigated whether the photometric errors and the individual stellar
reddening errors could blur such an eMSTO. To assess on this effect we
performed Monte Carlo simulations to generate a thousand CMDs per
star with 90 per cent, allowing that star to have random intrinsic magnitudes
and colours within the interval [] and
[], respectively. We
computed:
= [G2 + (2.44 E(B-V))2]1/2,
= [2 +
2 + (1.27 E(B-V))2]1/2,
where represents the errors in each quantity. From a total of 227000 generated CMDs we built the Hess diagram of Fig. 6, which still exhibits the eMSTO seen in Fig, 4. Note that with more accurate reddening estimates, the eMSTO feature would have resulted even more visible.
The combined effect of stellar binarity and photometric errors was evaluated through the generation of a synthetic CMD for a cluster with a total mass of 5103 M⊙ and age and metal content as for Collinder 347. We used syclist222https://www.unige.ch/sciences/astro/evolution/en/database/syclist/ (Ekström et al., 2012; Georgy et al., 2014) and padova.cmd333http://stev.oapd.inaf.it/cgi-bin/cmd (Bressan et al., 2012) packages and assumed a binary faction of 0.5 (Milone et al., 2016; Piatti & Cole, 2017). The resulting synthetic CMD is shown in Fig. 4,c where we superimposed two theoretical isochrones (Bressan et al., 2012) embracing the observed spread. Following the same procedure described above to estimate the observed MSTO extent, we obtained from the synthetic CMD (age) = 23030 Myr.
We also dealt with metallicity spread using a subset of isochrones, which assume (see Fig. 4,d). Note that we assumed an arbitrary amount of metallicity and helium content variations, aiming at illustrating for completeness purposes that they do not impact on the MSTO extent. Indeed, as far as we are aware, there is no evidence of metallicity and helium spread in Milky Way open clusters (Donor et al., 2018). In this case, we adopted (age) = 5010 Myr.
As for estimating the magnitude of stellar rotation effects, we made use of the relationship obtained by Niederhofer et al. (2015) between the age of a star cluster and the expected (apparent) age spread. Thus, by interpolating an age of log( /yr) = 8.8) in their Fig. 2, we obtained (age) = 25040 Myr. High fraction of Be stars that implies a high fraction of rapidly rotating stars have been found in Milky Way open clusters and Magellanic Cloud clusters (Bastian et al., 2017; Milone et al., 2018). As H contributes to the three Gaia DR2 bandpasses444https://www.cosmos.esa.int/web/gaia/iow_20180316, and hence it is in principle cancelled through the colour, the observed broadness – particularly the redest stars around 12.0 mag and 0.25 mag – confirms that the observed spread is not mainly caused by rapid rotators.
Finally, we added in quadrature all the apparent age spreads by approximating them to Gaussian distributions (see Piatti & Cole, 2017), namely, that from observational errors and stellar binarity (230 Myr), that from stellar rotation (250 Myr), and that from iron-helium variations (50 Myr), to obtain an overall apparent age spread of 34050 Myr. As can be seen, the resulting value is clearly smaller than the observed one of 50060Myr. The difference between the mean values is 160 Myr, clearly smaller than the sum of their respective uncertainties (100 Myr). Moreover, if we subtracted them in quadrature, then the intrinsic age spread would turn out to be 360130 Myr. This extended observed age spread points to the need of considering stellar populations with different ages could populate Collinder 347.
Acknowledgements
We thank Mateus Angelo and Wilton Dias because their work inspired us to dig into the Gaia’ archive, and Dafydd Evans to provided me with feedback about Gaia’s photometry completeness. This work presents results from the European Space Agency (ESA) space mission Gaia. Gaia data are being processed by the Gaia Data Processing and Analysis Consortium (DPAC). Funding for the DPAC is provided by national institutions, in particular the institutions participating in the Gaia MultiLateral Agreement (MLA). The Gaia mission website is https://www.cosmos.esa.int/gaia. The Gaia archive website is https://archives.esac.esa.int/gaia.
References
- Arenou et al. (2018) Arenou F., et al., 2018, A&A, 616, A17
- Bastian et al. (2017) Bastian N., et al., 2017, MNRAS, 465, 4795
- Bastian et al. (2018) Bastian N., Kamann S., Cabrera-Ziri I., Georgy C., Ekström S., Charbonnel C., de Juan Ovelar M., Usher C., 2018, MNRAS, 480, 3739
- Bressan et al. (2012) Bressan A., Marigo P., Girardi L., Salasnich B., Dal Cero C., Rubele S., Nanni A., 2012, MNRAS, 427, 127
- Bukowiecki et al. (2011) Bukowiecki Ł., Maciejewski G., Konorski P., Strobel A., 2011, Acta Astron., 61, 231
- Cardelli et al. (1989) Cardelli J. A., Clayton G. C., Mathis J. S., 1989, ApJ, 345, 245
- Chernoff & Weinberg (1990) Chernoff D. F., Weinberg M. D., 1990, ApJ, 351, 121
- Clariá et al. (2019) Clariá J. J., Parisi M. C., Palma T., Ahumada A. V., Oviedo C. G., 2019, Acta Astron., 69, 1
- Cordoni et al. (2018) Cordoni G., Milone A. P., Marino A. F., Di Criscienzo M., D’Antona F., Dotter A., Lagioia E. P., Tailo M., 2018, ApJ, 869, 139
- D’Antona et al. (2017) D’Antona F., Milone A. P., Tailo M., Ventura P., Vesperini E., di Criscienzo M., 2017, Nature Astronomy, 1, 0186
- Donor et al. (2018) Donor J., et al., 2018, The Astronomical Journal, 156, 142
- Dupree et al. (2017) Dupree A. K., et al., 2017, ApJ, 846, L1
- Ekström et al. (2012) Ekström S., et al., 2012, A&A, 537, A146
- Elson et al. (1987) Elson R. A. W., Fall S. M., Freeman K. C., 1987, ApJ, 323, 54
- Georgy et al. (2014) Georgy C., Granada A., Ekström S., Meynet G., Anderson R. I., Wyttenbach A., Eggenberger P., Maeder A., 2014, A&A, 566, A21
- Georgy et al. (2019) Georgy C., et al., 2019, A&A, 622, A66
- Gossage et al. (2019) Gossage S., et al., 2019, arXiv e-prints, p. arXiv:1907.11251
- Goudfrooij et al. (2011) Goudfrooij P., Puzia T. H., Kozhurina-Platais V., Chandar R., 2011, ApJ, 737, 3
- Goudfrooij et al. (2018) Goudfrooij P., Girardi L., Bellini A., Bressan A., Correnti M., Costa G., 2018, ApJ, 864, L3
- Heiter et al. (2014) Heiter U., Soubiran C., Netopil M., Paunzen E., 2014, A&A, 561, A93
- Kharchenko et al. (2013) Kharchenko N. V., Piskunov A. E., Schilbach E., Röser S., Scholz R. D., 2013, A&A, 558, A53
- King (1962) King I., 1962, AJ, 67, 471
- Lallement et al. (2019) Lallement R., Babusiaux C., Vergely J. L., Katz D., Arenou F., Valette B., Hottier C., Capitanio L., 2019, A&A, 625, A135
- Lamers et al. (2005a) Lamers H. J. G. L. M., Gieles M., Portegies Zwart S. F., 2005a, A&A, 429, 173
- Lamers et al. (2005b) Lamers H. J. G. L. M., Gieles M., Bastian N., Baumgardt H., Kharchenko N. V., Portegies Zwart S., 2005b, A&A, 441, 117
- Li et al. (2019) Li C., Sun W., de Grijs R., Deng L., Wang K., Cordoni G., Milone A. P., 2019, ApJ, 876, 65
- Lindegren et al. (2018) Lindegren L., et al., 2018, A&A, 616, A2
- Marino et al. (2018a) Marino A. F., Przybilla N., Milone A. P., Da Costa G., D’Antona F., Dotter A., Dupree A., 2018a, AJ, 156, 116
- Marino et al. (2018b) Marino A. F., Milone A. P., Casagrande L., Przybilla N., Balaguer-Núñez L., Di Criscienzo M., Serenelli A., Vilardell F., 2018b, ApJ, 863, L33
- Milone et al. (2016) Milone A. P., Marino A. F., D’Antona F., Bedin L. R., Da Costa G. S., Jerjen H., Mackey A. D., 2016, MNRAS, 458, 4368
- Milone et al. (2018) Milone A. P., et al., 2018, MNRAS, 477, 2640
- Niederhofer et al. (2015) Niederhofer F., Georgy C., Bastian N., Ekström S., 2015, MNRAS, 453, 2070
- Piatti (2013) Piatti A. E., 2013, MNRAS, 430, 2358
- Piatti & Bica (2012) Piatti A. E., Bica E., 2012, MNRAS, 425, 3085
- Piatti & Cole (2017) Piatti A. E., Cole A., 2017, MNRAS, 470, L77
- Piatti et al. (2018) Piatti A. E., Cole A. A., Emptage B., 2018, MNRAS, 473, 105
- Piatti et al. (2019) Piatti A. E., Alfaro E. J., Cantat-Gaudin T., 2019, MNRAS, 484, L19
- Plummer (1911) Plummer H. C., 1911, MNRAS, 71, 460
- Spitzer & Hart (1971) Spitzer Jr. L., Hart M. H., 1971, ApJ, 164, 399
- Sun et al. (2019) Sun W., de Grijs R., Deng L., Albrow M. D., 2019, ApJ, 876, 113
- Taylor et al. (2016) Taylor C., Boylan-Kolchin M., Torrey P., Vogelsberger M., Hernquist L., 2016, MNRAS, 461, 3483
- Wang & Chen (2019) Wang S., Chen X., 2019, ApJ, 877, 116