Site dilution and charge disorder effect on physical properties in SrRu1-xGaxO3
Abstract
Here, we report an evolution of structural, magnetic and transport behavior in doped SrRu1-xGaxO3 ( 0.2). The nonmagnetic dopant Ga3+ (3) not only acts for magnetic site dilution in SrRuO3 but also it modifies the Ru charge state and electronic density. Our studies show that Ga3+ substitution does not affect the original orthorhombic-Pbnm structure of SrRuO3 which is due to its matching ionic radii with Ru4+. However, Ga3+ has a substantial effect on the magnetic behavior of SrRuO3 where it decreases both magnetic moment as well as magnetic transition temperature . Further, this dilution induces Griffiths phase behavior across and cluster-glass behavior at low temperature with higher concentration of doping. The magnetic critical exponent increases with due to this site dilution effect. The Ga3+ induces an insulating state in SrRuO3 with 0.05. The charge transport in paramagnetic as well as in insulating state of samples can be well described with Mott’s modified variable-range-hopping model. The metallic charge transport just below in SrRuO3 obeys Fermi liquid behavior which, however breaks down at low temperature. We further find a correlation between field dependent magnetoresistance and magnetization through power-law behavior over the series.
pacs:
75.47.Lx, 75.40.Cx, 75.40.Gb, 75.47.-m1 Introduction
The 4 based oxide SrRuO3 is commonly believed to be an itinerant ferromagnet (FM) with transition temperature 163 K. [1, 2, 3, 4, 5, 6, 7, 8] The itinerant character of magnetism is very evident in the fact that the observed magnetic moment ( 1.4 /f.u), even measured in high enough magnetic field around 30 T, comes lower than its expected spin-only value, 2 /f.u. [2] The nature of magnetism in SrRuO3 closely follows the mean-field type, [3, 6, 9, 7, 8] however, recent calculations as well as experimental data indicate that this material probably hosts both itinerant and localized type of magnetism. [5, 7] The electrical transport behavior in SrRuO3 is equally interesting. The electrical resistivity () increases continuously even at high temperature till 1000 K. However exhibits a distinct slope change across that establishes its close correlation with the magnetic behavior. [1] The SrRuO3 is considered to be a ‘bad metal’ as at high temperature crosses the Ioffe-Regel limit that is considered for (good) metallic conductivity. [1, 10, 11, 12] A Fermi-liquid (FL) type charge conduction at low temperature and its breakdown at high temperature below have been shown in SrRuO3 in several studies. [11, 13, 14, 80, 81, 82, 83] The x-ray photoemission spectroscopy (XPS) studies have further shown a contradicting results favoring both significant as well as weak electron correlation strength () in SrRuO3.[15, 16] In spite of large volume of studies, the interrelation between magnetism and transport behavior in SrRuO3 remains poorly understood. The high temperature metallic behavior of SrRuO3 has enabled this material to be used as electrode in fuel cell an other devices. Further, due to its high spin polarization factor, SrRuO3 has potential application in spintronics. Recent observation of magnetic skyrmion phase in ultrathin films of SrRuO3 has opened another avenue for its future technological applications.[17, 18] Based on its immense importance from both basic and applied sciences, this material continues to attract attention in condensed matter community.
To understand the complex properties of SrRuO3, the route of chemical substitution at both Sr- and Ru-site has been adopted in various studies. The isoelectronic substitution in Sr1-yCayRuO3 causes a suppression of FM state, and around = 0.7 the system shows a quantum phase transition (QPT). [2, 3] Regarding Ru-site doping, two types of elements are of obvious choice; magnetic (Fe4+, Rh4+, Ir4+, Cr4+, etc) and nonmagnetic (Ti4+, Pb4+, Zn2+, Mg2+). [19, 20, 21, 22, 23, 24, 25, 26, 27, 28, 29, 30, 31, 32] While former type participates in existing magnetic interactions, the later causes a dilution in magnetic lattice. In the category of nonmagnetic doping, substitution of Ti4+ has been well studied. [24, 25, 26, 27, 28, 32] A recent study by us has shown that Ti4+ substitution (till 70%) weakens the magnetic moment and the strength of its interaction, though the FM remains largely unaffected that has been explained with opposite changes of and density of states ) under the model of itinerant ferromagnetism.[7]
In present study, we have used another nonmagnetic substitution Ga3+ (3) for Ru4+ in SrRu1-xGaxO3 ( 0.2). The Ga3+ has matching ionic radii (0.62 Å) with Ru4+ (0.62 Å) similar to Ti4+ (0.605 Å), which not only minimizes the effect of structural modification but also ensures it will substitute the Ru4+. The introduction of Ga3+ in magnetically and electrically active Ru-O-Ru channel will act for site dilution similar to another nonmagnetic element Ti4+ (3). However, Ga3+ will have added effects where it will convert an equivalent amount of Ru4+ to Ru5+ due to charge balance mechanism. Hence, there would be a mixture of Ru4+ and Ru5+ ions which will influence the magnetic and electronic properties accordingly. Further, the effective electron density will be modified in an opposite way in case of Ti4+ and Ga3+ substitution, therefore, the Stoner criteria, 1, for itinerant FM will be affacted. While there are some reports of Ti doped SrRuO3 studies,[7] to the best of our knowledge, this is the first study of Ga substitution in SrRuO3. The results will help to widen our knowledge about the effect of nonmagnetic substitution in SrRuO3.
Our studies show Ga substitution does not induce any structural phase transition but the structural parameters evolve with doping. Both as well as magnetic moment decreases with . As a consequence of magnetic site dilution, system develops Griffiths phase and cluster glass like behavior at higher doping concentration. A metal to insulation transition is induced for 0.05. The charge conduction in insulating part of samples follow a modified Mott’s variable-range-hopping model while in metallic phase it follows FL type behavior. We further observe a correlation between magnetoresistance and magnetization in samples.

2 Experimental Details
Polycrystalline series of samples SrRu1-xGaxO3 with nominal compositions = 0.0, 0.05, 0.1 and 0.2 have been synthesized using solid state reaction method. High purity ( 99.99% from Sigma Aldrich) ingredient materials, such as SrCO3, RuO2 and Ga2O3 are mixed well in stoichiometric ratio and then heated twice at 1000 oC for 24 hours with an intermediate grinding. Then, powders are pressed into pellets and heated at 1100 oC for 36 hours. Details of sample preparation and analysis are given elsewhere. [7] XRD data are collected using Rigaku MiniFlex diffractometer with Cu radiation in the 2 range from 10 to 90o at room temperature. The recorded XRD patterns are analyzed following Rietveld refinement program by FullProf software.[33] The x-ray photoemission spectroscopy (XPS) measurements have been done at the base pressure of 10-10 mbar using a commercial electron energy analyzer (Omicron nanotechnology) attached with non-monochromatic Al- x-ray source ( = 1486.6 eV). For the XPS measurement, sample is used in pellet form where the ion beam sputtering has been used before measurement for cleaning the sample surface. XPS data have been analyzed using XPS peakfit 4.1 software. Temperature () and magnetic field () dependent magnetization () data are collected using a superconducting quantum interference device (SQUID) magnetometer by Quantum Design. The electrical resistivity and magnetoresistance of present series is measured by a home-made instrument using the four-probe method. The ac magnetic susceptibility have been measured using a home-made setup in temperature range down to liquid nitrogen (LN2) temperature where the temperature and induced signals are collected using a temperature controller (LakeShore Cryotronics) and a lock-in amplifier (Stanford Research Systems).
.
-
Ga(x) 0.0 0.05 0.1 0.2 (Å) 5.5733(2) 5.5730(4) 5.5678(2) 5.5662(4) (Å) 5.5336(2) 5.5332(3) 5.5311(2) 5.5307(4) (Å) 7.8475(3) 7.8473(3) 7.8377(3) 7.8293(7) (Å3) 242.02(1) 241.98(4) 241.37(2) 241.03(3) Ru-O1 (Å) 1.9984(1) 1.9936(1) 1.9928(1) 1.9789(1) Ru-O2 (Å) 1.9665(1) 1.9657(1) 1.9613(1) 1.9587(2) Ru-O1-Ru 158.482(1) 159.489(2) 159.772(2) 164.865(3) Ru-O2-Ru 172.148(1) 173.152(1) 174.945(1) 175.701(2) 14.1 14.0 15.1 12.9 12.1 10.9 11.1 10.4
3 Results and Discussions
3.1 Structural and chemical analysis
The room temperature XRD patterns of present series are shown in Fig. 1a. As seen in the figure, XRD pattern do not show any modification with Ga composition in terms of peak position or any additional peak. We have previously shown that parent SrRuO3 crystallizes in GdFeO3-type orthorhombic Pbnm structure in agreement with reported studies. [2] We find that the original orthorhombic-Pbnm structure is continued for present whole series. Fig. 1b shows representative Rietveld analysis of XRD data for doped = 0.2 sample which is the last member of the present series. The Rietveld refinement shows a reasonably good fitting of XRD data for SrRu0.8Ga0.2O3 with original orthorhombic-Pbnm structure. Here, it can be mentioned that we obtain fitting indicator such as, value about 1.74, 1.97, 1.41 and 1.74 for = 0.0, 0.05, 0.1 and 0.2, respectively of present series which suggests a reasonably good fitting. Our Rietveld fitting is further evaluated with Goodness of fitting parameter (/) parameter which yields values within 1.3 for the whole series, implying a good fitting (Table I). Given that Ga3+ and Ru4+ has matching ionic radii (0.62 Å), therefore it is least expected for any major structural modification in the present series.
Table 1 shows the evolution of structural parameters with Ga substitution which are obtained from Rietveld analysis. The lattice parameters , and and volume show that the values decrease with Ga doping concentration. This evolution in lattice parameters can be understood from ionic distribution. The substitution of Ga3+ equivalently generates Ru5+, which has comparatively lower ionic radii (0.565 Å) than Ru4+. Therefore, decreasing lattice parameters affect the unit cell volume, . We have calculated the percentage change in structural parameters of SrRu1-xGaxO3 series such as, , , and with values around 0.007, 0.003, 0.018 and 0.99%, respectively. The changes in respective values are very insignificant which follows our expectation due to matching ionic radii. We also observe the change in RuO6 octahedral parameters. The SrRuO3 adopts a GdFeO3-type crystal structure where RuO6 octahedra demonstrates distortion both along ab-plane as well as along -direction which causes the basal and apical Ru-O-Ru bond angle to deviate from the ideal condition. Table 1 shows that both the basal Ru-O1 and apical Ru-O2 bond-length decreases in agreement with changes in lattice parameters. The basal (Ru-O1-Ru) as well as apical (Ru-O2-Ru) bond-angle for SrRuO3 in Table 1 agree with the reported values and implies RuO6 octahedra are both rotated and tilted along -axis. With Ga substitution, both the bond-angle increases toward ideal value of 180o, suggesting octahedral distortion is relieved progressively.

Elemental analysis of transition metal charge state has been done with x-ray photoemission spectroscopy (XPS). Fig. 1c shows the Ru-3 core level spectra for parent SrRuO3. Along with centrally located dominant peak at 284.2 eV due to C-1 state, the Ru-3 spectra shows two distinct peaks on both side at binding energies 281.2 and 287.7 eV which correspond to spin-orbit split Ru-3 and Ru-3 electronic states, respectively. The observed C-1 peak is mostly due to adhesive carbon tape used in the experiment. The red line in Fig. 1c is due to overall fitting while the respective fittings of C-1 and Ru-3 states are shown in figure. This fitting confirms the transition metal is in Ru4+ charge state which is also expected from its chemical composition.[34, 35]
3.2 DC Magnetization study for SrRu1-xGaxO3 series
The temperature dependent magnetization data, measured from 5 K to 300 K in 100 Oe following zero field cooling (ZFC) and field cooling (FC) protocol, are shown in Fig. 2a for SrRu1-xGaxO3 series. The SrRuO3 is a well documented itinerant type FM with 163 K. [2] Inset of Fig. 2a shows a close view of for all samples across . We observe that for parent SrRuO3 shows a sharp peak around 163 K and this is an onset temperature of bifurcation between and magnetization. In fact, SrRuO3 exhibits large bifurcation between ZFC and FC magnetization data which is suggestive of large anisotropy in this material. [36] In doped samples, while the onset temperature for bifurcation remains almost the same, but the amount of bifurcation reduces substantially. These results are similar to Ti doped samples where recently we have shown that the long-range ordering temperature remains almost unchanged till 70% of Ti substitution which has been explained from opposite tuning of electron correlation and density of states with Ti doping. [7] The present series, however, differs from the Ti doped one as Ga3+ not only act for site dilution but it creates Ru5+ which is magnetic and participates in magnetic interaction with existing Ru4+ ions. It is evident in inset of Fig. 2a that below , the in doped materials develops an extra peak which may originate from magnetic clustering effect (discussed later).
To understand the high temperature paramagnetic (PM) state, inverse susceptibility ( = ) as deduced from magnetization data in Fig. 2a, is shown of Fig. 2b. The in PM regime shows a linear behavior for all the samples which implies a Curie-Weiss (CW) type behavior. The , however, shows a sharp downturn close to in higher doped samples which are analyzed in terms of Griffiths phase behavior (discussed later). The data have been analyzed with modified CW law as following,
| (1) |
where is the temperature independent susceptibility, is the CW constant and is CW temperature. The fitting of Eq. 1 with data have been shown in Fig. 2b down to 200 K indicating reasonably good fitting. The fitting yields = 2.56 10-4 emu mol-1Oe-1, = 0.88 emu K mole-1 Oe-1 and = 160 K for SrRuO3. The positive sign of indicates the interaction between Ru ions is of FM type. Using the above value of CW constant, we have calculated the effective PM moment () which is about 2.65 /f.u. for SrRuO3 and closely matches with the reported values [2, 15, 37, 38]. The obtained value is also close to the calculated spin-only value () 2.83 /f.u. with = 1. The inset of Fig. 2b shows the variation of (left axis) and (right axis) with . The initially decreases till = 0.1 but then shows a slight increase for = 0.2. While remains positive throughout the series but this nonmonotonic behavior may be related to the change in Ru4+/Ru5+ ratio with . The measured , on the other hand, decreases linearly till = 0.1 and then shows a steep decrease. As discussed, doped Ga3+ ( = 0) converts Ru4+ ( = 1) to Ru5+ ( = 3/2). Therefore, the overall of the sample can be expressed as, = . The calculation shows that overall decreases continuously which agrees with our experimental values of (inset of Fig. 2b).


3.3 Thermal Demagnetization study
The thermal demagnetization of FM materials at low temperature is of particular interest. Usually, for exchange interaction driven FM systems, the thermal demagnetization is explained with Bloch’s spin-wave (SW) theory analysis which is expressed as following (neglecting higher order terms), [39]
| (2) |
where is the zero temperature magnetization and term comes due to long wavelength. Using the spin-wave coefficient (Eq. 2), spin-wave stiffness constant can be calculated as;
| (3) |
where , , and are the Boltzmann constant, Lande g-factor, Bohr magneton and density of material, respectively and (3/2) = 2.612. Similarly, Stoner single-particle (SP) excitations can be used to understand the low temperature demagnetization of itinerant FM where the origin of magnetism is associated with the splitting of band into spin-up and spin-down sub-bands separated by an exchange energy. The energy difference between two sub-bands is proportional to spontaneous magnetization (). The generalized form of Stoner’s single-particle excitations is given below,
| (4) |
where is the single-particle excitation coefficient, and is the energy gap between the top of full sub-band and Fermi level. The itinerant FM are divided into two categories based on and . For example, = 2 and = 0 gives a weak-type itinerant FM where both the sub-bands are partially filled and the Fermi level stays within both sub-bands. On the other hand, a strong-type itinerant FM is realized for = 3/2 and 0 where one sub-band is partially filled and another one is fully filled. As the spin-polarization of SrRuO3 is reported less than 100%, [40, 41] therefore a weak-type itinerant FM is expected in this material with following temperature dependence,
| (5) |

We have tried to fit the low temperature data, using both spin-wave (SW) and single-particle (SP) model separately that are shown in insets of Fig. 3. However, the thermal demagnetization data can be better fitted using combined SW and SP model which takes account both the localized as well as an itinerant model of magnetism as given below,
| (6) |
Our recent study has shown that low temperature thermal demagnetization in SrRu1-zTizO3 can be better explained with combined SW and SP model which is also in line with a recent theoretical calculation that suggests a coexistence of localized and itinerant magnetism in SrRuO3. [7, 5] Fig. 3 shows the temperature dependent magnetization data where solid lines are due to the best fitting of data with Eq. 6 up to 65 K where the fitting of data is shown with only spin-wave model [Eq. 2, upper inset], single-particle model [Eq. 5, lower inset] and combined model [Eq. 6, main panel] for SrRuO3. As evident in the figure, the Eq. 6 gives better fitting in wide temperature range which is also validated by higher value. The fitting in Fig. 3 (main panel) gives parameters of constants , and to be 0.463 /f.u., 9.0 10-5 K-3/2 and 1.17 10-5 K-2, respectively for SrRuO3. The spin-wave stiffness constant has been calculated using the fitted parameter using Eq. 6. We obtain = 264.9 meV for SrRuO3. The magnetic exchange coupling constant () between nearest-neighbor magnetic atoms has also been calculated using following equation [39]
| (7) |
where (=1) is the localized atomic spin for SrRuO3. The value of comes out to be 37.6 K. For the doped materials, we find similar combined model is required to understand the low temperature demagnetization data. According to band magnetism model, [42] if the spontaneous moment decreases, then the exchange splitting decreases by an amount, E = /N, where N is the number of spins per unit volume and is the Stoner parameter of spin-up and spin-down sub-bands. In present series, the decreases with Ga doping (inset, Fig. 6b), therefore, it is believed that the Fermi level will be further pushed inside and sub-bands. This suggests both spin-wave, as well as single-particle models would be required to explain the thermal demagnetization effect. The calculated and have been shown in Table 2 for present SrRu1-xGaxO3 series. The SW stiffness constant decrease till 0.1 and then it increases for = 0.2. Here, it can be mentioned that increasing value has been seen in other SrRu1-zTizO3 series. This opposite evolution of in both series with nonmagnetic doping is believed to arise due to change of Ru4+ ionic state in present series where in Ti doped series the Ru4+ charge state does not alter with doping. However, an increase of in = 0.2 sample may be due to an interplay between site dilution caused by Ga3+ doping and changing ionic state of Ru from Ru4+ to Ru5+.
3.4 Critical exponent behavior
The nature of magnetic interaction in magnetic materials is usually characterized by a universality class which is associated with different set of critical exponents. [43] These universality classes do not depend on microscopic details of materials; rather those are defined by lattice dimension and spin dimension. The temperature dependent magnetization in vicinity of obeys following relation,
| (8) |
where is the critical exponent, and is the magnetization at 0 K. The data have been fitted with Eq. 8 close to (Fig. 4). In fitting, the , and have been kept as free parameters. The obtained values of , and for SrRuO3 are 309.57 emu mol-1, 161.2(3) K and 0.48(2), respectively, where value implies a mean-field type behavior in SrRuO3. This exponent is consistent with other reported studies. [3, 6, 9] The values of as a function of Ga doping are shown in inset of Fig. 4. It is clear in the figure that the increases monotonically with Ga, reaching the value 0.696 0.05 for = 0.2 in SrRu1-xGaxO3 series. The similar behavior has also been obtained in SrRu1-zTizO3 series. This increase in with Ga substitution is likely caused by formation of FM clusters across , as explained in case of Ti doped in SrRuO3. [7, 8]
-
Ga(x) 0.0 0.05 0.1 0.2 (K) 161 146 111 133 (meV ) 264.9 206.6 179.2 327 ( K) 37.6 28.9 23.1 28.2 (/f.u) 0.69 0.61 0.55 0.38 / 1.46 1.63 1.81 1.82 (K) 134 144.7 (K) 169 173 0.004 0.002 0.846 0.944
3.5 Griffiths Phase behavior
The Griffiths phase (GP) like behavior originates from local disorder present in crystallographic structure and magnetic interactions. [44] The GP behavior is mainly characterized by formation FM clusters at temperatures higher than the . The inverse magnetic susceptibility () plotted as a function of temperature shows a sudden downturn near in the case of GP. [45, 46, 47] Fig. 5a shows within limited temperature regime for SrRu1-xGaxO3 series. The data for higher doped samples show a distinct downturn just above which implies a signature of GP like behavior. The temperature where data show an onset of downturn is termed as Griffiths temperature () and the temperature range between and is called GP regime where the system neither exhibits ideal FM order nor PM behavior, rather in this regime there exists ferromagnetically ordered finite-size clusters embedded in PM background. Due to the presence of clusters, the magnetization shows nonanalytic behavior, hence the susceptibility diverges which is reflected in a sharp downturn in . [45, 46] The sudden and sharp downfall of above in the GP regime is characterized by following relation: [47]
| (9) |
where is the random critical temperature where the magnetic susceptibility diverges which generally lies between the and . The choice of proper is very important for the correct evaluation of exponent . The exponent and have been determined following the protocol described in Ref. 42. This power law behavior appears a modified form of the CW equation where the finite arises due to FM cluster formation. The value lies in the range of 0 to 1. In the PM region the value of is realized to be 0, hence the Eq. 9 reduces to the standard CW equation. In the GP regime the follows the modified CW behavior i.e., Eq. 9 with non-zero value of . Fig. 5b shows semi-log plotting of Eq. 9 both in PM as well as in GP regime for = 0.1 and 0.2. The straight line fitting in Fig. 5b confirms GP like behavior in present series, as similar to previous Ti doped samples. [7] The obtained values of , and of doped samples are given in Table 2 while the exponent in PM is close to zero, the shows very high values which indicates a strong behavior of GP in these materials. The validity of GP confirms a formation of short-range FM clusters due to non-magnetic Ga3+ substitution and an increase of indicates the sizes of FM clusters decreases with Ga doping.

3.6 Isothermal Magnetization study
Fig. 6a shows the field dependent isothermal magnetization data collected at 5 K for SrRu1-xGaxO3 series. The data have been collected with a field range of 70 kOe. The parent SrRuO3 shows large hysteresis with coercive field () 4800 Oe which matches with reported study. [48] Even at high magnetic field, SrRuO3 does not exhibit sign of saturation which is probably due to itinerant nature of magnetism (Fig. 6a). At 70 kOe, we obtain magnetic moment = 1.25 /f.u. which is less than the calculated value (gS) = 2 /f.u. with total spin = 1 and g = 2 is the Lande g-factor. [2] The variation of remnant magnetization () has given in Table 2. The inset of Fig. 6a shows initially decreases up to 0.1, and after that it increases. This behavior of appears to be connected with competition between site dilution caused by nonmagnetic Ga3+ and mixed ionic states of Ru4+ and Ru5+. The inset of Fig. 6b shows experimentally estimated at 70 kOe with Ga substitution. The observed values of decrease linearly with Ga doping in SrRu1-xGaxO3 series, which are expected from this site dilution.
The nature of magnetic state in SrRuO3 and its evolution with Ga substitution has been checked with Arrott plot which is about plotting of the magnetic isotherm data in the form of vs . [49] The Arrott plot has been constructed using data from Fig. 6a. The significance of the Arrott plot is that positive intercept on axis due to straight line fitting in high field regime gives spontaneous magnetization (). Arrott plot in Fig. 6b shows non-linear behavior with concave nature. However, the straight lines fitted in high field regime give positive intercept for all the samples. From intercept we calculate = 0.846 /f.u. for SrRuO3. With Ga doping, decreases which is again in agreement with dilution of magnetic lattice and has shown in the inset of Fig. 6b.

Further, the Rhodes-Wohlfarth (RW) ratio [50] has been used to understand the itinerant character of magnetism in present series. This ratio is to calculate / while characterizes the number of carriers per magnetic atom and is derived from the PM state, = in which = , and the represents which is the saturated ferromagnetic moment per magnetic atom. It is argued that for / 1, the nature of magnetic interaction would be of itinerant type and the / 1 implies localized nature of magnetic state in a material. For SrRuO3, we obtain = 1.82 and = 1.25, therefore the / ratio (1.46) favors an itinerant magnetic nature. Table 2 shows the / ratio increases with Ga doping which implies that the itinerant ferromagnetic character increases with progressive doping of Ga.
3.7 AC susceptibility measurements
In addition to a prominent peak around , the in the inset of Fig. 2a shows an extra peak at low temperature in doped samples. Considering the fact that present site dilution in SrRu1-xGaxO3 generates magnetic clusters (GP behavior in Fig. 5), these peaks are likely due to freezing of these clusters. To probe the low temperature magnetic state in present series, we have used ac susceptibility () which is an effective tool to understand the nature of magnetic state. [51, 52, 53, 54] Unlike dc magnetization study, the advantage of is that it uses very low magnetic field. Moreover, the dynamic nature of magnetic state can be probed through a variation of measurement frequency () which allows to use different measurement probe time (= ).
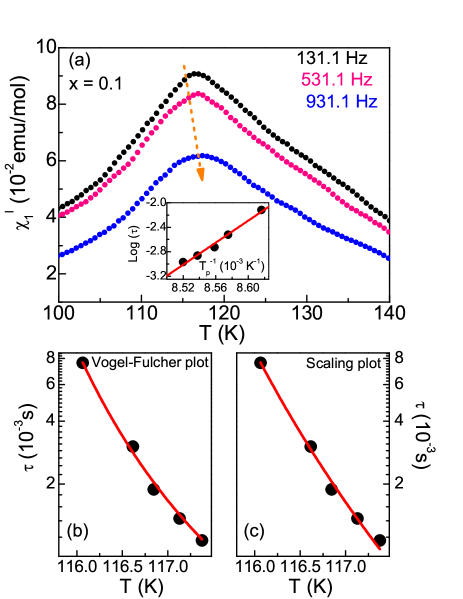
We have measured the for all the samples in temperature range covering magnetic phase transition (80 to 200 K). Figs. 7a and 7b show the real () and imaginary () part of 1st harmonic , respectively measured in an ac field = 2 Oe and = 131.1 Hz. Both and show a distinct sharp peak around of respective samples. The and further show an additional peak for doped materials below where the peak temperatures closely match with those seen in dc magnetization (Fig. 2a). It is remarkable that the temperatures where an additional peak is observed below , substantially agree in case of ac and dc magnetization.
To further understand the origin of low temperature magnetic peak, we have measured both and with varying frequency which allows to probe the system using different time scale. In case of metamagnetic systems such as, spin glass (SG) or super-paramagnets (SPM), the peak temperature () shifts to higher temperature with increasing frequency. [55, 56, 57, 58, 59] Fig. 8a shows an expanded view of around the low temperature peak for = 0.1 sample where the data are shown for selected few frequencies. As evident in figure, with increasing frequency the decreases and the shifts toward higher temperature. While this behavior of is typical of glassy or SPM systems but the shift of in present data is very small. [55, 56] For instance, shifts from 116.06 K to 117.37 K with an increase of frequency from 131.1 Hz to 931.1 Hz. Usually, the frequency response of is quantified with following relation, [55, 58, 60, 61]
| (10) |
where is the difference in respective parameters. In case of glassy and interacting particle systems, the shifting of is very low and the values of is usually obtained in the range of the 0.005 to 0.05. For instance, obtained values of are around 0.005 for canonical spin-glass systems (CuMn, AuMn), [58, 60, 62, 63, 64] 0.008 for short-range FM system U2RhSi3, [65] 0.002 for interacting manganite nanoparticles, etc. [66] On the other hand, a larger value of ( 0.1) is observed for simple SPM systems (i.e., 0.28 for Ho2O3). [60] This suggests an interaction among the magnetic entities gives a low value of . For cluster glass systems, where the locally ordered FM clusters interact and play similar role of single spin as in SG systems, is obtained in an intermediate range. [67] For present SrRu0.9Ga0.1O3, we obtain = 0.013 which is significantly low and close to the value for cluster glass systems. This implies a reasonable interaction among the clusters which induces glassy behavior in the system.
To understand the nature of inter-cluster interactions, we have analyzed the frequency dependent shifting of using different phenomenological models. For an assembly of noninteracting particles/clusters, Nel Arrhennius law predicts relaxation time () as following, [60, 68]
| (11) |
where is the microscopic relaxation time, is the Boltzmann constant and is the average thermal activation energy. The inset of Fig. 8a shows the straight line fitting of vs data following Eq. 11. We obtain the fitting parameters and around 2.1 10-35 Hz-1 and 9017.7 K, respectively which appear to be quite unphysical though the fitting looks very good. [66, 69] For simple SPM relaxation, the comes in the range of 10-8 to 10-13 s. [66] This implies a presence of sizable interaction among the FM clusters. [70] We have further tried to analyze the frequency dependance of using Vogel-Fulcher (VF) law, [60, 71, 72, 73, 74, 75]
| (12) |
This VF law is an improvement of previous Nel Arrhennius law where the parameter (0 ) characterizes the inter-cluster interactions. The VF fitting (Eq. 12) of experimental vs data for = 0.1 sample is shown in Fig. 8b. The fitting yields = 1 10-5 s, / = 20.4 K and = 112.9 K. The high value of implies the strength of interaction is quite significant. Further, appears to be very high. However, similar values of has been observed in cluster-glass like systems such as, Ni2Mn1.36Sn0.64 and Ga2MnCo suggesting the slow spin dynamics in present material is due to inter-cluster interactions. [58, 76, 77]
The dynamical spin nature has been further investigated using conventional scaling law analysis which assumes that the relaxation time is related to spin coherence length . As one approaches the glass transition temperature , the diverges suggesting following power-law behavior, [60, 61, 68, 74]
| (13) |
where is the microscopic relaxation time of fluctuating spins or clusters, is the dynamic scaling exponent and is usual critical exponent related to . The solid line in Fig. 8c represents the best fitting of our experimental data for = 0.1 using Eq. 13. The obtained fitting parameters are = 7 10-12 s, = 5.76 and = 113 K. However, the values of obtained in VF and scaling analysis, show large disagreement. Nonetheless, obtained in scaling analysis lies in the range of typical spin-glass systems i.e., 10-11 - 10-12 s which suggests that the slow spin dynamics is due to presence of interacting clusters, rather than individual clusters. [55, 56, 58, 59] Further, obtained exponent is close to the value for canonical spin-glass systems (i.e., = 5 - 10). [74, 78] It can be mentioned that the value of has been theoretically predicted to be 4 for 3D Ising glass system, but in experimental situation shows a wide variation for different kinds of materials. [79] The fitting as well as obtained values due to scaling law hypotheses (Eq. 13) imply a collective inter-cluster interaction which induces critically slow down spin dynamics. The VF and scaling analysis confirm a cluster-glass like behavior in doped sample which is in agreement with GP behavior.

.

3.8 Electrical resistivity of SrRu1-xGaxO3 series
The electrical resistivity as a function of temperature have been shown in Fig. 9a for SrRu1-xGaxO3 series. The semi-log plotting of for SrRuO3 shows a metallic behavior with very low resistance value in whole temperature range.[1] The for SrRuO3, shows a slope change around its where below , decreases with faster rate which is probably due to reduced spin disorder effect in magnetically ordered state. The Ga doping in present series increases resistivity and induces an insulating state for = 0.1 and above, as seen in Fig. 9a.
Here, it can be mentioned that similar metal to insulator transition (MIT) has been observed SrRu1-zTizO3 series around 0.4. [26] This shows Ga3+ has comparatively stronger effect on the electron transport behavior in SrRuO3 inducing insulating behavior at lower concentration of doping. Given that Ga3+ and Ti4+ causes similar structural modification and both are 3 based nonmagnetic elements. But, Ga3+ has fully filled d-orbitals, and it additionally creates Ru5+ ion. The Ru4+ and Ru5+ has different electron configuration (4 and 4) which will populate orbitals differently. Therefore, whether this stronger effect of Ga3+ on electronic properties is related to mixed charge states of Ru needs to be investigated.
Considering the metallic charge transport for = 0.0 and 0.05 materials (Fig. 9a), we have examined the charge transport mechanism by plotting the resistivity as a function of following conventional Fermi liquid (FL) theory. For SrRuO3, Fig. 9b shows a linear behavior in vs in temperature range from down to 67 K, which confirms a FL behavior in SrRuO3. It is, however, interesting to observe in Fig. 9b that in Ga doped sample (5%), the FL behavior is obeyed in whole temperature range below . Following the deviation from FL behavior at low temperature in SrRuO3, we have further plotted as a function of in inset of Fig. 9b. The linear behavior in figure indicates a non Fermi liquid (NFL) type charge conduction prevails at low temperature between around 70 to 20 K. In contrast, previous studies mostly have shown FL like charge transport at low temperature in SrRuO3 which changes to NFL behavior at high temperature that extends up to . [11, 13, 14, 80, 81, 82, 83] This break down of FL behavior at high temperature has mostly been ascribed to the bad metallic character of SrRuO3 which realized as the shows a linear increase above without any saturation, crossing the Ioffe-Regel limit for conductivity. [14, 84, 1, 10, 11, 12] The increases continuously till temperature as high as 1000 K. [1] In that scenario, the breakdown of FL behavior at low temperature in present study in quite intriguing. This material neither known to be close to any quantum critical point nor it has antiferromagnetic type fluctuations, as in CaRuO3. [85, 86] The NFL behavior is observed at low temperature much below where FM moments are usually firmly ordered due to reduced thermal fluctuations. We understand that this NFL behavior arises due to scattering of itinerant electrons with magnetic moments. In doped sample, where the magnetism is weakened due to substitution of Ga, the FL behavior continues to low temperature. Nonetheless, continuation of FL behavior down low temperature with only 5% of Ga is intriguing.
The nature of in PM state is different for = 0.1 and 0.2 (Fig. 9a) samples in present series. Generally, charge transport mechanism in an insulating state follows Mott’s variable range hopping (VRH) model which is expressed in case of 3-dimensional material as, [87]
| (14) |
where and are the constants. This formula would then be valid for higher doped insulating samples of SrRu1-xGaxO3 series. However, the present samples have reasonable disorder arising from nonmagnetic Ga3+ introduced at active Ru-O channel of charge transport. The Eq. 14 has been further modified by Greaves for disordered materials where a term has been included as prefactor as following, [88]
| (15) |
The accounts for electron-phonon interaction and has following form
| (16) |
where ( 1013 s-1) is an optical phonon frequency, = 1/ is an inverse localization length of the localized states, is the Boltzmann constant, () is the density of states and is the electronic charge. The in Eq. 15 is the measure of disorder present in the system and can be written as
| (17) |
where is constant and has value 19.45 for disordered state. [89, 90] The data are fitted with Eq. 15 for all the samples in high temperature PM range. Figs. 9c and 9d show the fitting of data following Eq. 15 for = 0.0, 0.05 and = 0.1, 0.2 samples, respectively. It is worth to mention here that charge conduction for both metallic and insulating samples can be explained with single model (Eq. 15). The validity of Eq. (15) for charge transport in SrRuO3 has been in early report. [91] The parameters and obtained from fitting in Figs. 9c and 9d are given in Table 3. It is clear in Table 3 that while does not vary appreciably but shows a large increase with Ga doping which signifies the role of disorder in system arising from site dilution.
-
Quantity/Ga(x) 0.0 0.05 0.1 0.2 (m-cm ) 0.037 0.035 0.031 0.003 466 625 15345 243478 0.9 0.95 1.56 0.3 0.28 0.4 (Eq. 20) 3 3.44 4 (Eq. 21) 3.34 4 5.8
3.9 Magnetoresistance Study
The temperature dependent resistivity in presence of magnetic field (80 kOe) has been shown in Fig. 10a for SrRuO3. It is observed in figure that in presence of field the overall feature of does not change, however, the value of (T) decreases in FM state. This indicates that a negative magnetoresistance (MR) in SrRuO3, as observed in other studies. [48, 92] The prominent effect of MR is observed across as the FM transition is broadened in high magnetic field. The magnitude of MR is usually defined as the percentage change in in the presence of magnetic field as,
| (18) |
where and are the resistivity measured in magnetic field and zero field, respectively. The temperature dependent MR have shown in Figs. 10b and 10c for = 0.0, 0.1 and = 0.2 respectively indicates a negative MR for all the materials over the temperature range. For SrRuO3 MR is not substantial but it shows dip around and at low temperature around 50 K that also matches with other study. [48] This is interesting as we find electronic transport deviates from Fermi liquid behavior below around 70 K (Fig. 9b). The negative MR increases substantially for insulating samples = 0.1 and 0.2 material reaches around 5% and 18% respectively at 5 K (Fig. 10c) of SrRu1-xGaxO3 series. This substantial increase of MR at low temperature is probably due to a high insulating state. This material continue to be ferromagnetic and the alignment of spins in field promotes the charge conduction. It can be further noticed in Fig. 10 that MR for both = 0.1 and 0.2 shows a dip around 118 K and 135 K respectively which are the glass transition temperature for both these samples.
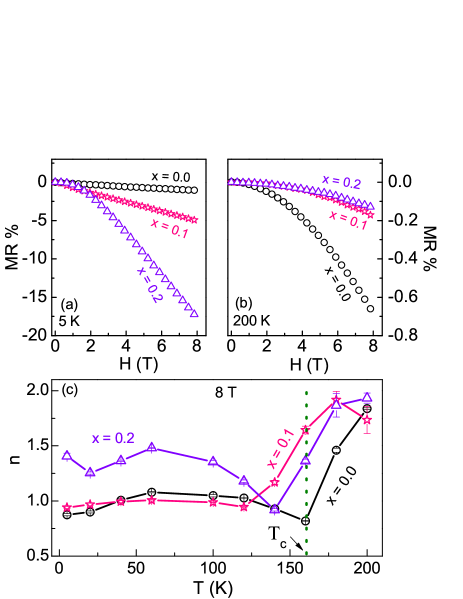
The isothermal MR data at 5 K and 200 K are further plotted in Fig. 11a and 11b respectively where both the temperature represents magnetic and nonmagnetic state, respectively. As discussed above, negative MR at 5 K increases substantially from 1% to 18% with increase of Ga from 0 to 20%. It is further noticeable in Fig. 11a that while SrRuO3 shows almost linear MR with field, a nonlinearity in MR is induced in with increasing Ga doping. This implies that = 0.2 material is largely diluted, therefore, spin alignment induced conduction happens at higher field. Opposed to low temperature behavior, the MR at 200 K decreases with Ga (Fig. 11b). Further, Fig. 11b shows the field dependent MR at 200 K is nonlinear for all the samples.
The non-linearity in MR has been quantified by fitting with following power-law behavior,
| (19) |
where and are the constants and is the power exponent. Fig. 11c shows the exponent with temperature for = 0.0, 0.1 and 0.2 samples. Fig. 11c shows that MR for = 0.0 and 0.1 increases almost linearly ( 1) till , then above the value of increases to 2. The = 0.2 sample, on the other hand, shows higher power dependance of MR on field even at low temperatures. At 200 K in PM state, the MR shows quadratic field dependance for all the materials.

Considering that magnetic ordering has sizable influence on MR behavior, we have plotted the field dependent MR along with data at 5 K. Figs. 12a, 12c and 12e show the combined MR and magnetization data at 5 K for = 0.0, 0.1 and 0.2, respectively. While all the materials exhibit a negative MR, but its nature vary with the effect of site dilution.
For example, MR for parent SrRuO3 increases during first application of magnetic field but when the field is returned back to zero, the MR shows significant hysteresis and remnant value. When the field is switched to negative direction, MR continues to decrease and shows a positive peak at field which roughly coincides with its coercive field (Fig. 12a). With further increase of negative field, the MR increases toward negative direction and exhibits a hysteresis with reversal of field. Important observations are MR exhibits significant hysteresis, a remnant MR at zero field and the positive peaks around coercive fields, where all appear to be connected with the magnetic state of material. The spin alignment with increasing field promotes the charge conduction which results in negative MR. The remnant negative MR is caused by remnant magnetization at zero field which is evident in plot in Fig. 12a. When the field is increased to negative direction, the negative MR decreases and MR shows zero value at field that closely matchs with the .
The slight positive MR immediately after is likely due to effect of field as the moment is close to zero. However, spin alignment with negative field again induces negative MR which explains the hysteresis in MR. With Ga substitution, we observe similar MR behavior for = 0.1 but the hysteresis in MR is reduced.
For = 0.2, hysteresis in MR is reduced and remnant in MR decreases substantially. Instead, MR shows positive value for larger field range close to zero field. This reduced hysteresis and increased positive MR is likely due to magnetic dilution with nonmagnetic Ga.
We have further attempted to establish a direct correlation between MR and magnetization data. With following functional dependence of MR and on field , [93]
| (20) |
where and are the exponents, a direct relationship between MR and M as be obtained as shown below,
| (21) |
In Figs. 12b, 12d and 12f, we have plotted MR vs at 5 K for = 0.0, 0.1 and 0.2, respectively. The data have been fitted with Eq. 21 which yields = 3.34 for SrRuO3. Using Eq. 20, we separately obtain = 0.9 and = 0.3 which implies a ratio = 3 for SrRuO3. The both values obtained from Eqs. 20 and 21 for this series (shown in Table 3) indicate a close matching. Here, it can be mentioned that the negative MR has been shown to scale as ()3 for itinerant FM system MnxTiS2 while for localized moment systems the dependance is quadratic.[94] The present exponent ( 3) for SrRuO3 shows a nice agreement with itinerant system. Further, an increase of exponent with (Table 3) implies an increasing trend of itinerant character in SrRu1-xGaxO3 which also supports the results, as obtained from increasing Rhodes-Wohlfarth ratio (Table 2).
4 Conclusion
Series of polycrystalline samples SrRu1-xGaxO3 with = 0.0, 0.05, 0.1 and 0.2 are prepared using solid state method to understand the complex magnetic and transport properties in SrRuO3. All the samples are characterized with orthorhombic-Pbnm crystal structure. However, the lattice parameters (, and ) progressively decrease with which is due to formation of Ru5+ that has smaller ionic radii compared to Ru4+ and Ga3+. Both the magnetic moment as well as FM decreases with Ga3+ substitution. The analysis of thermal demagnetization at low temperature indicates a coexistence of both itinerant and localized model of magnetization. The estimated magnetic critical exponent indicates a mean-field type magnetization in SrRuO3. The value of increases with Ga that is ascribed to site dilution effect. This site dilution leads to formation of FM clusters which is evident through Griffiths phase like behavior in higher doped samples. The ac susceptibility measurements confirm that a cluster-glass like behavior at low temperature that is also induced by FM cluster formation. A transition from metallic to insulating state is observed between = 0.05 to 0.1. The charge transport behavior in both high temperature PM region of = 0 and 0.05 and in insulating states of = 0.1 and 0.2 is explained by modified Mott’s VRH model. But in FM-metallic state just below ( = 0 and 0.05), the charge transport mechanism mainly follows Fermi-Liquid behavior. At low temperature, a breakdown in FL behavior occurs due to an increased scattering of itinerant electrons by ordered moment. The site dilution effect is also evident in charge transport as doped sample shows FL behavior throughout the FM state.
5 Acknowledgment
We acknowledge UGC-DAE CSR, Indore, Dr. Alok Banerjee and Dr. Rajeev Rawat for the for magnetization and transport measurements. We thank Mr. Kranti Kumar and Mr. Sachin for the help in measurements. We are also thankful to AIRF, JNU and Mr. Saroj Jha for magnetization measurements. We thank DST-PURSE for the financial supports. RG and INB acknowledge the financial support from UGC, India (BSR fellowship) and from CSIR, India (SRF Fellowship), respectively.
References
References
- [1] Allen P B, Berger H, Chauvet O, Forro L, Jarlborg T, Junod A, Revaz B and Santi G 1996, Phys. Rev. B 53, 4393
- [2] Cao G, McCall S, Shepard M, Crow J E and Guertin R P 1997, Phys. Rev. B 56, 321
- [3] Fuchs D, Wissinger M, Schmalian J, Huang C L, Fromknecht R, Schneider R and Lohneysen H V 2014 Phys. Rev. B 89, 174405
- [4] Mazin I I and Singh D J 1997, Phys. Rev. B 56, 2556
- [5] Kim M and Min B I 2015, Phys. Rev. B 91, 205116
- [6] Cheng J -G, Zhou J -S, Goodenough J B, and Jin C -Q 2012, Phys. Rev. B 85, 184430
- [7] Gupta R and Pramanik A K 2017, J. Phys.: Condens. Matter, 29, 115801
- [8] Gupta R, Bhatti I N and Pramanik A K 2018, J. Magn. Magn. Mater., 465, 193-200
- [9] Kim D, Zink B L, Hellman F, McCall S, Cao G, and Crow J E 2003, Phys. Rev. B 67, 100406
- [10] Gurvitch M 1981, Phys. Rev. B 24, 7404
- [11] Klein L, Dodge J S, Ahn C H, Reiner J W, Mieville L, Geballe T H, Beasley M R, and Kapitulnik A 1996, J. Phys.: Condens. Matter, 8, 10111
- [12] Emery V J and Kivelson S A 1995, Phys. Rev. Lett. 74, 3253
- [13] Wang L M, Horng H E, and Yang H C 2004, Phys. Rev. B 70, 014433
- [14] Klein L, Dodge J S, Ahn C H, Snyder G J, Geballe T H, Beasley M R, and Kapitulnik A 1996, Phys. Rev. Lett. 77, 2774
- [15] Maiti K and Singh R S 2005, Phys. Rev. B 71, 161102
- [16] Fujioka K, Okamoto J, Mizokawa T, Fujimori A, Hase I, Abbate M, Lin H J, Chen C T, Takeda Y, and Takano M 1997, Phys. Rev. B 56, 6380
- [17] Wang L et. al. 2018, Nat. Mater. 17, 1087
- [18] Ohuchi Y et. al 2018, Nat. Commn. 9, 213
- [19] Yamaura K, Young D P, and Takayama-Muromachi E 2004, Phys. Rev. B 69, 024410
- [20] Dabrowski B, Kolesnik S, Chmaissem O, and Maxwell T, Avdeev M, Barnes P W, and Jorgensen J D 2005, Phys. Rev. B 72, 054428
- [21] Kasinathan D and Singh D J 2006, Phys. Rev. B 74, 195106
- [22] Qasim I, Kennedy B J and Avdeev M 2013, J. Mater. Chem. A 1, 13357
- [23] Biswas A, Lee Y W, Kim S W, and Jeong Y H 2015, J. Appl. phys. 117, 115304
- [24] Bianchi R F, Carrio´ J A G, Cuffini S L, Mascarenhas Y P, and Faria R M 2000, Phys. Rev. B 62, 10785
- [25] Jang H, Brendt J, Patro L N, Martin M and Han-Ill Yoo 2014 Phys. Rev. B. 89, 144107
- [26] Kim K W, Lee J S, Noh T W, Lee S R and Char K 2005, Phys. Rev. B, 71, 125104
- [27] Kim J, Kim J -Y, Park B -G, and Oh S -J 2006, Phys. Rev. B, 73, 235109
- [28] Lin Pao-An, Jeng Horng-Tay and Hsue Chen-Shiung 2008 Phys. Rev. B 77, 085118
- [29] Cao G, McCall S, Bolivar J, Shepard M, Freibert F, Henning P, Crow J E, and Yuen T 1996, Phys. Rev. B 54, 15144
- [30] Pi L, Maignan A, Retoux R, and Raveau B 2002, J. Phys.: Condens. Matter, 14, 7391
- [31] Crandles D A, Yazdanian M M, and Razavi F S 2006, J. Appl. Phys., 39, 6
- [32] Maiti K, Singh R S, and Medicherla V R R 2007, Phys. Rev. B, 76, 165128; Maiti K 2008, Phys. Rev. B, 77, 212407
- [33] Rodrguez-Carvajal 1993, Physica B 192, 55
- [34] Galal A, Hassan H K, Atta N F, Abdel-Mageed A M and Jacob T 2019, Scientific reports 9, 7948
- [35] Lin Y, Tian Z, Zhang L, Ma J, Jiang Z, Deibert B J, Ge R, and Chen L 2019, Nature Communications 10, 162
- [36] Klein L, Dodge J S, Geballe T H, Kapitulnik A, Marshall A F, Antognazza L, and Char K 1995, Appl. Phys. Lett. 66, 2427
- [37] Shepard M, McCall S, Cao G and Crow J E 1997, J. Appl. Phys., 81, 4978
- [38] Miao N, Bristowe N C, Xu B, Verstraete M J and Ghosez P 2014, J. Phys.: Condens. Matter, 26, 035401
- [39] Kittel C 2012, Introduction to Solid State Physics Wiley, New Delhi
- [40] B. Nadgorny, Osofsky M S, Singh D J, Woods G T, Soulen Jr R J, Lee M K, Bu S D and Eom C B 2003, Appl. Phys. Lett. 82, 427
- [41] Raychaudhuri P, Mackenzie A P, Reiner J W, and Beasley M R 2003, Phys. Rev. B 67, 020411
- [42] Perumal A and Srinivas V, Kim K S and Yu S C, Rao V V, Dunlap R A 2002, Phys. Rev. B 65, 064428
- [43] Stanley H E 1971, Introduction to Phase Transitions and Critical Phenomena, Oxford University Press
- [44] Griffiths R B 1969, Phys. Rev. Lett. 23, 17
- [45] Magen C, Algarabel P A, Morellon L, Arajo J P, Ritter C, Ibarra M R, Pereira A M, and Sousa J B 2006, Phys. Rev. Lett. 96, 167201
- [46] Pramanik A K and Banerjee A 2010, Phys. Rev. B 81, 024431
- [47] Castro Neto A H, Castilla G and Jones B A 1998, Phys. Rev. Lett. 81, 3531
- [48] Sow C, Samal D, Anil Kumar P S, Bera A K, and Yusuf S M 2012, Phys. Rev. B 85, 224426
- [49] Arrott A 1957, Phys. Rev., 108, 1394
- [50] Rhodes P and Wohlfarth E P 1963, Proc. R. Soc. Lond. A, 273, 247
- [51] Sinha G and Majumdar A K 1998, J. Magn. Magn. Mater., 185, 18
- [52] Chakravarti A, Ranganathan R, and Bansal C 1992, Solid State Commun., 82, 591
- [53] Bitoh T, Ohba K, Takamatsu M, Shirane T, and Chikazawa S 1996, J. Magn. Magn. Mater., 154, 59
- [54] Suzuki M 1977, Prog. Theor. Phys., 58, 1151
- [55] Lin S, Shao D F, Lin J C, Zu L, Kan X C, Wang B S, Huang Y N, Song W H, Lu W J, Song P, and Sun Y P 2015, J. Mater. Chem. C, 3, 5683
- [56] Bakaimi I, Brescia R, Brown C M, Tsirlin A A, Green M A, and Lappas A 2016, Phys. Rev. B, 93, 184422
- [57] Khurshid H, Lampen-Kelley P, Iglesias O, Alonso J, Phan M -H, Sun C -J, Saboungi M -L, and Srikanth H 2015, Sci. Rep., 5, 15054
- [58] Anand V K, Adroja D T, and Hillier A D 2012, Phys. Rev. B, 85, 014418
- [59] Yu J, Tang S, Wang L, and Du Y 2010, Chem. Phys. Lett., 496, 117
- [60] Mydosh J A 1993, Spin Glass: An Experimental Introduction, Taylor and Francis, London
- [61] Hohenberg P C, and Halperin B I 1977, Rev. Mod. Phys., 49, 435
- [62] Mulder C A M, van Duyneveldt A J, and Mydosh J A 1982, Phys. Rev. B, 25, 515
- [63] Xu Q, Zhou S, Wu D, Uhlarz M, Tang Y, Potzger K, Xu M, and Schmidt H 2010, J. Appl. Phys., 107, 093920
- [64] Maji B, Suresh K G, and Nigam A K 2011, J. Phys.: Condens. Matter, 23, 506002
- [65] Li D X, D¨onni A, Kimura Y, Shiokawa Y, Homma Y, Haga Y, Yamamoto E, Honma T, and Onuki Y 1999, J. Phys.: Condens. Matter, 11, 8263
- [66] Pramanik A K and Banerjee A 2010, Phys. Rev. B, 82, 094402
- [67] Chakrabarty T, Mahajan A V, and Kundu S 2014, J. Phys.: Condens. Matter, 26, 405601
- [68] Binder K, and Young A P 1986, Rev. Mod. Phys., 58, 801
- [69] Peddis D, Rinaldi D, Ennas G, Scano A, Agostinelli E, and Fiorani D 2012, Phys. Chem. Chem. Phys., 14, 3162
- [70] Gatteschi D, Sessoli R, and Villain J 2011, Molecular Nanomagnets Oxford University Press, Oxford
- [71] Vogel H 1921, Phys. Z., 22, 645
- [72] Fulcher G S 1925, J. Am. Ceram. Soc., 8, 339
- [73] Tholence J L 1980, Solid State Commun., 35, 113; 1980, J. Appl. Phys. 50, 7310; 1981,Physica B 108, 1287
- [74] Souletie J, and Tholence J L 1985, Phys. Rev. B, 32, 516(R)
- [75] Shtrikman S and Wohlfarth E 1981, Phys. Lett. A, 85, 467
- [76] Chatterjee S, Giri S, De S K, and Majumdar S 2009, Phys. Rev. B, 79, 092410
- [77] Samanta T, Bhobe P A, Das A, Kumar A, and Nigam A K 2018, Phys. Rev. B, 97, 184421
- [78] Fischer K H and Hertz J 1991, Spin Glasses Cambridge University Press, Cambridge
- [79] Binder K and Young A P 1984, Phys. Rev. B, 29, 2864
- [80] Tyler A W, Mackenzie A P, NishiZaki S, and Maeno Y 1998, Phys. Rev. B, 58, 10107(R)
- [81] Hussey N E, Mackenzie A P, Cooper J R, Maeno Y, Nishizaki S, and Fujita T 1998, Phys. Rev. B, 57, 5505
- [82] Bruin J a N, Sakai H, Perry R S, and Mackenzie A P 2013, Science, 339, 804
- [83] Schneider M, Geiger D, Esser S, Pracht U S, Stingl C, Tokiwa Y, Moshnyaga V, Sheikin I, Mravlje J, Scheffler M, and Gegenwart P 2014, Phys. Rev. Lett. 112, 206403
- [84] Ziese M, Vrejoiu I, and Hesse D 2010, Phys. Rev. B, 81, 184418
- [85] Longo J M, Raccah P M and Goodenough J B 1968, J. Appl. Phys., 39, 1327
- [86] Cao G, Korneta O, Chikara S, DeLong L E, Schlottmann P 2008, Solid State Commun., 148, 305-309
- [87] Mott N F 1949, Proc. Phys. Soc. London Sect. A 62, 416; Mott N F 1990, Metal-Insulator Transitions Taylor and Francis, London; Mott N F and Davis E A 1979, Electronic Processes in Non-Crystalline Materials Oxford University Press, Oxford; Mott N F 1969, Philos. Mag. 19, 835
- [88] Greaves G N 1973, J. Non Cryst. Solids 11, 427
- [89] Sakata H, Sega K, Chaudhari B K 1999, Phys. Rev. B, 60, 3230
- [90] Dutta B, Fahmy N A, Pegg I L 2005, Phys. Rev. B, 351, 1958
- [91] Kurnia F, Tambunan O T, Lee B, Choi J, Cho J, Park B H, Shim S B, Kim J, Ji-Yong Park and Jung C U 2013, J. Phys. Soc. Jpn., 82, 013706
- [92] Morn O, Saldarriaga W, Baca E, Hott R, Fuchs D 2009, Solid State Sciences, 11, 700-705
- [93] Nath T K and Majumdar A K 1998, Phys. Rev. B 57, 10655
- [94] Negishi H, Yamada H, Yuri K, Sasaki M, and Inoue M 1997, Phys. Rev. B 56, 11144