∎
Reference Database for Photon Strength Functions
Abstract
Photon strength functions describing the average response of the nucleus to an electromagnetic probe are key input information in the theoretical modelling of nuclear reactions. Consequently they are important for a wide range of fields such as nuclear structure, nuclear astrophysics, medical isotope production, fission and fusion reactor technologies. They are also sources of information for widely used reaction libraries such as the IAEA Reference Input Parameter Library and evaluated data files such as EGAF.
In the past two decades, the amount of reaction gamma-ray data measured to determine photon strength functions has grown rapidly. Different experimental techniques have led to discrepant results and users are faced with the dilemma which (if any) of the divergent data to adopt.
We report on a coordinated effort to compile and assess the existing experimental data on photon strength functions from the giant dipole resonance region to energies below the neutron separation energy. The assessment of the discrepant data at energies around or below the neutron separation energy has been possible only in a few cases where adequate information on the model-dependent analysis and estimation of uncertainties was available. In the giant dipole resonance region, we adopt the recommendations of the new IAEA photonuclear data library. We also present global empirical and semi-microscopic models that describe the photon strength functions in the entire energy region and reproduce reasonably well most of the experimental data.
The compiled experimental photon strengths and recommended model calculations are available from the PSF database hosted at the IAEA (URL:www-nds.iaea.org/PSFdatabase).
1 Introduction
Photon strength functions (PSFs) describe the average response of the nucleus to an electromagnetic probe. They are important quantities for the theoretical modelling of nuclear reactions. The PSF describing both the photoexcitation and deexcitation of the atomic nucleus by -ray absorption or emission plays a key role in all kinds of nuclear reactions where the electromagnetic interaction may compete with the strong or weak interactions. As a consequence, PSFs are also relevant sources of input information for other databases such as the photonuclear data library Photo00 , the Reference Input Parameter Library (RIPL) Capote09 , evaluated data files such as Evaluated Gamma Activation File (EGAF) EGAF , Evaluated Nuclear Structure and Decay File (ENSDF) ENSDF , and transport files in ENDF-6 format Trkov11 , which are supported by the International Atomic Energy Agency (IAEA). The concept of PSF stems from statistical physics and is based on the assumption that at high excitation energies the number of excited states, hence the nuclear level densities (NLDs), is high enough, so that the nuclear decay properties can be treated statistically. In this respect, the PSF describes the average probability to absorb or emit a -ray of a given energy . Reaction theory relates the PSF to the photoabsorption cross section that is known to be dominated by the electric dipole () radiation, at least in the high -ray energy region of 10–20 MeV characterizing the well-known Giant Dipole Resonance (GDR) Photo00 ; Harakeh01 . Outside this energy region, especially below the particle separation energies, the magnetic dipole () contribution may become significant.
Most of the PSF studies, be it experimental or theoretical, make the assumption that the average electromagnetic decay process (i.e. the photo-deexcitation) can be directly related to the inverse photoexcitation and essentially depends only on the energy of the emitted -ray, and not on the absolute excitation energy of the initial or final states, or the specific nuclear properties (such as the spin and parity) of the nuclear states involved. This assumption is known as the Brink-Axel hypothesis Brink55 ; Axel62 that has played a key role in the description of the photo-deexcitation process, especially in reaction theory. While the Brink-Axel hypothesis is well established in the GDR energy region, at low energies, in particular below the neutron threshold, its validity is still open to debate and is under both theoretical as well as experimental investigation. For example, theoretically studies within the Fermi liquid theory Kadmenskii83 have found that photo-deexcitation PSF, traditionally denoted as , is a function of the excitation energy of the final state, which in turn depends on the excitation energy of the initial state and the -ray energy . In contrast, the photo-excitation process, with the PSF denoted as , only depends on the -ray energy. At low excitation energies, such a temperature effect in the photo-deexcitation PSF was shown to be rather small Plujko99 , so that, in this energy regime, . Experimentally, the Brink-Axel hypothesis was investigated and shown to be valid to a good approximation, for -ray transitions between states in the quasicontinuum region below the particle separation energy, from a variety of experiments, including those measuring average intensities of primary transitions from (n,) Bollinger67 ; Bollinger70 , (p,) Szeflinska79 ; Szeflinski83 ; Erlandsson79 , and (,) reactions Alarcon87 , or using data from two-step cascades Krticka04 or charged-particle-induced reactions Guttormsen11 ; Guttormsen16 ; Martin17 . However, different experimental studies exploiting the photon scattering (,) technique have found indications that the Brink-Axel hypothesis is at least partially violated below the neutron separation energy (see e.g. Angell12 ; Isaak13 ), including novel methods, using a combination of quasi-monochromatic photon beams and a coincidence setup which allows for the simultaneous determination of the photo-absorption and photo-deexcitation PSFs Isaak19 .
As already mentioned above, a large number of experiments have been devoted over the past decades to unraveling the electromagnetic response of the atomic nucleus providing a wealth of information on the total PSFs and the relative contributions of the various components of given multipolarities () and types (electric or magnetic, or ). Starting from the early 60s, significant effort was made to study PSFs using particle reactions such as (p,), (d,p) and other charge-exchange reactions. A comprehensive review of all this work was published by Bartholomew et al. Bartholomew73 which sets the principles of the method for extracting PSFs from charged-particle-induced reactions. Ref. Bartholomew73 also describes additional techniques yielding information on PSFs including (,) and (n,) measurements. Significant contribution from the (n,) reaction came from analysis of primary transitions following the decay of neutron resonances. Information on PSFs from these experiments were later detailed in Ref. Kopecky90 . Subsequently, a series of coordinated international efforts to develop reliable PSFs for reaction modelling on the basis of all the available experimental information at the time, were conducted at the IAEA. The recommended PSFs (generically denoted as ) for both the photoexcitation and photo-deexcitation processes were included in RIPL Capote09 which has been widely used by the scientific community. In the past two decades, there has been considerable growth in the amount of reaction data measured to determine integrated PSFs using photon, neutron and charged-particle beams, with each method probing different or overlapping energy ranges and revealing interesting phenomena such as pygmy resonance strength, scissors mode, and low-energy strength enhancement, often referred to as “upbend”. Quite often the different experimental techniques used to extract PSFs lead to discrepant results and users are faced with the dilemma of trying to decide which (if any) amongst the divergent data they should adopt. It is therefore important that all these experimental data are compiled and assessed by experts who would then recommend the most reliable data for use in the various applications.
To address these growing needs in PSFs, the IAEA held a consultants’ meeting where experts reviewed the experimental methods and currently available PSF data Dimitriou13 , and recommended a coordinated effort to compile, assess and make recommendations to the user community. As a result, the IAEA organised a Coordinated Research Project (CRP) on “Generating a Reference Database for Photon Strength Functions” (2013-2019) Dimitriou15 ; Dimitriou18 . The objective of the project was to create a dedicated database for PSFs at relatively low excitation energies (typically below 30 MeV) which would include all available experimental data, a critical analysis of the discrepant data and recommendations to user community supported by global theoretical calculations. Three meetings were held during the CRP to monitor progress and revise the assignments in order to achieve the final objective Goriely16a ; Goriely18c ; Wiedeking19 . The scope of the CRP included the following activities:
-
•
measurements,
-
•
compilation of existing data,
-
•
assessment and recommendation of data,
-
•
global theoretical calculations,
-
•
comparison of models with the bulk of data,
-
•
dissemination through an online data library.
In the present review paper we report on the work that was performed and the results that were obtained for all the above items. Specifically, Sec. 2 includes a description of the various experimental methods sensitive to PSFs and used to extract or test PSFs. Sec. 3 shows how, for each of the experimental methods, the PSFs have been assessed and extracted to be included in the final PSF library. Statistical and systematic uncertainties are also discussed in Sec. 3 in view of existing discrepancies between different experimental techniques. Sec. 4 provides theoretical recommendations for a detailed and large-scale description of the dipole and strength functions. Two different theoretical approaches are considered, namely the phenomenological Lorentzian-type model and the more fundamental semi-microscopic quasi-particle random phase approximation (QRPA). A detailed comparison between experiments and theory is presented in Sec. 5. Such a comparison allows us to test systematically the recommended models and validate their predictive power in the various energy regions of interest in applications, namely in the zero-energy limit, below the particle separation energy and in the GDR regime. Finally, in Sec. 6, the IAEA PSF database (URL: www-nds.iaea.org/PSFdatabase), including both experimental data (Sec. 6.1) and theoretical predictions (Sec. 6.2), is described and final recommendations are given. Both recommended PSF models are also compared for exotic neutron-deficient and neutron-rich nuclei in Sec. 6.3. Conclusions are drawn in Sec. 7.
2 Experimental methods
Many experimental techniques have been used to obtain information on PSFs which are included in the database described in Secs. 3 and 6. This section gives a short description of those experimental methods as well as other techniques that were used to verify the PSF models (see Secs. 5).
2.1 Nuclear Resonance Fluorescence
Photon scattering from nuclei, also called nuclear resonance fluorescence (NRF), is a suitable tool to study dipole PSFs below the neutron-separation energy. Nuclear states are excited from the ground state via absorption of dipole () and, to a lesser extent, quadrupole () photons. NRF experiments aim at the determination of the photoabsorption cross section on an absolute scale. The PSF is connected with via the relation
| (1) |
with , where and are the spins of the ground and the excited states, respectively, and corresponding to for states with specific spin and parity . In photon scattering, the energy-integrated scattering cross section of an excited state at an energy can directly be deduced from the intensity of the respective transition to the ground state:
| (2) |
Here, denotes the intensity of a considered ground-state transition at , observed at an angle relative to the beam direction. describes the angular distribution of this transition. The quantity is the areal density of the atoms in the target and stands for the photon flux through the target area at the energy of the considered level.
Spins of excited states can be deduced by comparing ratios of -ray intensities, measured at two angles, with theoretical predictions. The optimum combination comprises angles of 90∘ and 127∘ because the respective ratios for the spin sequences and in even-even nuclei differ most at these angles. The parities of excited states can be derived from the polarizations of the ground-state transitions from experiments using polarized -beams or Compton polarimeters.
The integrated scattering cross section is related to the partial radiative width of the ground-state transition according to
| (3) |
where is the total radiative width of the excited level. The partial radiative width is proportional to the reduced transition strength of a ground-state transition. These reduced transition strengths can be deduced from spectra including well-isolated transitions from low-lying states and have been the basis for the study of phenomena appearing up to excitation energies of about 3 MeV, such as couplings of quadrupole and octupole states Kneissl06 and the scissors mode Heyde10 .
In experiments with high-energy beams, the determination of the absorption cross section and consequently the PSF is complicated by the following problems. First, a high-lying excited state can deexcite to low-lying excited states (inelastic scattering) in addition to the direct deexcitation to the ground state (elastic scattering). In the case of inelastic scattering, inelastic and subsequent cascade transitions appear in the measured spectrum in addition to ground-state transitions. To deduce the absorption cross section from the elastic scattering cross section, which is proportional to the measured intensity, one needs to know the branching ratio of the ground-state transition: . This branching ratio is also needed, if one is interested in the partial radiative width of a ground-state transition to deduce or transition strengths. The branching ratio appears as the quantity in Eq. 3.
In experiments using quasi-monoenergetic photons, which have mainly been performed at the High-Intensity -ray Source (HIS) Weller09 of the Triangle Universities Nuclear Laboratory (TUNL) in Durham, the branching ratios may be estimated from the intensities of the ground-state transitions in the excited energy window and the intensities of the transitions depopulating the lowest-lying states ( states in even-even nuclei), which collect the intensities of most of the inelastic transitions Tonchev10 ; Massarczyk14 . Alternatively, coincidence measurements performed at HIS have been used to determine relative branching ratios , where denotes an inelastic transition (see, for example Refs. Loeher16 ; Wilhelmy18 ).
In experiments using broad-band bremsstrahlung up to high energy, such as the ones performed at the ELBE facility Schwengner05 of the Helmholtz-Zentrum Dresden-Rossendorf (HZDR), a great number of levels is excited in a wide energy range. The inelastic transitions from high-lying levels can feed a considered level well below the end-point energy of the bremsstrahlung, which is a further complication. In the case of such a feeding, the measured intensity of the ground-state transition is greater than the one resulting from a direct excitation only. As a consequence, the integrated scattering cross section deduced from this intensity contains a portion originating from feeding in addition to the true integrated scattering cross section , (Eq. 3). The problem of feeding can partly be solved by measuring at several bremsstrahlung end-point energies and considering transitions close to the respective end-point energies only. An alternative is the estimate of intensities of inelastic transitions using codes for the simulation of statistical cascades, namely MCGCS Rusev08 and DEX Massarczyk12 , which are analogous to the DICEBOX code Becvar98 ; Krticka19a used mainly for neutron-capture reactions.
In experiments that populate states at high excitation energy and therefore high level density, a number of weak transitions may not be resolved, but they rather form a quasicontinuum. To take into account the full intensity of all transitions in the determination of the cross sections, various attempts have been made to estimate the intensity in the quasicontinuum, which has to be separated from the intensity appearing from atomic scattering processes in the target. This “atomic background” can for example be simulated using codes in GEANT4 Agostinelli03 and subtracted from the experimental spectrum. The remaining nuclear spectrum including resolved peaks and quasicontinuum is then used for further analysis. Such analyses are described for example in Refs. Rusev08 ; Massarczyk12 for experiments with bremsstrahlung at the ELBE facility and in Refs. Tonchev10 ; Massarczyk14 for experiments with quasi-monoenergetic beams at the HIS facility.
2.2 The Oslo method
The Oslo method is a technique which allows for the simultaneous extraction of the NLD and PSF from particle- coincidence data and is described in detail in Ref. Schiller00 . This method probes the PSF below the neutron separation energy.
Until recently, all experiments have been performed at the Oslo Cyclotron Laboratory (OCL) using proton, deuteron, 3He or alpha beams on isotopically-enriched targets and the experimental setup at OCL. There, the energy of the outgoing charged particles are measured with the Silicon Ring particle-detector array Guttormsen11 which can be placed in forward or backward angles with respect to the beam direction. The emitted -rays are measured with the CACTUS array Guttormsen96 , consisting of 28 collimated 5" by 5" NaI(Tl) detectors and more recently with the upgraded OSCAR array consisting of 30 large-volume (89 mm x 203 mm) LaBr3:Ce detectors.
The particle- coincidence data are sorted into a matrix of initial excitation energy versus -ray energy . For each excitation energy bin the -ray spectra are unfolded Guttormsen96 using the response functions of the detectors. From these unfolded -ray spectra, the distribution of primary -rays was obtained for each excitation energy bin by means of an iterative subtraction technique, known as the first-generation method Guttormsen87 . Here, the main assumptions are that the Brink hypothesis Brink55 is valid and that the -decay routes from a given excitation energy are independent on whether it was populated directly in the reaction, or through -ray decay from above-lying states (see Ref. Larsen11 for a discussion on the uncertainties for the subtraction technique).
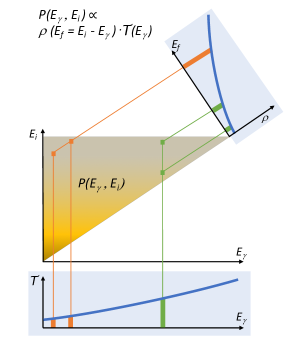
The NLD at the excitation energy and the total -ray transmission coefficient, (assuming dipole transitions dominate), are related to the primary -ray spectrum by
| (4) |
as also illustrated in Fig. 1, where the energy distribution of the first-generation -transitions is shown. Since no -rays are emitted with energy larger than the initial excitation energy, the matrix appears as a triangle. The landscape is assumed to be described by the product of the level density and the transmission coefficient. Thus, one value for the level density (orange) is based on the values of the transmission coefficient in a certain -ray energy range. Analogous, one value of the transmission coefficient (green) is determined by the NLD in a corresponding excitation-energy range. and are extracted with a fit Schiller00 yielding the unique solution of the functional shape of and . Furthermore, a normalization to known experimental level data is performed to establish the correct slope and absolute values of the NLD and total dipole PSF.
The extraction is limited to the and the excitation energy region of the primary -ray matrix where the decay is assumed to be statistical. The NLD is normalized by comparing with the known discrete levels at low excitation energy, and then by extrapolation using a constant temperature (CT) form Gilbert65 from the highest excitation energy deduced from the Oslo method to the neutron separation energy . The NLD at is determined from the average neutron resonance spacing and the spin cutoff parameter in a process detailed in Ref. Schiller00 . The transmission coefficients are normalized to the average total radiative width of neutron resonances, as described in Ref. Voinov01 , and converted to the total dipole PSF , which includes both the and contributions, by
| (5) |
in Eq. 5, is a special case of the more general , since in this method dominance is assumed and cannot be distinguished, therefore what is measured is the sum . In cases where and/or are not available, systematics from a suitable mass region or neighboring nuclei is often used, see for example Refs. Brits19 ; Kheswa17 ; Larsen16 .
Recently, the Oslo method has been further developed to allow for the study of the NLDs and PSFs in more neutron-rich nuclei, either via the analysis of experimental data following beta-decay, the so-called beta-Oslo method Spyrou14 ; Spyrou17 ; Larsen18 or using inverse kinematic reactions Ingeberg16 . It is important to note that both of these newly developed methods measure particle- coincidences and use these coincidences to obtain excitation energy versus -ray energy matrices to which the Oslo method is applied.
2.3 Neutron resonance capture data
During the 1960’s-1990’s the resonance behaviour of neutron interaction with matter was studied in many laboratories worldwide using both, the white neutron spectra and time-of-flight (TOF) techniques, allowing to measure properties of individual neutron resonances. A significant fraction of these studies measured -ray spectra that were primarily used as a spectroscopy tool for determining properties of neutron resonances as well as levels at low-excitation energy of the residual nuclides. However, in some cases, the -decay properties of different radiation types were exploited for obtaining information on in the range between and or 3 MeV.
The compound nucleus mechanism for neutron capture is a dominant process up to several MeV of incident neutron energy. Therefore, the statistical model is generally used to describe -ray decay at these energies. An exception to this can occur in thermal or resonance capture in certain mass regions, where non-statistical processes may become important.
The derived data are based on the experimental determination of the partial radiative width from measured primary -ray intensities. Two types of experiments are usually considered, i) the capture on isolated resonances using TOF spectrometry, known as the Discrete Resonance Capture (DRC), and ii) the average resonance capture (ARC) with filtered neutron beams. Three filter materials, 10B, 45Sc or 56Fe, have been used for ARC experiments. The beams are produced by transmission through filter materials, which yield neutron beams with bell-shaped energy distributions at mean neutron energies of about 150 eV, 2 keV and 24 keV, respectively. The boron-filtered beam primarily removes the thermal component, while Sc and Fe yield quasi-monoenergetic beams of a 1–2 keV width as a result of the presence of a maxima in the transmission of neutrons through these elements/isotopes. Such facilities were built in four laboratories in the US, namely Argonne National Laboratory (ANL), the National Bureau of Standards, the Idaho Nuclear Engineering Laboratory INEL and Brookhaven National Laboratory (BNL) between 1970 and 1980. Three other laboratories, IAEP/PPEI Obninsk (Russia), Kiev (Ukraine) and KFK Karlsruhe (Germany), have also published ARC data. The majority of all adopted data originates from BNL due to its high neutron fluence and efficient processing tools.
Common to all these experiments is the necessity to average over Porter-Thomas fluctuations Porter56 which are expected to govern the distribution of partial radiative widths. In the DRC experiments the differential data are numerically averaged over measured isolated resonances to decrease the influence of these Porter-Thomas fluctuations, while in the ARC experiments the averaging is inherent in the experiment since what is measured is the capture on neutron resonances present in the filtered beam neutron window. The DRC are given in the absolute PSF scale and can be used for the absolute normalization of the ARC data (which are in all cases given only in relative units).
The individual strength corresponding to primary transitions from resonances with a given parity to individual final levels with the same parity connected via transitions of type, , was determined for a number of different energies as
| (6) |
where is a partial radiation width of a transition with corresponding to the energy difference between the initial state and a final level . The symbol stands for unweighted averaging over included resonances and is the - or -wave resonance spacing for resonances with given spin and parity. The spread of individual values is assumed to be primarily but not complete suppression of the Porter-Thomas fluctuations, or other effects such as -wave contributions, and is taken care of in the data processing Kopecky16 ; Kopecky17 ; Kopecky17b ; Kopecky18 .
In order to increase the statistical accuracy of DRC data, the averaged quasi-monoenergetic strength function was introduced, involving an additional averaging step, and was implemented in all the previous compilations McCullagh79 ; McCullagh81 ; Kopecky94 . The average is applied over a selected number of primary transitions in the narrow energy region, neglecting the additional energy dependence above the phase factor of partial widths. For an energy range of about 1 MeV, this is an acceptable assumption. The average strength function can therefore be expressed as
| (7) |
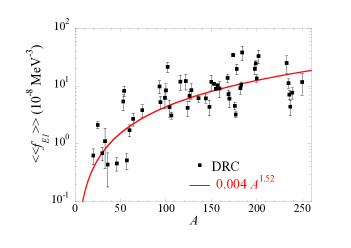
where is an unweighted mean over the used primary transitions and included resonances. Eq. 7 is valid for both DRC and ARC data, though the averaging over resonances is implicit in the experimental process in the ARC case but needs to be performed explicitly in the DRC case. These estimates of obtained from DRC are then used in the absolute normalization of the ARC data. In order to have such information also for nuclides without available DRC measurements, mass-dependent systematics (as power function of ) have been derived for both and transitions. The case of the radiation (used for normalization) is shown in Fig. 2. The absolute majority of data lies between MeV, except for the low-mass and actinide nuclides. The least-square-fit based on a power dependence on the mass leads to the following systematics for the and PSFs
| (8) | |||
| (9) |
where the measure of the goodness of the fit can be estimated as for the and 0.13 for the . More details can be found in Refs. Kopecky17 ; Kopecky17b .
2.4 Primaries from thermal neutron capture
Thermal/cold neutron beams are produced by nickel lined guides that transport the neutrons to low-background counting stations far from the neutron source. If the guides are curved, no fast neutrons and -rays coming from the source reach the target area. At the Budapest reactor facility, where many experiments have been performed, cold and thermal neutron beams are transported to the Prompt Gamma-ray Activation Analysis (PGAA) target station approximately 35 m from the reactor wall Rosta02 . A similar experimental configuration has been constructed at the Garching FRM-2 reactor Revay15 .
Gamma rays following decay of the thermal neutron capture are measured with the help of semiconductor detectors and relative -ray intensities per neutron capture can be often deduced from these measurements. At the Budapest reactor, the relative intensities are obtained from a comparison to known absolute cross sections of individual transitions – that are obtained using stoichiometric compounds or mixtures containing -ray cross section standards such as H, N, Cl, S, Na, Ti, or Au Revay03 – and from the thermal cross sections for (n,) reactions. The partial -ray cross section values have been compiled in the EGAF library EGAF ; Firestone14 for all elements with , 90, 92 except for He and Pm.
In nuclei with sufficiently high level density, the total radiative width of individual neutron resonances show very small fluctuations. Relative -ray intensities per neutron capture can thus be converted to partial radiative widths to individual final levels via . Partial radiative widths of primary transitions can be used to obtain information on PSFs similarly as in the DRC approach. The difference between the DRC data and thermal neutron capture is that in the latter the averaging can be done only for different final levels in a selected range , but not over different initial resonances. It means that the individual values are obtained only from a single value of and not from averaging indicated by in Eq.7.
Absence of averaging over different resonances leads to smaller suppression of the Porter-Thomas fluctuations than in the case of DRC/ARC data. In addition, these fluctuations prevent observation of primary transitions to all levels in the range and a correction for unobserved transitions has to applied. This correction can be done under the assumption that the observed transitions are the strongest ones in the energy range and that the number of final levels accessible via transitions of type in this range is known. However, as thermal/cold neutron capture proceeds purely via -wave neutrons, the capturing state has a unique parity and the types of primary -rays populating final levels of known spin and parity can be directly inferred.
2.5 Average resonance proton capture
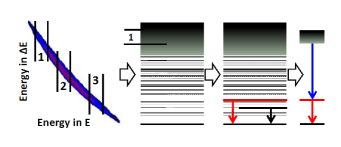
Measurements from (p,) reactions to deduce the PSFs are similar to the ARC method introduced in Sec. 2.3 where many different resonances are populated in the capture reaction. Using high-resolution -ray detectors to detect -rays deexciting these resonances allows one to identify the primary transitions connecting to low-lying final levels. There are also similarities between the extraction of data from (p,) measurements and from those in the Ratio method shown in Fig.3. However, for (p,) reactions the excitation-energy is determined by the proton beam energy.
The measurements were typically performed for proton energies ranging between 1 and 4 MeV. The number of resonances in each measurement is usually determined by the thickness of the target. Typically, targets that cause keV energy loss of the incoming proton energies were used. The proton energy loss in the target also determines the width of the line observed in the detector. The excitation energy resolution limits the applicability of the method to nuclei for which the spacing of individual final low-lying levels is at least several tens of keV. Another factor that needs to be considered is that with an increasing Coulomb barrier, (p,) cross sections decrease. Hence, the method is suitable for nuclei with for which (p, cross sections can be measured with good statistics. On the other hand, the need for sufficiently high NLD in the resonance region to suppress expected Porter-Thomas fluctuations of individual transition intensities requires that nuclei with masses are used. Another factor to consider is that the method works when the neutron separation energy in the product nucleus is much higher than the proton separation energy, i.e. for nuclei such that , where is the maximum proton energy.
To suppress the influence of the Porter-Thomas fluctuations, the average intensities of primary transitions to a specified final low-lying level were extracted for proton energies within (typically) MeV wide interval. Intensities of transitions to the same final level were summed together for all proton energies in the range and this sum of intensities was attributed to the energy at the middle of the range. Using transitions to levels with the same spin and parity, the relative dependence of the PSFs was thus obtained; for details see Refs. Szeflinska79 ; Erlandsson79 .
Levels of different spins have often been considered. However, to get the same normalization of data sets for different spins, a correction is needed for feeding from resonances with different spins. These different contributions were usually calculated within the Hauser-Feshbach formalism. Absolute normalization of measured intensities to the PSF is determined from a comparison of measured cross sections for the direct population of selected low-lying states (one or a few) using the Hauser-Feshbach calculations; the -ray transmission coefficient (for a single -ray energy) was the only quantity in the simulation of the cross section which was assumed to be unknown and its value needed for reproducing the cross section yielded the absolute PSF Szeflinska79 ; Erlandsson79 . Obtained PSF values correspond to the total dipole PSF .
2.6 The Ratio method
The Ratio method Wiedeking12 is a model-independent approach to obtain the energy dependence of the PSF. The method relies on the detection and extraction of correlated particle-- events from reactions for which the excitation energy of the residual nucleus can be experimentally determined. Charged particles and their energies are detected in particle detectors (e.g. silicon particle telescopes Wiedeking12 , phoswhich detectors Jones18 or similar) and their kinematics and knowledge of energy losses allows for the determination of the excitation energy of the residual nucleus which is produced in the reaction.
The -rays are detected with high-resolution, high-purity Germanium detectors, possibly in combination with high-efficiency detectors, such as LaBr3:Ce. Only events for which the energy sum of the two detected -rays, one of them being the primary transition feeding a well resolved low-lying level from and the second transition originating from a known decay of a low-lying level, equals to the initial energy within the energy resolutions of the detectors are considered in the subsequent analysis, see schematic sketch in Fig.3. Any particle-- event satisfying these conditions provides an unambiguous determination of the origin and destination of the observed primary transition, as shown schematically in Fig.3. The data is extracted on an event-by-event basis and each -ray transition is corrected for their efficiency as well as for the branching ratio in the case of transitions from discrete states. The Ratio method can be applied as long as the primary -ray transitions feed discrete states of the same spin and parity and is independent of model input and eliminates systematic uncertainties.
The energy dependence of the PSF is obtained from the ratio of intensities for two different primary -ray energies from the same initial excitation energy to discrete low-lying levels of same spin and parity at energies and as
| (10) |
Data on primary -ray intensities of transitions from an excitation energy bin to different discrete levels can be used to obtain the dependence in a broad energy range by a minimization procedure Wiedeking12 ; Krticka16 ; Jones18 . Data corresponding to different spins and parities of final low-lying levels can be normalized in the same way. The absolute value of the PSF must be determined independently and an attempt to normalize relative PSF values to that from the (,n) reaction was made in Ref. Krticka16 .
2.7 Inelastic proton scattering
Inelastic proton scattering experiments, i.e. (p,p′) reactions, with polarized proton beams at energies of 295 MeV have been recently performed at the Research Center for Nuclear Physics (RCNP) at Osaka University (Japan). The energy distribution of scattered protons is measured with the high-resolution GRAND RAIDEN magnetic spectrometer at various forward laboratory angles, typically between and . The measured spectra provide information on the electromagnetic excitation probability of a nucleus from the ground state to excitation energies in the range of approximately MeV.
The contribution of and transitions to this process can be separated by two independent methods, using i) polarization transfer observables that can be determined from the measurement of the polarization of scattered neutrons using a carbon polarimeter Tamii09 , and ii) multipole decomposition analysis that exploits the angular distribution of scattered protons Tamii11 ; Poltoratska12 . Both methods give consistent results Martin17 . When separating and transitions using the polarization method, it is assumed that the spin-flip transitions originate from transitions for MeV.
The PSF is obtained from the measured cross section under the assumption that it comes solely from the Coulomb excitation process via a virtual photon Bertulani88 . The cross sections are converted to reduced transition strengths and corresponding photoabsorption cross sections with the approach described in detail in Refs. Birkhan16 ; Mathy17 .
It should be mentioned that only the spin part of the transition operator is expected to play a role in the small-angle proton scattering. Strictly speaking, only part of the PSF is determined. As it is expected that the orbital part of the operator does not significantly contribute to transitions with MeV, the PSF determined in this range should be a very good approximation of the actual PSF. Similar experiments aiming at extracting the spin-flip part of the transitions have been performed previously Frekers90 but the PSFs were not determined.
2.8 Photonuclear data
The dipole PSFs were calculated on the basis of all the experimental data on photoreaction cross sections compiled in the EXFOR database EXFOR . The photoneutron cross sections have been measured as a function of the photon energy by means of monochromatic beams produced predominantly by annihilation-in-flight of positrons (e.g. measurements at the Lawrence Livermore National Laboratory, USA, and the CEA-Saclay, France) as well as using Bremsstrahlung beams (e.g. the experiments at the Max-Planck-Institute for Chemistry (Germany), Melbourne University (Australia), Moscow State University (Russia)). For partial photoneutron reactions, ( ,n), ( ,2n), …cross sections were determined through direct neutron detection and counting of residual -ray activity. Additionally, various methods were used to obtain cross sections with protons in the outgoing reaction channels which are needed for the determination of the total photoabsorption cross section Shoda62 ; Ishkhanov70b ; Varlamov03 . Photoneutron cross sections have also been measured at GDR peak energies and below in experiments based on laser-induced Compton backscattered -rays (e.g. at the NewSUBARU facility of Konan University, Japan). Partial and total photoneutron cross sections have been revised using the experimental-theoretical re-evaluation method of the partial photoneutron reaction cross sections based on objective physical criteria of the data reliability Varlamov14 . It should however be noted that open questions on the determination of the effective neutron detection efficiency, may impact the determination of the photoabsorption cross sections, as discussed in Ref. Banu19 . Details about the adopted photoreaction data, the experimental conditions as well as the recommendation in case of conflicting data (including in particular discrepancies between the Livermore and Saclay data) are given in the CRP review paper on “Updated IAEA Photonuclear Data Library” Kawano19 .
2.9 Additional methods for PSF comparisons
Here we describe some additional methods that do not allow for the extraction of absolute values or energy dependences of the PSF but are sensitive to the PSF and therefore can provide information on the compatibility or validity of existing PSF models.
2.9.1 Singles -ray spectra from (n,) reaction
The validity of various PSF models can be checked using unfolded (or detector response corrected) -ray spectra from (n,) reactions. Predicted spectra can be obtained from any code that can generate a -ray spectrum using the statistical model. Transitions between levels below a critical excitation energy can not be treated in the statistical model, therefore, in these cases the relative intensities of these transitions, which are known experimentally, are adopted. Internal conversion coefficients are also considered, which are importantespecially in heavy nuclei.
The methodology of this testing technique has been reported in Ref. Belgya17 for the 113Cd(n,)114Cd reaction. The data analysis is performed with the statistical model code, Bin Type Simulation (BITS), which uses as input different PSF and NLD models and can only be used with unfolded experimental spectra which are corrected for the detector response function. The method for unfolding the spectra detailed in Ref. Belgya14 is based on the prescription described in Sec. 3.2 of Ref. Bartholomew73 .
The BITS code solves the sequential integration numerically by setting up 100 keV bins from the critical energy up to the separation energy of the daughter nucleus. The number of levels with different spins and parities in the bins is calculated from the corresponding NLD and their summed populations are calculated from thee feeding from the levels in the bins above. The starting level is the capture state with definite spin and parity and is given a population of 1. The program starts with this initial condition and distributes the intensity to final levels or bins using the average decay widths to calculate the electromagnetic branching ratios which are corrected for internal conversion. The sum of the branching ratios is normalized to 1. Repeating the process downwards, in decreasing excitation energy, the decay-scheme is built up and the decay strengths are stored in a decay-scheme matrix of 6 dimensions which are indexed by the initial and final levels and their spins and parities. Below a given critical energy, the experimentally known (discrete) part of the decay scheme of the nucleus is taken into account to describe discrete electromagnetic transitions using internal conversion corrections. The -ray spectrum of full energy peaks is collected from the decay-scheme matrix from which single, two-step and higher multiplicity spectra can also be collected. It is useful to collect spectra versus multipolarities for electric and magnetic types of transitions to learn about their relative contributions. In addition, visual comparison of the calculated and experimental spectra are provided with contributions from the calculated and decays.
2.9.2 Two-step and Multi-step Cascade Spectra
Another method to validate PSFs is via comparison of coincidence -ray spectra with predictions of the statistical model of the nucleus. Two different experimental setups are used for these measurements.
The first setup consists of a pair of high-resolution Ge detectors which allows for measurements of so-called two-step cascades (TSCs), see e.g. Honzatko96 ; Krticka08 ; Valenta15 . These experiments have been mainly performed at Dubna (Russia) Bogdzel82 and Řež near Prague (Czech Republic) Honzatko96 .
The analysis of experimental data allows to get background-free -ray spectra corresponding to decays that connect the capture state (very often just above ) with preselected, well-separated low-lying levels of the nucleus via two -rays. The spectra can be obtained by applying a cut on the detected energy sum deposited in the two Ge detectors.
Due to the high resolution power of Ge detectors, narrow peaks corresponding to TSCs to the preselected levels depositing the total energy of the cascade, are observed in the sum-energy spectra. Only events contributing to these peaks are then analyzed. Spectra of deposited -ray energies from one or both detectors can then be constructed. The analysis method Honzatko96 excludes detected TSCs populating other levels than those of interest and efficiently rules out the accidental coincidence and Compton-related background. A contribution of a TSC via an intermediate level in a TSC spectrum is almost exclusively given by a pair of narrow, symmetrically located lines. Typically, spectra for several pre-selected final levels are available which allows analysis of not only “true” two-step cascades but also of more-step cascades. The influence of the detection system on spectra is relatively simple and can be applied if efficiencies of the two detectors are taken into account Krticka08 .
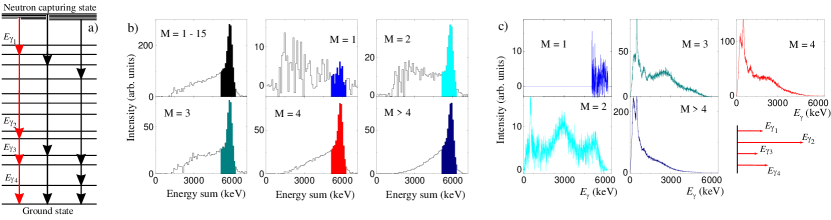
The second experimental setup exploits a highly-segmented array of lower resolution scintillation detectors that allows for measurements of cascades for different detected multiplicities . Different measured spectra can be used for comparison with statistical model predictions. They include the sum-energy spectra, multiplicity-distribution (MD) spectra and spectra of individual deposited energies for individual , often called multi-step cascade (MSC) spectra. The MSC spectra, constructed only from those decays that deposit the energy sum corresponding to the -value of the reaction in the detection system, allow to get more information on PSFs than spectra constructed from all detected events. In addition, a cut on -value usually allows also for very efficient subtraction of the background Sheets09 ; Valenta17 . The proximity of individual detectors requires simulation of the response of the detection setup. This response is usually applied to simulated cascades. These spectra have been so far obtained mainly from measurements at the DANCE detector at Los Alamos Heil01 ; Reifarth04 . The DANCE detector is a highly-segmented high-efficiency array consisting of 160 BaF2 crystals that cover a solid angle of approximately . Fig. 4 illustrates the way how MSC spectra are produced.
With the exception of the TSC spectra in Ref. Voinov10 that used the (p,) reaction, all other available data come from the capture of slow-energy neutrons. Specifically, TSC spectra, that suffer from the low efficiency of Ge detectors are measured using thermal neutrons while MSC spectra typically use spectra from isolated neutron resonances. The advantage of neutron capture is that the spin and parity of the capturing state are known, which is important as spectra from resonances with different can significantly differ Sheets09 ; Walker15 .
The simulations of cascades were usually performed with the Monte Carlo code DICEBOX Becvar98 , which allows for the consideration of Porter-Thomas fluctuations of individual transitions.
2.9.3 Average radiative widths
The total average radiative width is also a quantity containing global information on the PSFs. Theoretically, represents a folding of the deexcitation PSFs (or equivalently transmission coefficients ) and NLD (see e.g. Capote09 ), i.e.
| (11) |
where the summation runs over all spins , parities and transition types , is the neutron incident energy and the energy-, spin- and parity-dependent NLD. The -ray transmission coefficient, is related to the PSF as
| (12) |
Average radiative widths, like neutron strength functions and the average spacing of resonances, are obtained from the analysis of parameter sets for resolved resonances Capote09 ; Mughabghab06 .
2.9.4 Maxwellian-averaged cross sections
The radiative neutron capture cross sections can also provide information on the PSF. At keV neutron energies, the radiative neutron capture cross section is essentially proportional to the total photon transmission coefficient which in turn, like the average radiative width in Eq. 11, is sensitive to the folding of PSF and NLD Goriely08a ; Koning12 , as
| (13) | |||||
A large compilation of about 240 experimental Maxwellian-averaged neutron capture cross sections (MACS) at 30 keV for nuclei with Dillmann06 ; Dillmann14 is available and has been considered for testing the PSF models.
3 Development of the experimental PSF database
In this section, the assessment and selection criteria for the PSF data to be included in the library are discussed. Uncertainty analyses are elaborated in specific cases and re-analysed for two nuclei for which data from both the NRF and Oslo methods are available.
3.1 Compilation of PSFs
The PSF data from the experimental methods described in Sec.2 were compiled in an experimental database. The majority of PSF data were provided directly by the groups performing the measurements and include experimental results available as of January 2019. The photonuclear data were obtained from other databases and processed to obtain PSFs. In some cases, such as (p,) reactions, PSF data were extracted directly from tables in the respective publications, or when not available in table format, from the figures. It is important to emphasize that PSF data measured with the different methods is considered and included only from those publications where the original work extracted the PSF explicitly. Although valuable information can be obtained solely from capture cross section measurements, use of this data go beyond the scope of this work. Each set of data was assessed to verify the suitability for its inclusion as a data file in the library and accompanied by a README file, detailing key information to place the data into context.
3.1.1 PSFs extracted from NRF measurements
The compilation comprises dipole strength functions that were deduced from absorption cross sections according to the prescription given in Sec. 2.1. The data result from experiments covering the excitation-energy range from typically 4-5 MeV up to , in which the absorption cross sections and the related dipole strength functions were deduced as a smooth function of energy.
In the case of broad-band bremstrahlung measurements at ELBE Schwengner05 , -rays were measured with two shielded HPGe detectors placed at to the beam and two at to the beam. Spectra were response and efficiency corrected. The photon flux was determined by using known level widths in 11B. Background due to atomic processes in the target was determined in simulations and subtracted from the spectra. Subtracted spectra contain resolved peaks and nuclear quasicontinuum. These -ray spectra were corrected for feeding and branching intensities obtained from simulations of statistical cascades. The absorption cross sections were obtained from scattering cross sections by using average branching ratios of ground-state transitions obtained from the simulations. Uncertainties of the absorption cross sections include statistical uncertainties, and 5% uncertainties each for efficiency, photon flux and atomic background. The absorption cross sections are compiled in the EXFOR database.
Some experiments obtained data at energies above the neutron separation energy. These do not represent the total photoabsorption cross sections because of the opening of the competing (,n) channel and these PSF values are therefore not included in the data file. Total dipole PSFs for 23 different nuclei for energies up to the neutron separation energies have been included in the PSF library. For 3 nuclei measured at HIS Weller09 (128Xe, 134Xe and 138Ba), both the and PSFs are available separately. The assessment of data did not find grounds on which to exclude any of the available sets of data.
3.1.2 PSFs extracted from the Oslo method
The compilation includes total dipole PSFs from the Oslo method analysis, as described in Sec. 2.2. It also includes data analyzed using the beta-Oslo method and data from inverse kinematics experiments (Inverse-Oslo) which have become available over the last few years. The data typically cover an energy range from about MeV up to a maximum energy .
For data sets obtained prior to 2012, only statistical errors are included in the PSF data, while for newer data sets systematic errors are also considered, which is some cases also include uncertainties due to NLD models, and . These are typically represented by upper and lower uncertainty bands. Where possible PSF data obtained from different NLD models are provided in separate data files. Where it was not possible to extract individual data sets for different normalizations then one data file is provided and the expected variations are provided in terms of error bars. In several cases, the published PSF data were re-analyzed, usually due to the availability of new data for NLDs and/or PSFs normalizations. In these cases the PSFs from both analyses are included in the library as they provide the user insight into the range of uncertainties due to model dependencies. Similarly, if more experiments were performed in the same nucleus, the extracted PSFs from each unique experiment are included in the library since these sets of data are considered to be independent of each other (they may have different energy ranges, beam energy, detector arrangement, etc.). 113 sets of total dipole PSFs for 72 different nuclei measured with the Oslo method for energies up to the neutron separation energies have been included in the PSF library.
3.1.3 PSFs extracted from DRC/ARC
Two different experimental techniques, ARC and DRC (see Sec. 2.3), were applied to obtain information on PSFs from resonance neutron capture experiments. The recent re-analysis of all available data from both types of experiments resulted in two separate databases, DRC-2018 and ARC-2019. The resulting PSF data files present the partial value averaged over measured resonances for each primary transition. For a detailed description of this work and processing of the data, we refer to Refs. Kopecky16 ; Kopecky17 ; Kopecky17b ; Kopecky18 . The results were merged in the final DRC+ARC 2019 library, which includes information on PSFs for 88 nuclides with masses between . The list of nuclei available in the DRC+ARC-2019 library is shown in Table 1.
| Nucleus | DRC | ARC | DRC+ARC | Nucleus | DRC | ARC | DRC+ARC |
|---|---|---|---|---|---|---|---|
| F-20 | x | x | Gd-156 | xx | xx | ||
| Mg-25 | x | x | Gd-157 | xx | xx | ||
| Al-28 | x | x | Gd-158 | xx | xx | ||
| Si-29 | x | x | Gd-159 | x | xx | xx | |
| Si-30 | x | x | Dy-162 | xx | xx | ||
| S-33 | x | x | Dy-163 | xx | xx | ||
| Cl-36 | x | x | Dy-164 | xx | xx | ||
| Sc-46 | x | x | Dy-165 | xx | xx | ||
| Cr-53 | x | x | Ho-166 | xx | xx | ||
| Cr-54 | x | x | Er-168 | x | xx | xx | |
| Fe-57 | x | x | Er-169 | x | x | ||
| Fe-59 | x | x | Tm-170 | x | xx | xx | |
| Co-60 | x | 0 | x | Yb-172 | xx | xx | |
| Cu-64 | x | 0 | x | Yb-174 | x | xx | xx |
| Ge-74 | x | x | Lu-176 | x | xx | xx | |
| As-76 | xx | xx | Lu-177 | x | x | ||
| Zr-92 | xx | xx | Hf-178 | x | xx | xx | |
| Nb-94 | x | x | Hf-180 | xx | xx | ||
| Mo-93 | x | 0 | x | Ta-182 | x | xx | xx |
| Mo-96 | xx | xx | W-183 | x | x | ||
| Mo-98 | xx | xx | W-184 | x | xx | xx | |
| Mo-99 | x | 0 | x | W-185 | xx | xx | |
| Ru-100 | x | x | W-187 | xx | xx | ||
| Ru-102 | x | xx | xx | Os-188 | xx | xx | |
| Rh-104 | x | x | Os-189 | xx | xx | ||
| Pd-106 | x | xx | xx | Os-191 | xx | xx | |
| Pd-109 | xx | xx | Os-193 | xx | xx | ||
| Ag-108 | Ir-192 | xx | xx | ||||
| Cd-114 | xx | xx | Ir-194 | xx | xx | ||
| In-116 | x | x | Pt-195 | xx | xx | ||
| Sb-122 | x | x | Pt-196 | x | xx | xx | |
| Sb-124 | x | x | Pt-197 | xx | xx | ||
| Te-124 | xx | xx | Pt-199 | xx | xx | ||
| Te-126 | x | x | Au-198 | x | xx | xx | |
| I-128 | x | xx | xx | Hg-199 | x | x | |
| Ba-135 | xx | xx | Hg-200 | x | x | ||
| Ba-136 | x | xx | xx | Hg-202 | x | x | |
| Nd-144 | x | x | Th-233 | x | xx | xx | |
| Nd-146 | x | xx | xx | U-235 | x | x | |
| Sm-148 | x | xx | xx | U-236 | x | xx | xx |
| Sm-150 | x | xx | xx | U-237 | x | x | |
| Sm-155 | xx | xx | U-239 | x | xx | xx | |
| Eu-154 | xx | xx | Np-238 | xx | xx | ||
| Gd-155 | xx | xx | Pu-240 | x | xx | xx |
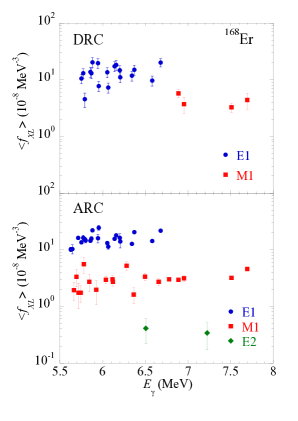
Recommended data were chosen from all extracted data sources and if data for both ARC and DRC experiments were available, the ARC filtered beam results were preferred because of better statistical accuracy due to averaging over a much larger number of resonances compared to the DRC data. An example of this feature is given in Fig. 5 for DRC and ARC data for 198Au; the DRC values correspond to averaging over only 4 -wave resonances. The uncertainty of the average value due to Porter-Thomas fluctuations is thus expected to be about 70%. This uncertainty is not indicated in Fig. 5. The error bars correspond only to uncertainties of measured transition intensities increased by and uncertainty estimates of 10%. When the number of resonances studied in a DRC experiment is large, the resulting data distribution is comparable to ARC measurements as shown in Fig. 6 for 168Er.
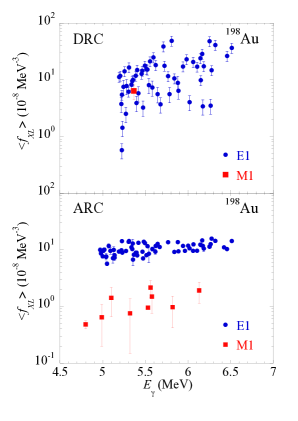
In the absence of ARC data, DRC data, even those measured with a small number of resonances, were included in the final version of the DRC+ARC-2019 library. As long as DRC data is processed in a doubly average quasi-monoenergetic format of (see Sec. 2.3), they give a satisfactory estimate of the absolute value of the PSF.
The performance of this database was thoroughly validated against the previous evaluations Kopecky18 and in case of conflicting results, the reasons (such as difference in selected resonance parameters, different or assignments or applied spacing) are discussed in detail in Refs. Kopecky16 ; Kopecky17b ; Kopecky18 .
The PSF library includes DRC and ARC for 88 nuclei, out of which 34 are DRC data and 54 ARC data. Among the 34 DRC data sets, strengths are available for 33 nuclei, strengths for 29 nuclei and for 8 nuclei only. The 54 ARC data sets include data on for 52, for 49 and for 22 nuclei.
3.1.4 PSFs from the capture -ray library
The intensities of primary transitions from thermal neutron captures, available in the EGAF library EGAF (see Sec. 2.4), were exploited for the determination of the PSF for individual transition types. The EGAF library consists of approximately 32,000 prompt thermal neutron capture -ray cross sections for nearly all elements. For primary transitions these were converted to as described in Sec. 2.4.
To suppress the influence of the Porter-Thomas fluctuations, several neighboring transitions were binned together and averaged. The average value needs to be in many cases corrected for weak, unobserved transitions within the energy bin.
The expected number of transitions within each bin was obtained from the spin-dependent level density based on a modified CT model Firestone17b where the temperature is taken from the RIPL-3 library Capote09 and the backshift energy is the yrast energy for each spin taken from ENSDF ENSDF . The expectation value of the total unobserved transition intensity in a bin was estimated assuming the Porter-Thomas distribution Porter56 of individual intensities under the assumption that the observed transitions (after conversion to ) are the strongest ones occurring in the bin. The PSFs values in the database were corrected for this estimate.
Given uncertainties correspond only to statistical uncertainties in the determination of the average value and an additional 20% uncertainty in the estimate of the missing strength. Neither an uncertainty due to and , nor the uncertainty in the determination of the average PSFs values (coming from the Porter-Thomas fluctuation) is included. As the number of transitions in a bin is typically 3 to 10, the latter uncertainty is significant and it reaches values of about . It can be deduced from the number of observed and expected transitions in the bin.
A total of 808 -ray binned PSF data have been extracted from thermal neutron capture data for a total of 209 nuclei, including PSFs from 206 nuclei, for 153 nuclei, for 38 nuclei and for 2 nuclei.
3.1.5 PSFs from average resonance proton capture
The data were published primarily in the pre-1990s with the technique described in Sec. 2.5 and direct communication with the authors was not possible. Data has been extracted from the publications, either directly from the tables provided or by digitizing the graphs. No averaging of the PSF for a given nucleus over transitions to more low-lying levels has been performed. The typical range covered in this method is about MeV wide and is located between the proton and neutron separation energies of nuclei in the to mass region. More specifically, the measured excitation energy region typically starts at MeV above , given by the minimum proton energy used in the experiment. Depending on the values of and the region investigated is generally between about 5 and 10 MeV although for 90Zr measurements have been performed beyond Szeflinski83 . Specific information, in particular details on the uncertainty analysis, may not be available at all or is only partially described in the original publications. A detailed understanding of the uncertainties assigned to most of the data is therefore lacking. In some publications, no mention on the origin of the uncertainties are made while estimates of statistical and/or systematic uncertainties are provided in other publications but generally without much detail on how these were obtained. Data on the total dipole PSF from (p,) measurements are available for 22 nuclei and are included in the PSF library.
3.1.6 PSFs from the Ratio method
The method (Sec. 2.6) was developed recently and only relative values of the total dipole PSF are obtained unless a normalization to GDR data is performed. Such a normalization has been performed for the case of 95Mo Krticka16 and the data is included in the database. The data covers a range from MeV to a few hundred keV below the neutron separation energy. For detailed discussions on the different sources of uncertainties see Refs. Wiedeking12 ; Krticka16 .
3.1.7 PSFs from inelastic proton scattering
The compilation includes PSFs that were extracted from inelastic proton scattering reaction data using polarized proton beams. The measured intensities are converted to , and total dipole PSFs and correspond to as described in Sec. 2.7. They are provided in separate files, covering the excitation-energy range from about 5 MeV up to approximately 20 MeV. Data is available for 96Mo, 120Sn and 208Pb nuclei. The uncertainties correspond to those published in the original papers Tamii11 ; Poltoratska12 ; Bassauer16 ; Martin17 .
3.1.8 PSFs extracted from photonuclear data
Photoabsorption PSF data files have been compiled from photoneutron cross sections including the photofission cross section for fissioning nuclei and the photoproton cross sections as compiled in the EXFOR library EXFOR ; Kawano19 . A full list of the corresponding photonuclear cross sections can be found in Ref. Plujko18 . The spin-independent PSF was extracted from the photoabsorption cross section as described in Refs. Bartholomew73 ; Photo00 ; Capote09 ; Plujko18 by applying the more general Eq. 1 to the special case of photoabsorption, i.e.
| (14) |
where is the total photoabsorption cross section of -rays with energy summed over final states with all possible spins.
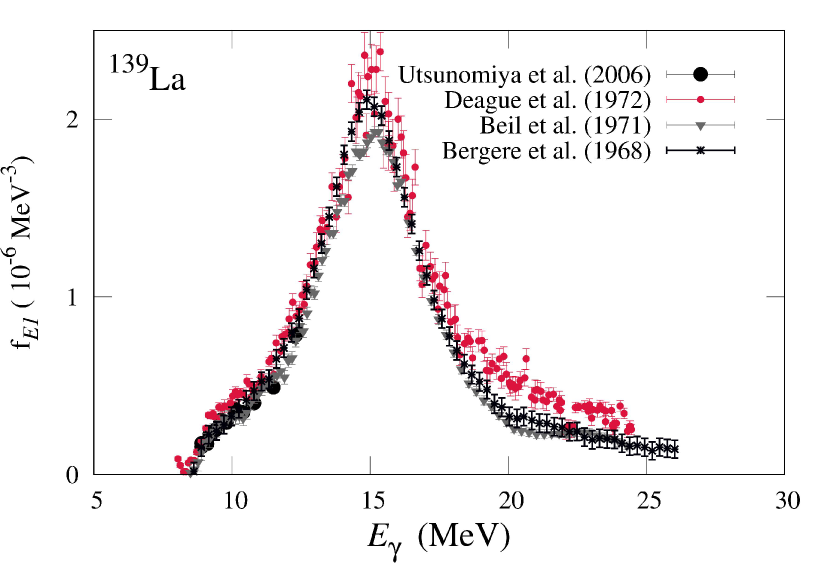
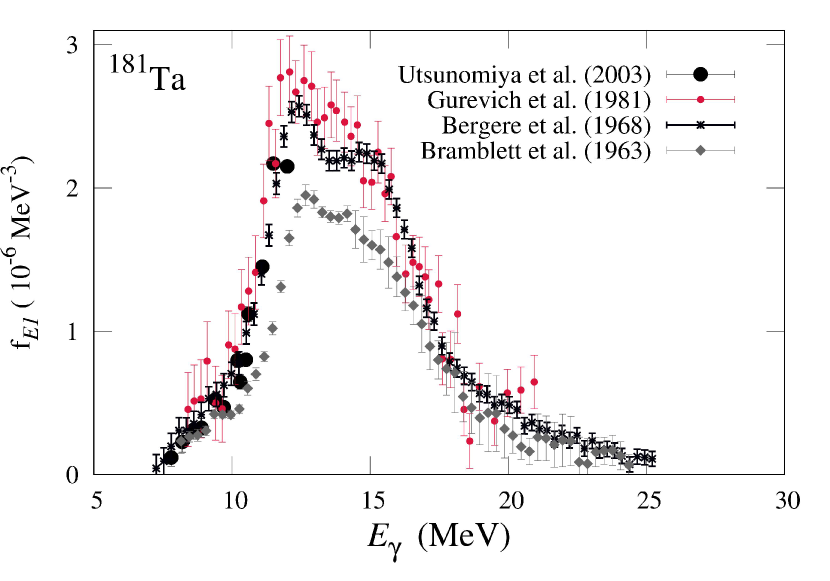
The PSF uncertainties have been estimated with respect to the cross section uncertainties found in the EXFOR database EXFOR . The mean values and uncertainties of the PSF extracted from the various experiments are different but results of recent experimental data are, as a rule, in agreement within experimental errors. Fig. 7 shows representative examples of PSFs extracted from different experiments. It can be seen that the relative uncertainties of the PSFs in the vicinity of the GDR are of the order of 10 to 20 % for recent experimental data. It should be mentioned that the experimental-theoretical re-evaluation method based on objective physical criteria of the data reliability Varlamov14 could significantly decrease the relative uncertainties under discussion.
The PSFs were extracted from photoneutron cross sections that include the emission of particles, but do not include contributions from the (,) channel. Such a contribution dominates however just above the neutron separation energy. For this reason, when extracting PSF from photoabsorption cross sections (Eq. 14), only data lying sufficiently above the neutron threshold have been considered. More specifically, the present PSF library only considers -ray energies for which the (,) cross section is expected to be at least ten times smaller than the photo-particle-emission cross section. The specific -ray energy interval () for which the experimental cross section represents the total photoabsorption cross section was estimated using simulations of the photoabsorption cross section obtained using the nuclear reaction code TALYS Koning12 and typically MeV. Below , the PSF obtained from Eq. 14 has incorrectly small values if it is extracted from a (,n) cross section.
The procedure used to determine this low-energy cut-off () requires a decomposition of the total photoabsorption cross section into partial cross sections through the following relations
| (15) |
Here, is the total photon scattering cross section to excited states in the target nucleus, i.e. the sum of the cross sections of elastic -ray scattering via different types of intermediate states (without shape-elastic component) and non-elastic -ray scattering; is the photoabsorption cross section with emission of the particles; is the total photoneutron reaction cross section; is the photo-charged-particle-emission cross section and the photofission cross section. More details can be found in Plujko18 ; Kawano19 ; Wiedeking19 .
For every nucleus in the photodata library, the specific energy interval was estimated, so that the cross section from () transitions does not exceed more than 10% of the total photoabsorption cross section , i.e.
| (16) | |||||
Fig. 8 illustrates the experimental photoneutron cross sections for 115In and 139La, together with the theoretical decomposition into various contributions.
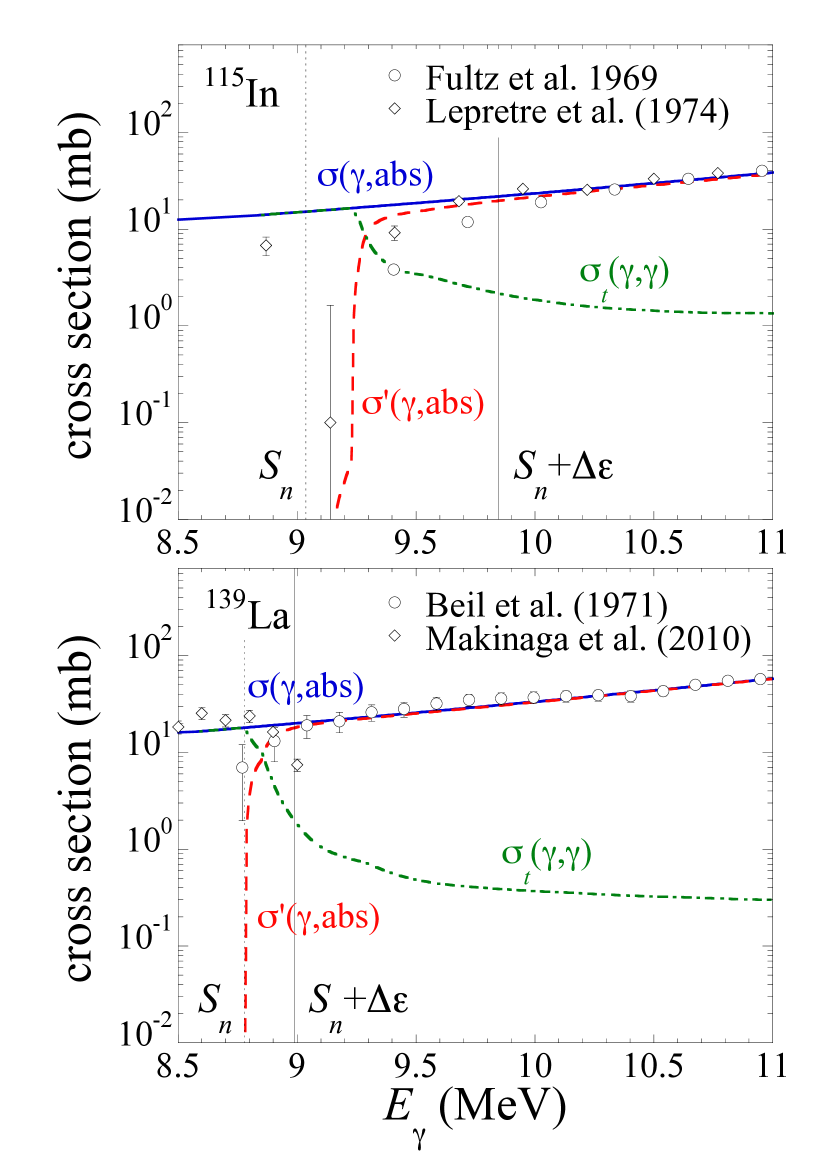
The TALYS calculations were performed with the “Simple Modified Lorentzian” (SMLO) model of PSF (see Sec. 4.2), the CT plus Fermi gas NLD model Koning08 and the default parameters for the additional input quantities. It can be seen in Fig. 8 that neglecting the () contribution leads to a fast decrease of the photoabsorption cross section for -ray energies approaching the neutron threshold. The experimental cross section for 139La denoted by diamonds Makinaga10 corresponds to the () cross section measured in a NRF experiment and decreases just above due to the opening of the strong neutron emission channel.
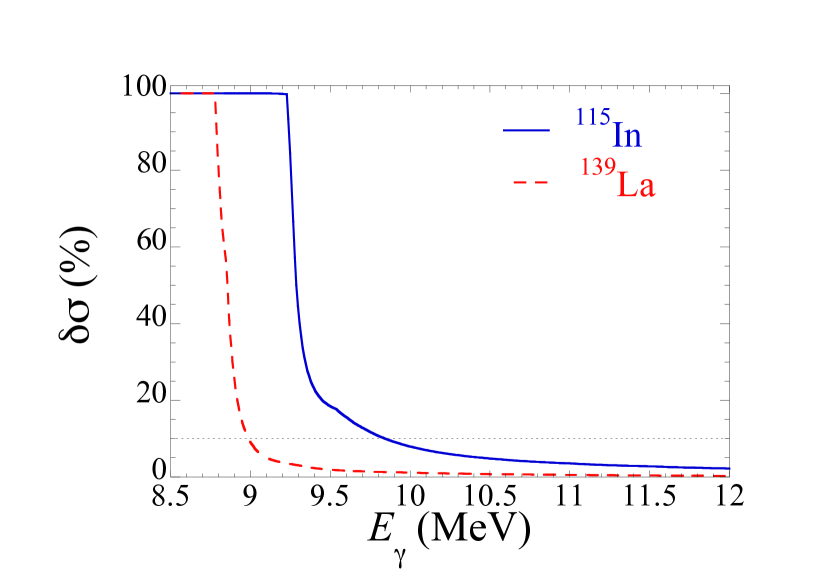
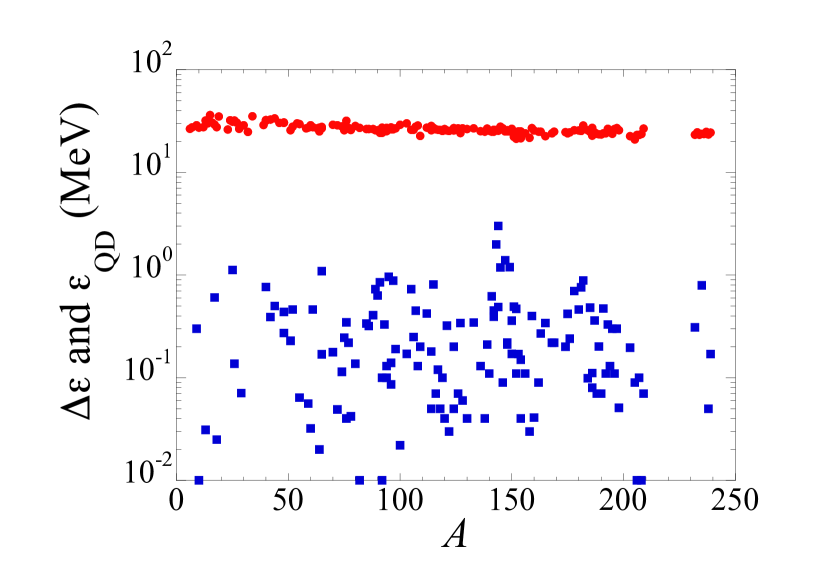
Fig. 9 illustrates the energy-dependence of the ratio of the cross section from () transitions to the total photoabsorption cross section (Eq. 16) for 115In and 139La isotopes. Fig. 10 gives the resulting energy intervals for all nuclei for which the PSF has been extracted from the photonuclear library.
Similarly to low energies in the vicinity of the neutron separation energy, at high energies the measured cross section may not reflect the total photoabsorption. In that case, many channels with various particle emissions are open and the quasi-deuteron breakup component dominates. For this reason, all PSFs from photoabsorption cross sections have been extracted only up to a maximum energy at which the quasi-deuteron component is expected to become higher than 10% of the total photoabsorption cross section. All cross sections have been estimated on the basis of the SMLO PSFs (Sec. 4.2) and the quasi-deuteron component from the standard model of Ref. Chadwick91 . The resulting values of are shown in Fig. 10.
The PSFs were extracted from all available experimental data on photoreaction cross sections from the EXFOR database EXFOR and the recent update of the photonuclear library Kawano19 . In total, the PSFs are given for 159 isotopes between 6Li and 239Pu including 19 elements of natural isotopic composition corresponding all together to 465 different entries. The PSF values for -ray energies below and above were discarded from the data files but are included in the README files (see Sec. 6).
3.2 Uncertainty analysis on test cases
PSFs from different experimental techniques are often not consistent Dimitriou13 . The inconsistencies can be substantial especially between results from Oslo and NRF data. The PSFs deduced from the Oslo and NRF techniques are based on several assumptions and depend, for instance, on the NLD model used during the data processing procedure. Below we describe different sources of uncertainty in these two techniques and perform an enhanced uncertainty and NLD model analysis, in two nuclei for which Oslo and NRF results exist.
3.2.1 Uncertainties in the NRF method
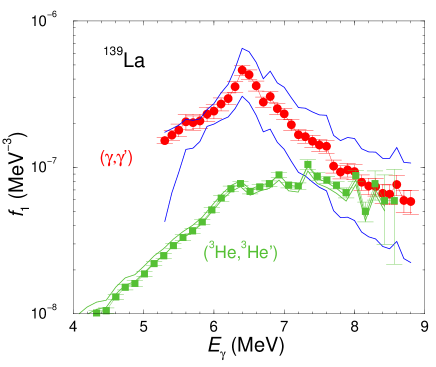
In NRF experiments, photoabsorption cross sections are deduced from intensity distributions that include resolved peaks as well as a quasicontinuum, determined as the intensity after subtracting the atomic background (see Sec. 2.1). For the determination of the photoabsorption cross section the intensities of inelastic transitions have to be subtracted from the total intensity distribution. Furthermore, the remaining ground-state transitions have to be corrected for their branching ratios (see Sec. 2.1). The relative intensities of elastic and inelastic transitions can be estimated by simulations of statistical cascades. The initial values of the PSFs and NLDs are input data in these simulations. The initial strength functions for , , and radiation are Lorentzian-shaped using parameters taken from the RIPL database Capote09 . Absorption cross sections are determined with an iterative technique Massarczyk12 , in which the input PSF is taken from the output of the preceding step. Level density parameters are taken from the compilation Egidy09 . The given uncertainties are taken into account in the simulations for the CT plus Fermi gas model as well as the back-shifted Fermi gas (BSFG) model. The extreme limits of the resulting strength functions can be determined by combining PSFs obtained using the limits of the uncertainties given in Ref. Egidy09 . This has been done for the cases of 89Y Benouaret09 and 139La Makinaga10 in the present uncertainty analysis. Error bars include statistical uncertainties and uncertainties of detector efficiencies, of photon flux as well as a 1 deviation from the mean values in the individual simulations. In the present analysis, all combinations of upper and lower limits of the level-density parameters were applied. To determine the extreme lower and upper limits of the strength functions, the values with the greatest deviations from the mean were combined. The results are shown in Figs. 11- 12 and are compared with the data obtained in experiments based on the Oslo method Oslo .
3.2.2 Uncertainties in the Oslo method
For most data, uncertainties given for the PSF are only the statistical uncertainties, which are propagated through the unfolding procedure Guttormsen96 , the first generation iteration Guttormsen87 and finally the minimization procedure Schiller00 of the Oslo method. In recent years, systematic errors have been included as well and these contributions are represented by upper and lower limits. No standard procedure was applied though. A detailed review of possible uncertainties in the Oslo method can be found in Ref. Larsen11 . In the Oslo method analysis, the most significant source of systematic uncertainties originates from the absolute normalization of the NLD and PSF. The slopes of the NLD and PSF are interdependent, i.e. when the slope of one is known, the slope of the other is fixed. As discussed in Sec. 2.2, the NLD is typically normalized by comparison to the known discrete levels at low-excitation energy and to the NLD at which is determined from the average neutron resonance spacing and the spin cutoff parameter in a process detailed in Ref. Schiller00 . The number of discrete levels at low-excitation energy is usually well known and does not contribute significantly to the uncertainties. Instead, one of the main contributor to the uncertainties arises from determining the NLD at , which includes the experimental error bars on the measured value and the assumptions made on the spin distribution at . In some cases the libraries Capote09 and Mughabghab18 disagree and provide different recommended values. Such different values will contribute to the upper and lower limits of the systematic uncertainties.
For some nuclei, and/or have not been measured experimentally and the normalization procedure relies on systematics from neighbouring nuclei or on theoretical input to estimate these values. In such situations the systematic uncertainties become more significant. In most cases the measured transmission coefficients are normalized to , as detailed in Voinov01 , and converted to the PSF by using Eq. 5.
Since the presence of strong yrast transitions can result in large uncertainties in the primary -ray matrix, only values above typically 1-2 MeV are used in the analysis. This results in the NLD data being available to an excitation energy 1-2 MeV below . The absolute normalization therefore relies on an interpolation between the highest NLD data points measured and NLD at , which is typically made using the CT formula Gilbert65 . The larger the gap between the last measured data point and , the more sensitive the normalization is to the choice of the NLD model used for the interpolation.
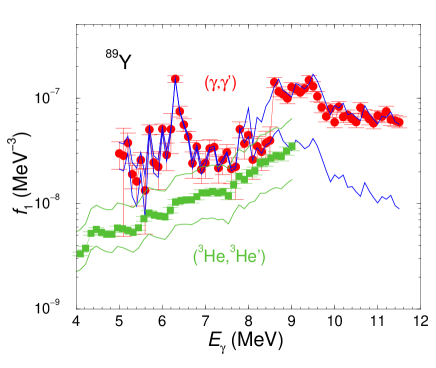
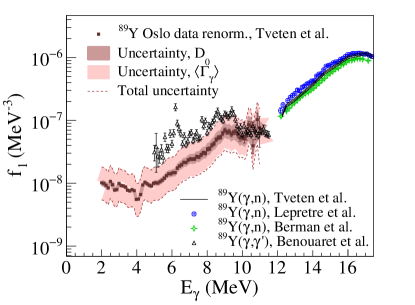
Different procedures have been applied to estimate upper and lower limits for systematic uncertainties. For 89Y, shown in Fig. 13, the different components contributing to the total uncertainty are decomposed. The statistical uncertainties are relatively small and are given as error bars on the data points. The dark shaded area represents the systematic uncertainties due to the value. In the case of 89Y the largest contribution to the systematic uncertainties is due to the unavailability of the average total radiative width needed to normalize the PSF. This is shown by the light-shaded area of Fig. 13. This uncertainty analysis was published in Ref. Tveten19 .
Finally, note that in the case of heavy isotopes, especially in the actinide region, a small proportion of the available spins may be populated by charged-particle-induced reactions. A similar situation is found in the beta-Oslo method Spyrou14 ; Spyrou17 ; Larsen18 for which the nucleus of interest is populated by -decay. In these cases, a good knowledge of the populated spin distribution is crucial for a proper determination of the PSF by the Oslo method, as being recently studied in Ref. Zeiser19 .
3.3 Oslo method versus NRF experimental PSFs
So far, for nine nuclides the PSFs below the neutron separation energy have been studied in NRF experiments at the bremsstrahlung facility ELBE Schwengner05 as well as in charged-particle-induced reactions at OCL. There are several nuclei showing considerable differences in the shape and magnitude of the PSFs from these experiments. We have compared the results of uncertainty analyses for both methods. For the NRF method, this was the first time such an analysis was performed. In the case of the Oslo method, we use the analyses performed in Ref. Kheswa17 and Ref. Larsen16 for 139La and 89Y, respectively.
For 89Y and 139La, considerable differences are found in the shape and magnitude of the PSFs despite the uncertainty analysis which includes statistical and systematic uncertainties. The NRF data have been processed as described in Sec.2.1. The intensities of ground-state transitions were corrected for their branching ratios to deduce the absorption cross section and the error bars of these cross section values include statistical uncertainties and uncertainties of detector efficiencies, of photon flux as well as a deviation from the mean values in the individual simulations. In the cascade simulations, described in Sec. 3.1.1 and 3.2.1, the BSFG level density was used with the parameters given in Ref. Egidy09 . The parameters were varied within their uncertainties in the individual realizations of level schemes. In the present analysis, combinations of extreme upper and lower limits of the level-density parameters were applied. In addition to the BSFG level densities, the CT plus Fermi gas model was also tested with the uncertainties as given in Ref. Egidy09 . On average, the BSFG NLDs result in greater cross sections compared with those resulting from CT plus Fermi gas NLDs. To determine the extreme lower and upper limits of the cross sections, values with the greatest deviation were combined. Figs. 11 and 12 illustrate the effect of the above mentioned uncertainties on the NRF data.
In the case of the Oslo method, the analytical methodology follows the prescription of Sec.2.2 and the procedure yields a functional form for and which must be normalized to known experimental data to obtain physical solutions. The statistical uncertainties are carried through the Oslo method (Sec. 3.2.2). For 139La, the systematic model dependencies have been explored Kheswa17 , where two theoretical models were used to obtain different values of . These are the parity-dependent Hartree-Fock Bogoliubov (HFB) plus combinatorial model Goriely08b and the CT plus Fermi gas model where both parities are assumed to have equal contributions Koning08 . In the latter case, two spin cut-off parameter prescriptions were considered. Thus we explored a total of three different normalizations. The first normalization with the CT plus Fermi gas model is based on the spin cut-off parameter of Ref. Egidy05 and in the second approach, was calculated with the spin cut-off parameter equation as implemented in the TALYS code Koning12 .
For 139La, the and values are averages of experimental values taken from Mughabghab18 ; Capote09 . The three different normalizations are included in Fig. 12 in the form of the upper and lower uncertainty bands. The agreement of PSFs from NRF and Oslo data is not very satisfying. Significant deviations are apparent for MeV. This raises the question if certain structures effects are enhanced/reduced depending on the reaction used. While the Oslo method includes both isoscalar and isovector components, the NRF method probes exclusively the isovector component. Alternative experimental approaches, using (p,p′) and (,) reactions at zero degree relative to the beam, using magnetic spectrometers to investigate the isoscalar and isovector components specifically, may be necessary to fully understand the discrepancy and to disentangle the different components of the PSF in 139La. In this context, we also note that recent shell model calculations Sieja18 for 108,134Xe show structural differences between strengths for photoabsorption from the ground state and photoemission from a number of high-lying states. This suggests that the photoabsorption approach is more sensitive to nuclear structure effects for energies below 5 MeV. Similar effects may play a role for excitations at higher energies and may provide a possible explanation for the discrepancies observed between NRF and Oslo data. This may limit the ability to compare Oslo and NRF data principally because of the different excitation mechanisms.
In the case of 89Y, the uncertainty analysis of NRF data is performed as outlined above for 139La. For the Oslo data Larsen16 , the spin distribution up to the neutron separation energy is determined from three different approaches; i) a phenomenological BSFG spin-cutoff parameter Egidy09 , ii) the BSFG spin-cutoff parameter of Ref. Egidy06 where a rigid-body moment of inertia is assumed, and iii) microscopic calculations within the HFB plus combinatorial model Goriely08b . The absolute values and slope of the NLD are obtained by normalizing to discrete levels at low-excitation energy and to average -wave neutron resonance spacing at when this information is available. However, in this nucleus the NLD at is not available and instead, systematics of -wave resonance spacings for this mass region are considered by using the RIPL-3 database Capote09 . More specifically, the average value for 88,89Sr, 90Y and 91Zr are used to estimate . In addition, systematic errors due to the spin distribution at are taken into account Larsen11 . The uncertainty bands including these dependencies are shown in Fig. 11.
Within the uncertainties, there is an overlap between the NRF and Oslo PSF data for most parts of the energy region for 89Y. The main discrepancy appears from structures observed in the NRF data around 6.5 MeV which are not seen in the Oslo method data.
The best agreement between NRF and Oslo methods is found in the case of 74Ge Renstrom16 ; Massarczyk15 , as shown in Fig. 14, despite the fact that an error analysis similar to that of 89Y and 139La has not been performed. So far, 74Ge is the only case where both PSF data sets can be recommended. One may speculate that the extra strength which is observed in several nuclei around 6 to 9 MeV in NRF measurements (see Figs. 11, 12 as well as Fig. 15 in Sec. 5.1) is most pronounced in nuclei near shell closures. It results from prominent transitions, which in the case of ion-induced reactions are mixed with many other transitions (if they are excited in the same way at all). No such prominent peaks are found in the NRF PSF of deformed nuclei, such as 74Ge. In this case, the strength is fragmented and is found to be compatible with the Oslo PSF in contrast to spherical nuclei.
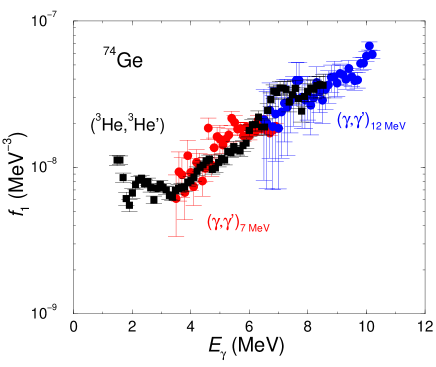
4 PSF models
4.1 Introduction
The total photon transmission coefficient (Eq. 13) from an excited state is normally dominated by the dipole and transitions. Simple semi-classical models assume a Lorentzian shape for the photoabsorption cross section that is dominated by a giant resonance, at least for medium- and heavy-mass nuclei. Experimental photoabsorption data confirms the simple semi-classical picture of a Lorentzian shape at energies around the resonance energy Axel62 ; Berman75 . The photonuclear data near the peaks of the GDR can be fitted by Lorentz, Breit-Wigner or Gaussian functions equally well, but their low- and high-energy tails differ significantly Bartholomew73 ; Gardner84 . Lorentz and Breit-Wigner shapes of the photoabsorption cross sections can be derived from different theoretical approaches Brink55 ; Plujko08b . The Lorentzian shape can be transformed to a Breit-Wigner form but with a shape width that depends on the photon energy, resonance energy and width of the Lorentzian Plujko18 . A Lorentz shape is more suitable for fitting the photonuclear data because the standard Breit-Wigner expression is obtained without taking account of time reversal invariance and is adequate for describing a strong resonance state when the width is small with respect to the resonance energy Dover72 . However, both line shapes correspond to a nuclear response to an electromagnetic field which proceeds through the excitation of one strong collective state that exhausts the energy-weighted sum rule. The photoabsorption and -decay processes that occur on the wings of the GDR are governed by the excitation of states of a different nature and therefore, the fitting of experimental data by Lorentzian functions should be limited to small energy ranges around the GDR peak in order to obtain reliable values for the GDR parameters. For axially deformed nuclei, the GDR is found experimentally to be well represented by the sum of two Lorentzian-like components. This double peak structure is interpreted as the collective vibrations along and perpendicular to the axis of symmetry Axel62 ; Berman75 . Extension to the superposition of three Lorentzian functions to describe triaxility has also been considered Alhassid88 ; Alhassid90 ; Grosse17 .
Significant deviations from a standard Lorentzian (SLO) have been observed in both theoretical and experimental studies below the neutron threshold McCullagh81 ; Allen82 ; Kopecky90 . In particular, low-energy DRC data were explained by introducing an energy-dependent width of the SLO functional to reduce the strength around the neutron separation energy McCullagh81 . A generalization of the Lorentzian shape, to account for data below and above the neutron threshold, was achieved through the inclusion of an energy- and temperature-dependent width. This family of Lorentzian models is based on the theory of Fermi liquids Kadmenskii83 ; Kamerdzhiev04 and has shown to improve significantly the calculations of the experimental radiative widths and -ray spectra Kopecky90 ; Goriely98 ; Capote09 ; Plujko11 ; Plujko18 . Until recently, this generalized Lorentzian (GLO) functional has been the only model used in practical applications, and more specifically in global calculations for large sets of nuclei. While the mode has been widely studied, less effort has been devoted to the parametrisation of the PSF. For the PSF, the most commonly used formula is an SLO expression describing the spin-flip mode only Kopecky90 ; Capote09 that neglects the low-energy mode for deformed nuclei (the so-called scissors mode). Only a few works Schramm12 ; Mumpower17 ; Grosse17 ; Goriely18b proposed a systematic phenomenological description of the low-energy scissors mode.
The Lorentzian GDR approach, however, even in the generalized form, suffers from shortcomings of various sorts. On the one hand, it is unable to predict the enhancement of the strength at energies around the neutron separation energy (such as the pygmy resonance) as demonstrated by different experiments (see e.g. Kneissl06 ; Tonchev10 ; Savran11 ; Savran13 ). On the other hand, even if a Lorentzian function provides a suitable representation of the strength, the location of its maximum and its width remain to be predicted from a model for each nucleus or from systematics. For nuclear applications, these properties have often been obtained from a droplet-type model Myers77 . This approach clearly lacks reliability when dealing with exotic nuclei. The situation is even less satisfactory for the component, where systematics are limited or scarce due to the limited amount of experimental information available.
In view of this situation, and considering that the GDR properties and low-energy resonances may influence substantially the predictions of radiative capture cross sections, it is clearly of great interest to develop PSF models of the microscopic type which are expected to be more reliable and have some predictive power. Since the early 70’, different mean-field approaches, such as the QRPA, the quasiparticle-phonon model and some of their improved variants, have been developed and successfully applied to the description of giant multipole resonances in both the non-relativistic Bertsch73 ; Liu76 ; Blaizot77 ; Khan04 ; Kamerdzhiev04 ; Peru08 ; Schwengner08 ; Peru11 ; Martini16 ; Arsenyev17 ; Deloncle17 ; Colo01 ; Sarchi04 ; Tsoneva08 ; Papakonstantinou09 ; Papakonstantinou12 ; Papakonstantinou15 ; Avdeenkov11 ; Achakovskiy15 ; Gambacurta18 and relativistic Vretenar01 ; Ring01 ; Ma02 ; Ring07 ; Pena08 ; Daoutidis12a ; Litvinova13a ; Litvinova13b ; Egorova16 mean field frameworks. The nuclear shell model has also been extensively used to describe electromagnetic excitations Sober85 ; vonNeumann98 ; Caurier05 ; Heyde10 ; Loens12 ; Schwengner13 ; Schwengner17 ; Brown14 ; Sieja17 ; Sieja17b ; Sieja18 ; Midtbo18 ; Karampagia17 , but restricted to light nuclei. Despite such a huge effort in developing microscopic models, only a few attempts have been made to provide systematic large-scale calculations that can compete with more phenomenological Lorentz-type models. The QRPA PSFs obtained within the Hartree-Fock+BCS Goriely02 as well as HFB Goriely04 ; Martini16 ; Goriely18a frameworks have been shown to reproduce satisfactorily the location and width of the GDR and the ARC data at low energies for the bulk of existing data. The aforementioned QRPA calculations have been performed for all the nuclei lying between the two drip lines. In the neutron-deficient region as well as along the valley of -stability, the QRPA distributions are very close to a Lorentzian profile. Similar attempts have been performed within the relativistic mean-field framework but in a less systematic way Daoutidis12a ; Egorova16 .
Due to the applicability to a large set of nuclei and the fact that they are inherently different approaches, both the phenomenological Lorentzian-type and the mean field plus QRPA models are proposed for developing global models of the dipole PSF. The recommended theoretical PSFs are detailed below and their ability to reproduce experimental data is discussed in Sec. 5.
4.2 Phenomenological & SMLO model
In this section, we describe the phenomenological SMLO model that was developed to estimate the and PSFs Plujko18 ; Goriely18b for all nuclei with . Both and SMLO formulas have been adjusted on a large number of experimental data, as shown in Sec 5.
4.2.1 The SMLO model
For the PSF for cold and heated nuclei, we consider a rather simple expression given by Plujko18 ; Goriely18b
| (17) | |||||
where denotes the temperature of the heated nucleus, the number of normal vibration modes of the GDR excitation ( for spherical nuclei and 2 for axially deformed ones) and the Thomas-Reiche-Kuhn (TRK) sum rule given by
| (18) |
where is the neutron-proton asymmetry factor. The Lorentzian function in Eq. 17 is characterized by GDR parameters corresponding to the peak energy , the width at half maximum and the possible deviation of the integrated cross section from the TRK sum rule .
The SMLO width, , related to the relaxation mechanism of the giant vibration -mode, is taken to be energy- and temperature-dependent as follows
| (19) |
where the linear dependence on the energy arises from the inverse -dependence of the average squared matrix element in the transitions of the 1 particle – 1 hole states to 2 particles – 2 holes states Capote09 . The quadratic temperature dependence in Eq. 19 originates from the Fermi liquid theory Kadmenskii83 .
The GDR resonance energies of the -mode are taken such that , for deformed nuclei while for spherical nuclei, . These energies are connected to the energies and of the vibrations along and perpendicular to the symmetry axis (note that for prolate nuclei, we take and , while for oblate ones, and ). Finally, the factor gives the weight of the -mode with respect to the TRK sum rule.
Whenever experimental photoabsorption data are available in the vicinity of the GDR, the GDR parameters , and are adjusted to the data. A compilation of such data can be found in Ref. Plujko18 . However, when no data exists, systematics of the GDR parameters is used. Such a systematics was obtained by performing a least-square fit to the recommended experimental GDR parameters in spherical nuclei as well as deformed nuclei in the and ranges, where to a good approximation deformed nuclei can be considered as axially deformed. The following expression was adopted for the centroid energy of the GDR:
| (20) |
where MeV and . Eq. 20 corresponds approximately to the eigenenergy of the GDR vibration within the hydrodynamical liquid drop model Myers77 , and agrees with sum rule prescriptions Lipparini89 ; Bohigas79 ; Gleissl90 . For deformed nuclei, we assume the equiprobability of the normal mode excitations and the twofold degeneracy of the giant collective vibration perpendicular to the axis of symmetry. In this case, the centroid energy is expressed as and the energies and along the two ellipsoid semi-axes are approximated as
| (21) | |||||
| (22) |
where is determined from the ratio of the ellipsoid semi-axis lengths , which in turn is a function of the quadrupole deformation parameter since .
Slight deviations from the TRK sum rule are known to exist from experimental photoabsorption data. For this reason, the possible deviation of the -mode is estimated assuming that , i.e. , for prolate nuclei and , for oblate nuclei.
The GDR width is estimated from a simple power-law expression with MeV and . More details on the model and the adjustment can be found in Refs. Plujko08 ; Plujko11 ; Plujko18 ; Goriely18b . The prescription for calculating the high-energy quasi-deuteron contribution, i.e., the photoabsorption cross section leading to the production of a neutron – proton pair can be found in Ref. Plujko18 .
Finally, the temperature is derived from the excitation energy using a simple Fermi gas expression. Since the temperature entering Eq. 17 corresponds to the temperature of the final state, it reads where the level density parameter MeV-1 is adopted. More details can be found in Plujko18 ; Goriely18b . Note that the temperature dependence gives rise to a non-zero limit of the PSF at zero energy, as shown in Fig. 1 of Ref. Goriely18b . The photoabsorption PSF for cold nuclei can directly be deduced from the deexcitation PSF as .
4.2.2 The SMLO model
An empirical PSF Goriely18b was built, inspired by the HFB+ QRPA strength Goriely18a obtained with the D1M Gogny force Goriely09a (hereafter D1M+QRPA, see Sec. 4.3) considering an SLO-type function for both the low-energy scissors () mode and the spin-flip () components, i.e.
| (23) | |||||
where is the peak cross section, the energy at the peak and the width at half maximum for both the spin-flip () or the scissors mode ().
Following the and deformation dependences of both the spin-flip and scissors mode resonances predicted within the D1M+QRPA approach, the energy, width and strength of the Lorentzian-type function have been determined in a simple manner. The D1M+QRPA calculations predict that, globally, the spin-flip peak energy scales like and the peak strength increases linearly with , so that the peak cross section scales like . For the scissors mode, present only in deformed nuclei, the centroid energy remains rather constant between 4 MeV for light nuclei and 3 MeV for heavier ones. It can be rather well described by the simple decreasing function Goriely18b , while the peak strength is found to be globally proportional to and to the quadrupole deformation parameter . The amplitude of the strength is then determined by comparing the approximation (Eq. 23) with existing data, namely ARC data Kopecky17 for the spin-flip model and NRF data Pietralla98 in the rare-earth region for the scissors mode.
When considering the deexcitation PSF, deviations from the photoabsorption strength can be expected, especially for -ray energies approaching the zero limit. In particular, shell-model calculations Schwengner13 ; Brown14 ; Sieja17 ; Sieja17b ; Sieja18 ; Karampagia17 ; Schwengner17 ; Midtbo18 predict an exponential increase of the deexcitation PSF at decreasing -ray energies approaching zero. Such an upbend of the PSF observed experimentally (see e.g. Voinov04 ; Guttormsen05 ) has therefore been assumed to be of nature, though no strong experimental evidence for this assignement exists at the moment Jones18 . For the deexcitation PSF, the zero- limit determined in Ref. Goriely18a can be added to the photoabsorption expression, leading to
| (24) |
where the parameters and can be tuned on available shell-model and low-energy experimental results Goriely18a ; Goriely18b .
The final parameters of the three modes read
-
•
the spin-flip resonance: mb, MeV and MeV;
-
•
the scissors mode: mb, MeV and MeV;
-
•
the upbend: and MeV-3,
where the final amplitude of the spin-flip and scissors mode strength has been globally tuned on ARC and NRF data. The quadrupole deformation parameter can be extracted from mean field calculations, such as HFB Goriely09a . More details can be found in Ref. Goriely18b .
4.3 Mean-Field + QRPA model
With respect to phenomenological approaches that have just been described, the reliability of the PSF predictions can be greatly improved by the use of microscopic or semi-microscopic models. Such an effort can be found in Refs. Goriely02 ; Goriely04 ; Daoutidis12a ; Martini16 ; Goriely16b ; Goriely18a where a complete set of and PSFs was derived from mean field plus QRPA calculations. When compared with experimental data and considered for practical applications, all mean field plus QRPA calculations need however some phenomenological corrections. These include a broadening of the QRPA strength to take the neglected damping of collective motions into account as well as a shift of the strength to lower energies due to the contribution beyond the 1 particle - 1 hole excitations and the interaction between the single-particle and low-lying collective phonon degrees of freedom Colo01 ; Sarchi04 ; Tsoneva08 ; Papakonstantinou09 ; Papakonstantinou12 ; Papakonstantinou15 ; Avdeenkov11 ; Achakovskiy15 ; Gambacurta18 ; Litvinova13b ; Egorova16 . In addition, most of the mean field plus QRPA calculations assume spherical symmetry, so that phenomenological corrections need to be included in order to properly describe the splitting of the giant dipole resonance in deformed nuclei. State-of-the-art calculations including effects beyond the 1 particle - 1 hole excitations and phonon coupling are now available Colo01 ; Sarchi04 ; Tsoneva08 ; Papakonstantinou09 ; Papakonstantinou12 ; Papakonstantinou15 ; Avdeenkov11 ; Achakovskiy15 ; Gambacurta18 ; Litvinova13b ; Egorova16 but they remain computer-wise intractable for large-scale applications.
Axially-symmetric-deformed QRPA calculations based on HFB calculations using the finite-range Gogny interaction have been shown to provide rather satisfactory predictions of the and strengths Peru08 ; Peru11 ; Peru14 ; Martini16 ; Goriely16b ; Deloncle17 ; Goriely18a . The effects beyond the 1 particle - 1 hole QRPA are empirically included by considering an energy shift that increases with energy. More specifically, both the and QRPA strengths are shifted by an energy of MeV for MeV, MeV for MeV and MeV for MeV. For energies in the MeV range, the energy shift is interpolated linearly between the anchor values at 0.5, 18 and 21 MeV. Similarly, an empirical damping of the collective motions is introduced in the QRPA strength by folding each strength by a SLO function of width that has been adjusted on photoabsorption data and is assumed to differ for both possible projections of the angular momentum, but also to be dependent on the atomic mass and the quadrupole deformation . More precisely, for the strength, the width is expressed as and , where for , and 2.5 MeV otherwise. For the strength, a constant value of MeV is adopted Goriely16b . Note that these QRPA calculations are applied to even-even nuclei, the PSF for odd nuclei being derived by interpolation Martini16 .The resulting model is referred to as D1M+QRPA.
When considering the deexcitation PSF, deviations from the photoabsorption strength are expected, especially for -ray energies approaching the zero limit. As proposed in Ref. Goriely18a , a constant strength and an upbend, both inspired by shell-model calculations can be assumed for -ray energies approaching zero Schwengner13 ; Brown14 ; Sieja17 ; Sieja17b ; Sieja18 ; Karampagia17 ; Schwengner17 ; Midtbo18 . The and PSFs, including the low-energy contributions and hereafter denoted as D1M+QRPA+0lim, finally read
| (25) | |||||
| (26) |
where is the D1M+QRPA dipole strength at the photon energy , is the excitation energy of the initial deexciting state and , , , and are free parameters that have been adjusted on shell-model results and available low-energy experimental data such as those obtained with the Oslo method (see e.g. Voinov04 ; Guttormsen05 ; Algin08 ), the average radiative widths Capote09 or MSC and MD spectra Krticka19 . Such a study Goriely18a ; Krticka19 led to MeV-4, MeV, MeV-1, and MeV-3 for all nuclei with and MeV-3 for lighter nuclei Krticka19 (where the quadrupole deformation parameter is taken consistently from HFB calculations based on the D1M Gogny force Goriely09a ). The deformation dependence of the zero- limit is mainly based on shell-model calculations Sieja17b ; Karampagia17 ; Schwengner17 ; Midtbo18 , the upbend being less pronounced for deformed nuclei for which part of the strength is transferred into the scissors mode region.
5 Comparison between experiments and models
In addition to capturing the underlying physics, the recommended theoretical models of dipole PSF should also be able to reproduce the existing experimental data. The PSF data described in Secs. 2 and 3 are available for a relatively large number of nuclei and span a broad region of -ray energies of MeV, allowing us to probe either the and components separately or the total dipole PSF. In the present section, the theoretical models described in Sec. 4 are compared with the following data:
-
•
NRF data for the total dipole strength below for 23 nuclei; the extraction of PSF is sensitive to the adopted NLD model; NRF methods also provide integrated strength for about 47 nuclei in the MeV region;
-
•
Oslo data for the total dipole PSF below for 72 nuclei; the extraction of PSF is sensitive to the adopted normalisation for both the PSF and NLD;
-
•
ARC and DRC data in the MeV region for 88 nuclei which are available separately for the and modes; extracted PSF values are sensitive to the systematics adopted within the normalisation procedure;
-
•
PSFs determined from intensities of primary transition following the thermal neutron capture, including data for 206 nuclei and data for 153 nuclei;
-
•
(p,) data for 22 nuclei with in the energy range of MeV below the proton separation energy;
-
•
(p,p′) data for 96Mo, 120Sn and 208Pb available separately for the and modes;
-
•
Photoneutron and photoabsorption data for 159 nuclei which are sensitive to the dominant PSF in the GDR region;
-
•
Singles -ray spectra from thermal neutron capture yielding information on the PSF below for 5 nuclei; comparative simulations are sensitive to the adopted NLD model;
-
•
MSC and MD spectra from individual neutron resonances yielding information on the PSF below . Simulations are sensitive to the adopted NLD model. The comparison was performed for 15 nuclei, in some of them for spectra from resonances of different spin and parity;
-
•
TSC spectra following thermal neutron capture for 2 nuclei; predictions are sensitive to the adopted NLD model
-
•
Average radiative width yielding information on the integrated PSF below for 228 nuclei; estimates of the average radiative width are sensitive to the adopted NLD model;
-
•
MACS at 30 keV yielding information on the integrated PSF below for 240 nuclei; estimates of the MACS are sensitive to the adopted NLD model.
Comparisons between the above-mentioned data and the two theoretical models, namely SMLO and D1M+QRPA+0lim, are illustrated in the following subsections.
5.1 Comparison with NRF data
The total dipole PSFs extracted from NRF measurements are compared with the SMLO and D1M+QRPA models in Fig. 15 for all the 23 different nuclei for which data exist. Data extend from the neutron separation energy down to around MeV. Note that in this case, the PSF data correspond to photoexcitation strengths, so that no temperature dependence or additional low-energy contribution is included in the calculations. A rather fair agreement is obtained, except in some cases like Se isotopes, 139La, 181Ta or 196Pt for which the energy dependence obtained experimentally does not agree with the model description. It should however be stressed that the NRF data presented in Fig. 15 do not include systematic uncertainties due to model dependencies, except for 89Y and 139La, as discussed in Sec. 3.2.1.
Some extra strength around 6 to 9 MeV is observed in NRF data, especially for nuclei near closed shells. This strength stems from prominent to transitions that in the case of ion-induced reactions are mixed with many other transitions. It could consequently be attributed to the experimental method itself, as discussed in Sec. 3.2.1. Without a full uncertainty analysis to reveal the impact of input NLD models on the shape and magnitude of the PSF, we are unable to draw any definite conclusions about the agreement between experiment and model calculations. In addition, discrepancies between PSFs obtained with different methods are also observed for some of these nuclei, as discussed in Sec. 6.1 (see in particular Fig. 41). For this reason, the presence of a low-lying dipole strength, known as the pygmy resonance, is not discussed here. The readers are referred to Ref. Savran13 .
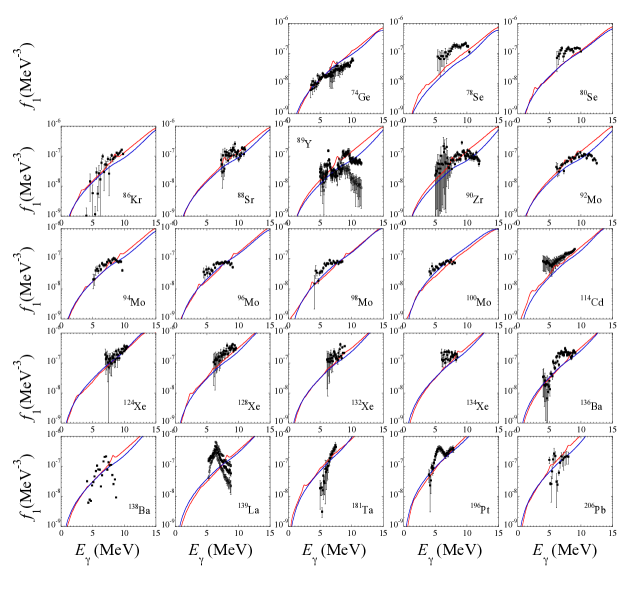
In Fig. 16, we compare the experimental and PSFs of the slightly deformed 128Xe and spherical 134Xe and 138Ba nuclei obtained with quasi-monoenergetic and linearly polarized -ray beams art HIS Tonchev10 ; Massarczyk14 with the D1M+QRPA and SMLO models. Like in Fig. 15, the dominant strength obtained with NRF differs from the Lorentzian-like theoretical PSFs in the 6–9 MeV region. As can be seen in Fig. 16, the SMLO width for the spin-flip mode is assumed to be constant (i.e. - and -independent), in contrast to what is obtained with the D1M+QRPA calculation and observed experimentally.
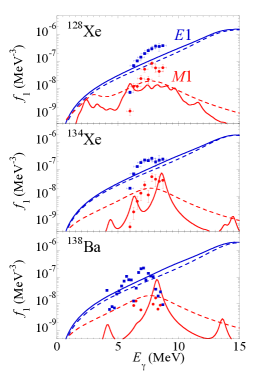
The NRF method also allows to estimate the integrated strength that can provide valuable information on the low-energy PSF, especially for the mode Laszewski86 ; Laszewski87 ; Laszewski88 ; Alarcon89 ; Richter90 ; Frekers90 ; Pietralla95 ; Luttge96 ; Fransen99 ; Linnemann03 ; Adekola11 ; Mettner87 . Fig. 17 compares the integrated experimental strength obtained from (,) NRF experiments with the one predicted by the SMLO and D1M+QRPA models for the rare-earth nuclei with . The data integrated over energies ranging from 2 to 4 MeV typically correspond to the scissors mode (circles in Fig. 17). Overall agreement is observed between experimental and calculated integrated strength. In the deformed-spherical transition region around , the SMLO model tends to overestimate the experimental data due to uncertainties in the determination of the quadrupole deformation parameter Goriely18b . A better description is found with the D1M+QRPA model.
The excitation energy of the scissors mode is found to be systematically located around 3 MeV for all rare-earth nuclei for which experimental data is available Heyde10 ; Pietralla98 . Both the D1M+QRPA and SMLO mean energies are compatible with the measured data Goriely16b ; Goriely18b .
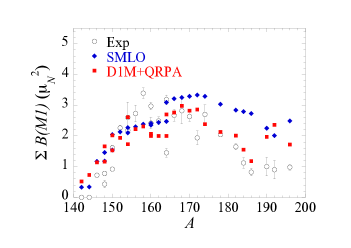
5.2 Comparison with Oslo data
The total dipole PSFs obtained by the Oslo method are compared with the SMLO and D1M+QRPA models in Figs. 18–20 for all the 72 nuclei for which data exist. An uncertainty analysis including model dependencies, as discussed in Sec. 3.2.2, has only been performed in the case of 64-65Ni, 69Ni, 89Y, 92Zr, 138-140La and 180-182Ta. This could explain why global models may deviate for some nuclei, such as the Mo or Sn isotopes, since in these cases the impact of using different NLD models in the extraction of the experimental PSF has not been investigated and is therefore, not reflected in the plotted uncertainties. A comprehensive uncertainty analysis of the Oslo data (Sec. 3.2.2) could consequently help to reconcile experiment and theory. However, for some nuclei, like the Sc isotopes, a strong modification of the Oslo PSF slope, i.e. of the NLD normalization, would be required.
It is thus not possible to draw definite conclusions on the agreement between experimental and model PSFs, as was also mentioned in Sect. 5.1. In the few cases mentioned above, where an uncertainty analysis has been performed, the calculations lie within or at the limits of the range of uncertainties. It should also be noted that the upper and lower limits in these cases do not correspond to a full uncertainty analysis, but to a partial analysis including one or two different NLD models and the uncertainties of the normalisation and total average radiative width, as described in Sec. 3.2.2. Since the Oslo data describe a deexcitation strength, the model calculations include here the low-energy contributions described in Sec. 4.
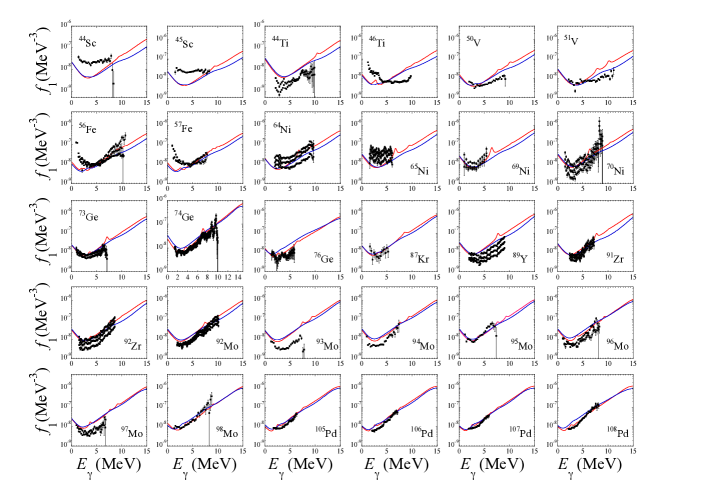
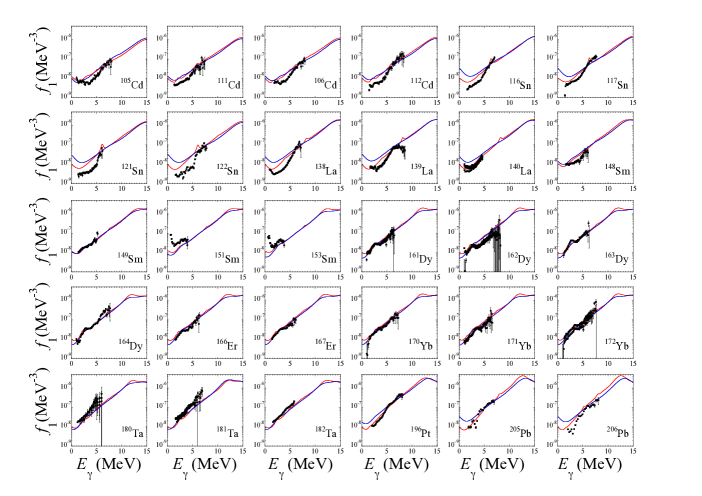
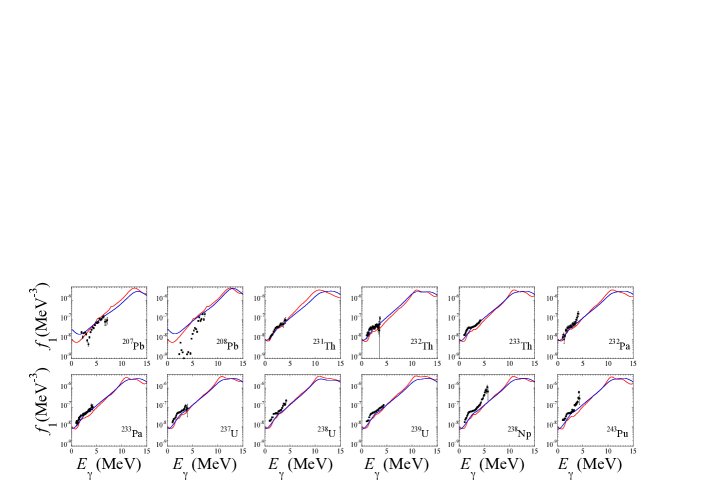
5.3 Comparison with ARC/DRC data
The quasi-monoenergetic representation of PSF values in the energy window MeV extracted from the differential DRC and ARC data (see Sec. 2.3) is compared in Fig. 21 with the model predictions averaged within the same energy interval. The comparison includes both the and transitions. It is seen that both the D1M+QRPA+0lim and SMLO models, on average, reproduce the whole set of ARC data, from the lightest to the heaviest species. More scatter is obtained for the PSF, and in particular with D1M+QRPA+0lim, due to the peaked spin-flip resonance found mainly in spherical nuclei (see also Figs. 22-23).
A more detailed comparison of DRC and ARC data, now for individual values of , can be found in Figs. 22 and 23, respectively. As discussed in Sec. 3.1.3, DRC data are included in the library when no equivalent ARC measurement is available, even if the DRC PSF has been extracted out of a small number of resonances. In this case, a large scatter can be expected, as seen in Fig. 22, especially for the lightest nuclei where the non-statistical pattern of the few resonances DRC data can clearly be observed. In such cases, a detailed comparison with models is meaningless.
Whenever available, the ARC filtered beam results are preferred over the DRC data because of the higher statistical accuracy and averaging over a much larger number of resonances that is involved compared to the DRC data. This is illustrated in Fig. 23 for a sample of 25 nuclei out of the 54 known cases (see Table 1). In this case, it can be seen that the agreement between ARC and model PSFs is relatively good for both models and both transition types, from the lightest to the heaviest nuclei.
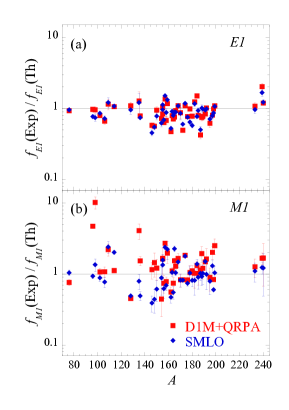
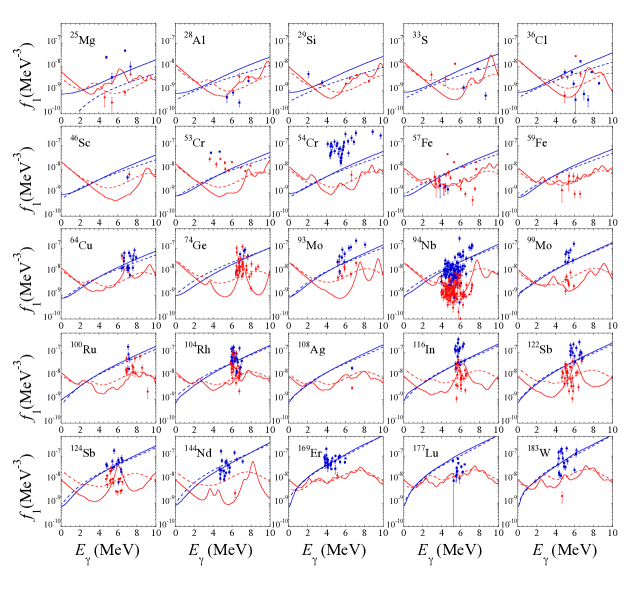
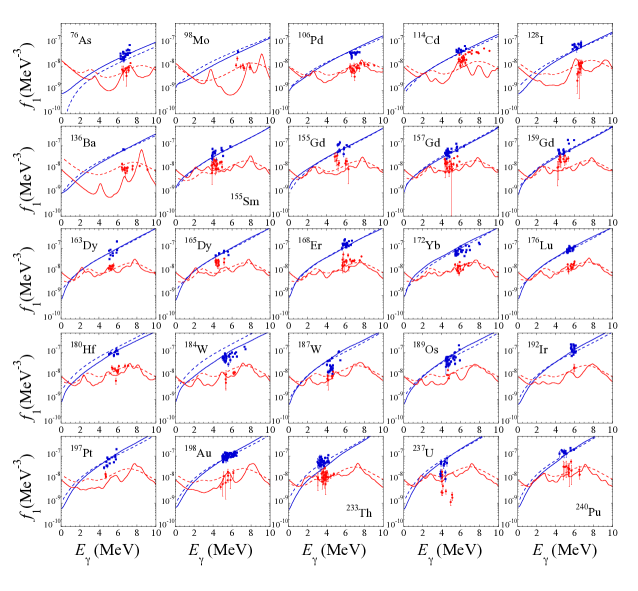
5.4 Comparison with thermal neutron data
PSFs from the thermal neutron capture data have been extracted as described in Sec. 3.1.4. The 808 -ray binned PSF data for and components are compared with model predictions in Fig. 24 as a function of the atomic mass and in Fig. 25 as a function of the -ray energy. Model predictions are seen to globally underpredict the data within a factor of 10. However, much larger deviations can be observed for both model predictions, especially for light nuclei. It should, however, be recalled here (see Sec. 3.1.4) that extracting average strengths from this kind of data is challenging as the resulting PSFs are affected significantly by Porter-Thomas fluctuations. These data are therefore, expected to have large associated uncertainties.
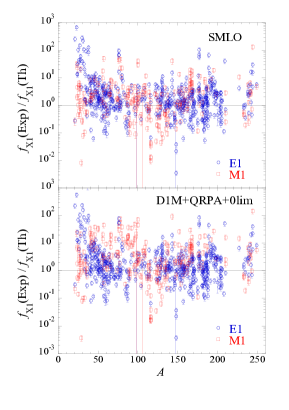
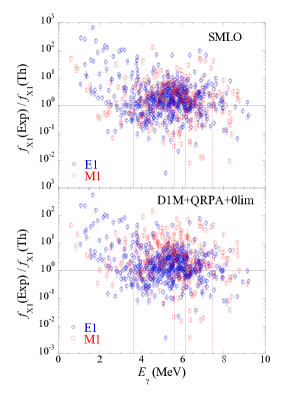
5.5 Comparison with (p,) data
In Fig. 26, a comprehensive comparison is shown between PSFs extracted from (p,) data and theoretical SMLO and D1M+QRPA+0lim predictions for the 22 nuclei for which data exist. In some cases, in particular for the Mn, Co, Cu and Zn isotopes, the agreement is rather poor. New proton capture measurements, including a detailed analysis of both experimental and theoretical uncertainties, are recommended to confirm the determination of the PSF. For heavier nuclei, including 90Zr for which data up to the GDR region is available (see also Fig. 41), the agreement between experiment and models is quite satisfactory and shows the relevance of this method for extracting PSFs.
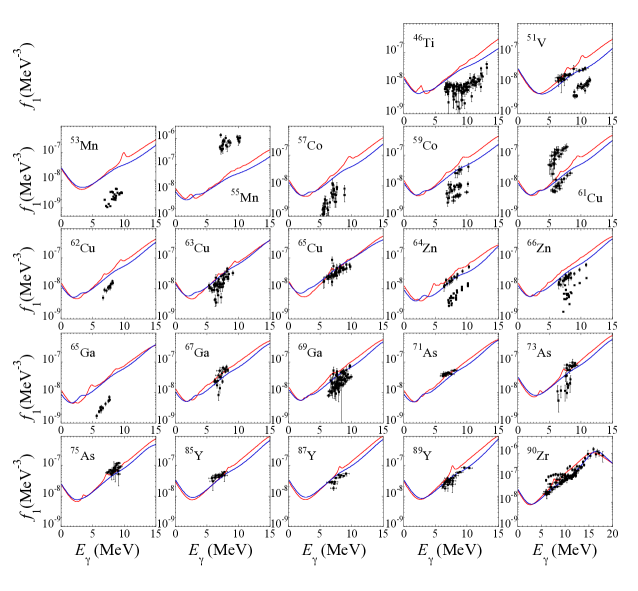
5.6 Comparison with (p,p′) data
We show in Fig. 27 the and PSFs extracted from (p,p′) experiments Tamii11 ; Poltoratska12 ; Bassauer16 for 120Sn and 208Pb. As pointed out in Sec. 4.2, SMLO GDR parameters have been adjusted on photoneutron data, so that the location and width of the strength reproduce rather well the (p,p′) data in the GDR region, as expected. In contrast, the D1M+QRPA model is a global approach and while it reproduces rather well the 120Sn data in the GDR region, discrepancies are seen for 208Pb. As far as the PSF is concerned, the experimental PSF is in rather good agreement with the SMLO spin-flip resonance for 120Sn (though the centroid energy is about 1.5 MeV too low), but not for 208Pb. D1M+QRPA calculation gives a fair description of 208Pb data, but cannot reproduce the 120Sn data. Note that the 96Mo (p,p′) data Martin17 are not discussed separately here, but will be compared with data obtained from other methods in Sec. 6.1 (see in particular Fig. 40).
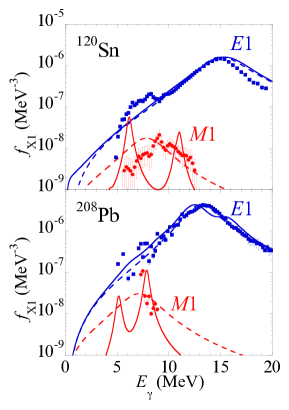
5.7 Comparison with photodata
Figs. 28-29 compare the PSFs extracted from experimental photoabsorption and/or photoneutron cross sections with the SMLO and D1M+QRPA PSFs for a sample of 60 nuclei out of the 159 for which photodata is available. We recall that the SMLO calculations and the corresponding Lorentzian GDR parameters have been directly adjusted to experimental photonuclear cross sections Plujko18 ; Kawano19 and therefore, the global comparison in Figs. 28-29 illustrates the quality of the fitting procedure as well as the adequacy of the Lorentzian phenomenological approach to describing the PSF. In contrast, the D1M+QRPA model is a global model that has not been tuned on individual cross sections, but globally renormalized, as described in Sec. 4.3, to account for missing effects, such as contributions beyond the 1 particle – 1 hole excitations and the interaction between the single-particle and low-lying collective phonon degrees of freedom. This global renormalisation is shown in Figs. 28-29 to lead to a rather satisfactory description of the PSF in the GDR region, though for light nuclei, the centroid energy is usually found at lower energies than observed. The -dependence introduced in the spreading width (see Sec. 4.3) is found to give the correct hierarchy between the two GDR peaks in the case of deformed nuclei.
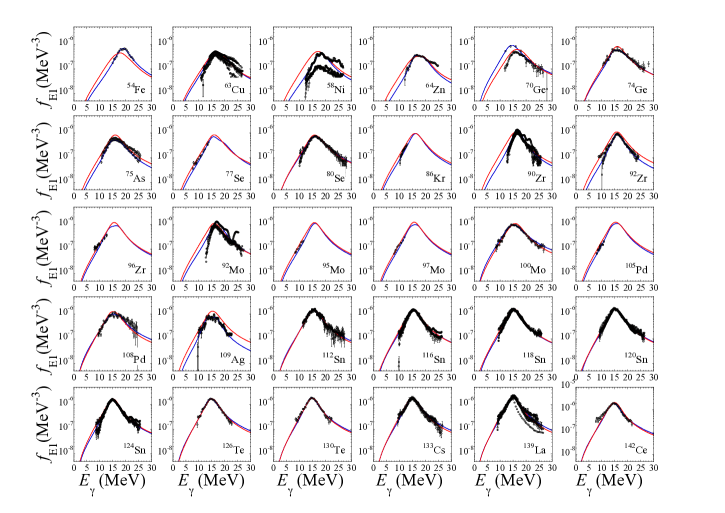
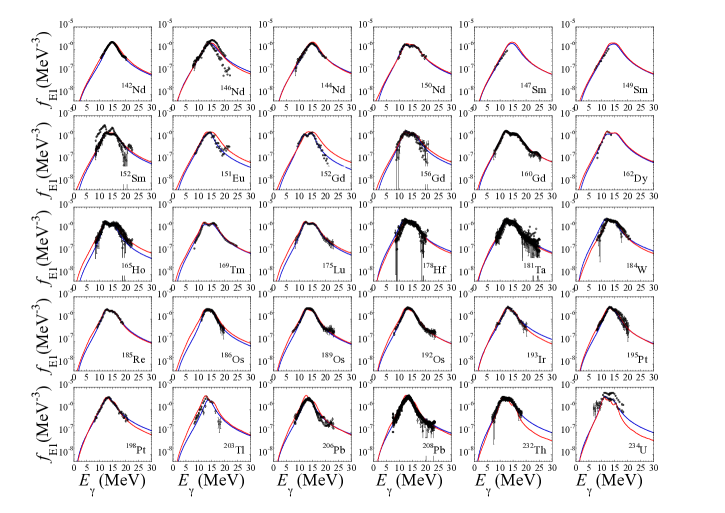
5.8 Comparison with singles spectra from cold neutron capture
Unfolded singles spectra obtained from cold neutron capture can provide important constraints on the PSF and NLD models. Due to the low neutron energy, the angular distribution of the -rays is isotropic, simplifying the determination of the experimental -ray branching ratios. Experimentally it is possible to provide -ray multiplicity based on the unfolded spectrum using the internal cross section calibration and the total radiative capture cross section. The multiplicity is a ratio of the sum of partial -ray production cross sections in the spectrum and total cross section. Once the spectrum is well described by the model, the observed multiplicity is correctly predicted. However, the inverse is not true, reproducing the experimental multiplicity does not imply that the model is correct. In the current version of the BITS code (see Sec. 2.9.1), only the lowest multipolarity is taken into the account to generate the average partial widths from the PSFs used to calculate the branching ratios above the critical energy. The discrete level part of the decay scheme is built up from the ENSDF library data ENSDF . The experimental branching ratios below the critical energy are adopted from intensities measured in the present study and the ENSDF conversion coefficients are included to estimate the electromagnetic decay probability. When no experimental conversion coefficient is available, it is calculated for the lowest multipolarity and the corresponding type using the BrICCs code Kibedi08 . Above the critical energy, the electromagnetic decay probability does not include the mixing ratio and is calculated for the lowest multipolarity. The mixing ratio can significantly influence the simulation results which is practically limited to the case of plus mixing through the PSF choice in the determination of the transition width. Because it is generally not known for higher lying levels, we neglect this possibility by considering the lowest multipolarity. The electron conversion however may significantly influence the modelling results, since the low-energy transitions in high mass nuclei will not appear in the decay spectrum but appears as feeding of the final levels; this requires double administration of the transition matrix elements which is implemented in the BITS model. This effect is expected in the case of an transition below 300 keV and below 1 MeV, but is negligible above 0.1 MeV for transitions in heavy nuclei, such as actinides.
An example of modelling singles -ray spectra is given in Fig. 30 for the 242Pu(n,)243Pu reaction. The experimental spectrum is compared with simulations performed using D1M+QRPA+0lim and SMLO models for the PSF, combined with the HFB plus combinatorial NLD Goriely08b . The D1M+QRPA+0lim describes the shape of the experimental spectrum fairly well, though the low-energy part of the spectrum, including the highest intensity -lines, is underestimated. This can be clearly seen in Fig. 31 where the running sum of probabilities are shown as a function of the photon energy. To achieve a better agreement for the running sum of probabilities, an additional low-energy strength would be required to the PSF to enhance intensities in the whole energy region. A shift of about 0.2 MeV on the scissors mode responsible for the the 1.8 MeV bump would also improve both the running sum of probabilities and the agreement with the spectra (Fig. 30). For the calculation based on the SMLO PSF, while the running sum of probability is closer to experiment (Fig. 31), surprisingly the and PSF components provide the same intensity pattern in the spectrum (see upper panel of Fig. 30), leading to an overestimate of the -decay probability in the 1 MeV region. Another difference with the D1M+QRPA+0lim model is the missing scissors mode bump at 1.8 MeV, which, for SMLO, is located at higher energy, around 2.8 MeV, where it has little influence on the high energy spectrum.
Similar, or even better, agreements have been obtained for the 72Ge(n,)73Ge, 73Ge(n,)74Ge, 77Se(n,)78Se as well as 113Cd(n,)114Cd. In the cases where two capture spins are available, i.e. for the odd- target, one of the capture spin gives a better description than the other. The final result can be obtained by a weighted sum of both spin contributions where the weighting factor can be obtained from the cross section contribution of resonances with the corresponding spin. The generally good description of the continuum part of the studied reactions supports the use of D1M+QRPA+0lim PSF in combination with the HFB plus combinatorial NLD for the description of the -decay.
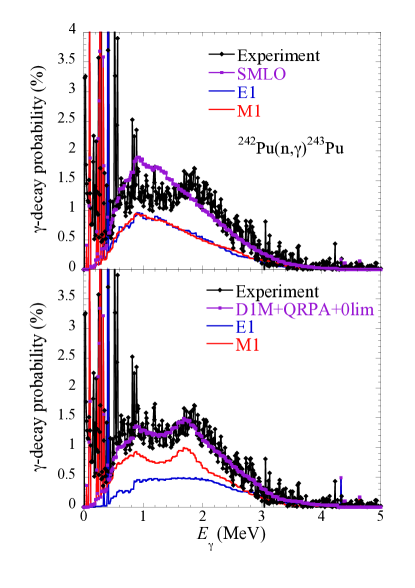
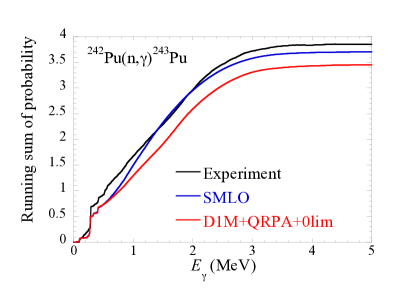
5.9 Comparison with multi- and two-step cascade spectra
Similarly to singles spectra from thermal (cold) neutron spectra, information on PSF can be obtained also from coincidence -ray spectra following radiative capture of slow neutrons. Two observables from the decay of individual resonances are used to compare model predictions with simulations. Specifically, the observables are the MD and MSC spectra from cascades that have deposited all the energy of the cascade in the detector (see Sec. 2.9.2). In reality, a range of sum-energies, typically about 1 MeV wide is used Krticka19 . Such cuts on the energy sum help to suppress possible contributions from the background and impurities in the target. In the case of MSC spectra, these cuts also make some of the structures observed in the spectra more pronounced.
The measured MD and MSC spectra are products of a complex interplay between the PSFs of different multipolarities, NLD and the detector response to individual cascades. The cascades derived from the different PSF and NLD models were generated with the help of the Monte-Carlo DICEBOX code Becvar98 ; Krticka19a . The code allows to treat the expected Porter-Thomas fluctuations of partial radiation widths via the concept of nuclear realizations, i.e. different sets of all levels and partial radiation widths in a simulated nucleus. Individual nuclear realizations yield different predictions of observables even for a fixed combination of the PSF and NLD models and the spin and parity of the capturing state. For each tested combination of the PSF and NLD models, 15 different nuclear realizations were simulated. The response of the DANCE detector to each simulated cascade was then determined using the Monte-Carlo GEANT4-based code Agostinelli03 ; Jandel07 .
The MD and MSC spectra were constructed separately from each simulated nuclear realization and were normalized to give the same area of the sum-energy spectra for multiplicities and the chosen sum-energy cut; for details see Ref. Krticka19 and references therein. The range of predictions corresponding to two standard deviations (average standard deviation) from individual nuclear realizations is illustrated in Figs. 32-34. Simulated MSC spectra are normalized to experimental ones using one (common for all ) normalization factor, again to give the same area in the sum-energy spectra for . The absolute scale on the vertical axes of MSC spectra is arbitrary but the relative contributions of different are kept.
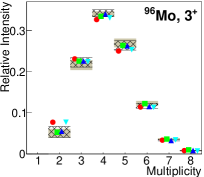
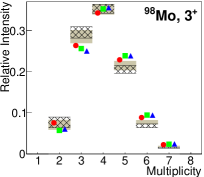
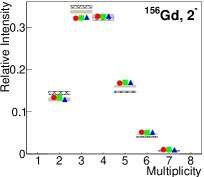
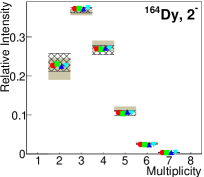
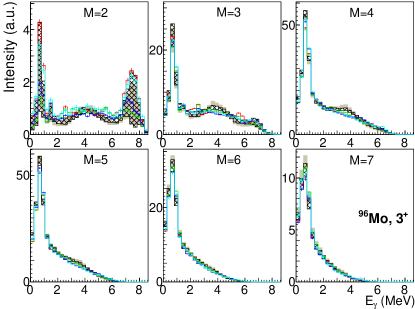
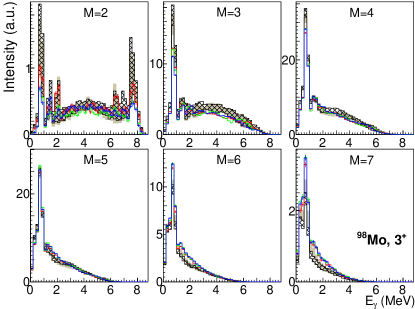
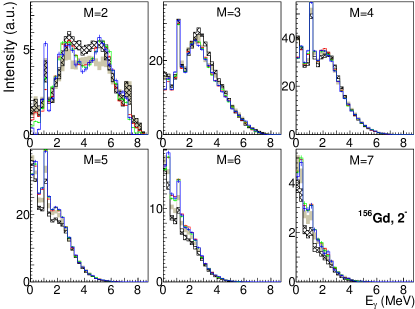
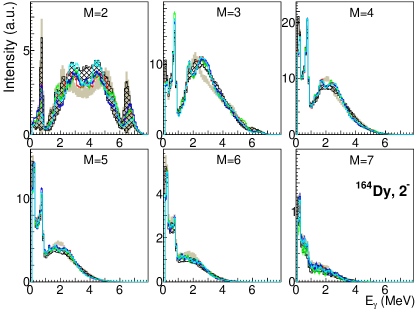
A detailed comparison of simulations obtained with different ingredients in the D1M+QRPA+0lim PSFs was performed in Ref. Krticka19 for spectra from 15 different nuclei, sometimes from resonances with different spins (and parities). In the simulations of Ref. Krticka19 , the size of the 1 zero- amplitude (Eq. 26), the broadening width and the low- limit given by the and parameters (Eq. 26) were varied. In addition, two significantly different NLD models were used in the comparison, namely the microscopically based HFB plus combinatorial model Goriely08b and the phenomenological CT plus Fermi gas model Koning08 recommended by the RIPL-3 Library Capote09 . It was found that the predicted spectra show sensitivity to the adopted NLD model.
Although the agreement between experimental and simulated spectra using the global D1M+QRPA+0lim model is not always perfect, and, not surprisingly, better agreement can be reached with locally adjusted models or parameters (see original papers with an analysis of MSC spectra listed in Ref. Krticka19 ), the predictions of the global model are acceptable, as discussed in details in Ref. Krticka19 . The smearing width of the PSF, that need to be applied to D1M+QRPA calculations should be smaller than about 1 MeV. Further, the influence of different proposed low- parametrizations remains small. This is not that surprising, as the contribution for below about 3 MeV is expected to be significantly higher than tested contribution.
The sensitivity to the NLD models is reflected predominantly in the uncertainty affecting the low- enhancement. As a result of this sensitivity, a different enhancement is required to describe experimental data with different NLD models. In addition, some NLD models seem not to be able to describe the spectra for some nuclei, particularly in the case of rare-earth nuclei Krticka19 . In any case, the comparison of MSC spectra indicates that the contribution of the scissors mode is reasonably well described by the D1M+QRPA+0lim model and that data seem to be compatible with a non-negligible low- strength in all the tested nuclei.
A phenomenological parametrization was proposed for the low-energy limit C of the D1M+QRPA+0lim model from the comparison between predictions and experiment Krticka19 . As discussed in Sec. 4.3, the form of the parametrization is partly based on the expectation of the shell-model calculations. A comparison for more nuclei with would however be needed to get more reliable information on the low- limit for these nuclei.
Similar comparisons have been made also for predictions of the SMLO model. In this case, we fixed the parameters of the spin-flip mode, the scissors mode as well as of the low- limit to the values proposed in Sec. 4.2 (Eqs. 23-24).
Examples of the agreement between the MD spectra predicted with both the D1M+QRPA+0lim and SMLO models and experiment can be found in Fig. 32 for four nuclei. The MSC spectra for the same nuclei are compared in Figs. 33 and 34. The overall quality of the description of the experimental spectra with the SMLO predictions seem to be slightly worse than that with the D1M+QRPA+0lim model. The influence of the adopted NLD models on predictions was similar to that found with the D1M+QRPA+0lim model; the same two NLD models used as in combination with the D1M+QRPA+0lim model were tested.
The proposed systematics of the low- limit in the SMLO model in combination with the HFB plus combinatorial NLD model leads to a MD slightly shifted toward lower values if compared to experiment. The trend is even more pronounced if the SMLO PSF model is combined with the CT plus Fermi gas model of NLD. In addition, the position of the scissors mode in U isotopes (around 3 MeV in the SMLO model) leads to the absence of bumps near 2 MeV in spectra.
Predictions from the statistical model were also compared for TSC spectra following thermal neutron capture for 96Mo and 156Gd nuclei, as shown in Figs. 35 and 36, respectively. Simulation of cascades was again performed with the DICEBOX code.
Similarly to MD and MSC spectra discussed above, the reproduction of experimental spectra is not perfect, as can be expected from global models. The D1M+QRPA+0lim model seems to give a better reproduction of 156Gd spectra than the SMLO model which indicates that the scissors mode for this nucleus is better described by the D1M+QRPA+0lim model.
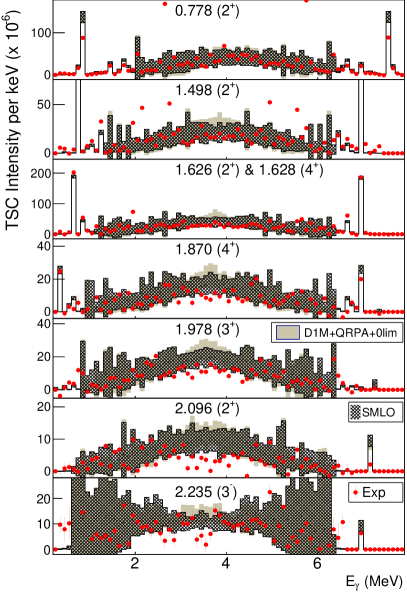
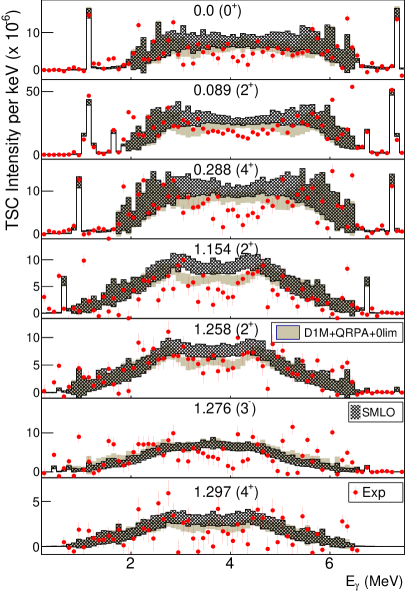
5.10 Average radiative width
The average radiative width, as given by Eq. 11, is an additional source of indisputable information on global PSFs behavior below . It has been a long-standing problem that the phenomenological SLO models for the strength overestimate the average radiative width significantly, while an improved and widely used version of these phenomenological models, the so-called GLO model Capote09 ; Kopecky90 , underestimates it. Such deviations are discussed in detail in Ref. Goriely18a . In Fig. 37, we compare the 228 experimental average radiative widths for nuclei lying between 33S and 251Cf with the SMLO and D1M+QRPA+0lim predictions. The low-energy components, i.e. the scissors mode for deformed nuclei and the upbend, are found to have non-negligible contributions to the integral (Eq. 11), though they were not taken into account in the traditional Lorentzian approach Capote09 ; Kopecky90 ; this explains why the GLO model tends to underestimate the experimental . Both the SMLO and D1M+QRPA+0lim PSF models are found to be globally in agreement with experimental data, as shown in Fig. 37 and seen from the root mean square (rms) deviations given in Table 2, where the and deviation factors are defined as
| (27) | |||||
| (28) |
where is the number of experimental data and is, for each data point , the ratio of theoretical to experimental which takes into account the experimental uncertainties affecting . More precisely, the ratio is calculated as follows
| (29) |
As seen from Eq. 11, the average radiative width is also sensitive to the spin- and parity-dependent NLD. For this reason, the average radiative widths shown in Fig. 37 have been obtained with two fundamentally different NLD models, namely the HFB plus combinatorial model Goriely08b and the CT plus Fermi gas Koning08 . The sensitivity to the NLD is depicted by the error bars in Fig. 37. The HFB plus combinatorial NLD model is seen to give rise to larger values of the average radiative width with respect to the CT plus Fermi gas model. This result is also reflected in the average rms deviations given in Table 2. Globally, as reflected by the factors, the SMLO model is found to reproduce experimental within 45–60% while the D1M+QRPA+0lim is slightly more accurate with approximately 30% accuracy.
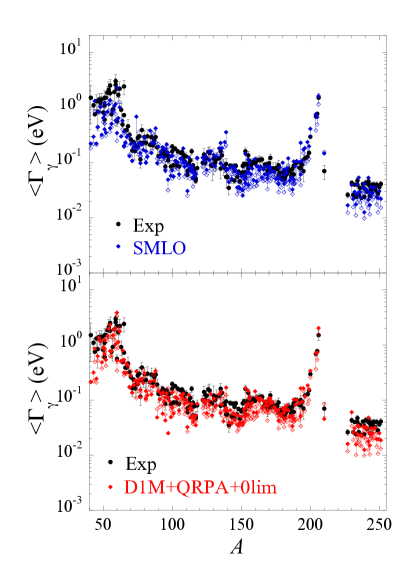
| SMLO (Comb) | 0.90 | 1.45 | 1.11 | 1.47 |
|---|---|---|---|---|
| SMLO (CT) | 0.74 | 1.62 | 0.98 | 1.40 |
| D1M+QRPA+0lim (Comb) | 1.02 | 1.27 | 1.30 | 1.55 |
| D1M+QRPA+0lim (CT) | 0.90 | 1.32 | 1.15 | 1.40 |
5.11 Maxwellian-averaged cross sections at 30 keV
Similarly to the average radiative width, the Maxwellian-averaged cross section also yield global information on PSFs below the neutron separation energy. In Fig. 38 we compare, for nuclei with , the 240 experimental neutron-capture Maxwellian-averaged cross sections (MACS) Dillmann06 ; Dillmann14 at a neutron energy of keV (assuming the target in its ground state only) with the MACS estimated by the TALYS Koning12 reaction code using either the SMLO or the D1M+QRPA+0lim PSF models. Both the HFB plus combinatorial and CT plus Fermi gas models of NLD are considered, as in previous sections. Note that in the TALYS calculation of the MACS , the PSF is not renormalized so as to reproduce the experimental average radiative width; the capability of the models to reproduce experimental average radiative widths is described in the previous Sec. 5.10. Only nuclei with are considered in the comparison to ensure the validity of the Hauser-Feshbach approach, the cross section for lighter nuclei being affected by contributions from direct reactions Xu14 and by the resolved resonance regime Rochman17 at the 30 keV neutron energies considered here.
The deviation from experimental data can be characterized by the same rms factors, and , as defined for the average radiative width (Eqs. 27-28), with . In this case, the experimental error bars are usually rather small (a few percent) Dillmann06 ; Dillmann14 , so that the uncertainties have a small impact on the calculation of the rms factors. As shown in Table 2, the MACS are well reproduced by both the SMLO and D1M+QRPA+0lim PSFs with an accuracy of 40–50% (i.e. ). MACS, like average radiative widths, are sensitive to the NLD model adopted in the calculations. The sensitivity to the NLD model is illustrated in Fig. 38 and Table 2 where both the CT plus Fermi gas and HFB plus combinatorial models are considered in the calculation of the MACS.
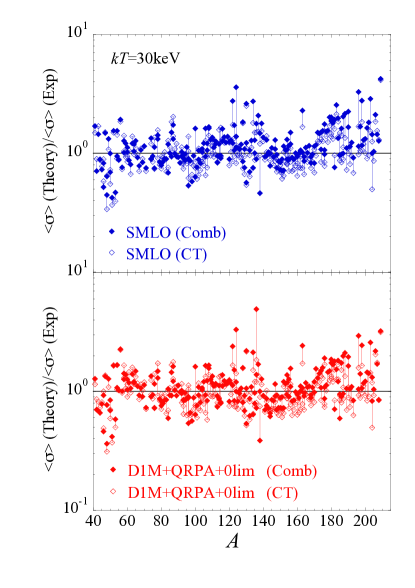
6 IAEA PSF reference database
The IAEA PSF database aims to be an internationally recognised database of experimental, recommended and theoretical PSFs. As such, it contains all the available PSF data measured via the experimental techniques described in this report (Secs. 2 and 3) as well as the theoretical PSFs described in Sec. 4.
6.1 The experimental PSF database
For the experimental PSF database, data are stored in separate data files per nuclide and for each measured multipolarity , if available, or total . The data files contain information on the nuclide (Z,A), multipolarity , units and data format, as well as the reference of the publication. Each data file is accompanied by a README file which contains information on the measurement technique, the assumptions and models used as input in the data analysis, the uncertainty budget, energy cut-offs and data omitted in the data files where needed, e.g. data points below and above in photonuclear data. The database contains the following PSF data (described in Sec. 3.1):
-
•
NRF measurements for 23 nuclei with (total of 31 files);
-
•
charged-particle reaction data with the Oslo method for 72 nuclei with (total of 113 files);
-
•
ARC/DRC measurements for 88 nuclei with (total of 193 files);
-
•
thermal neutron capture data for 209 nuclei with ;
-
•
(p,) measurements for 22 nuclei with (total of 38 files);
-
•
ratio method measurement for 1 nucleus, 95Mo (1 file).
-
•
(p,p′) measurements for 3 nuclei, 96Mo, 120Sn and 208Pb (total of 5 files);
-
•
photodata for 159 nuclei with (total of 465 files).
An overview of the PSF data extracted from the various sources and compiled in the database is shown in Fig. 39 which illustrates the extent of the experimental effort performed up to now.
To illustrate the variety of data, we show in Fig. 40 the extracted PSFs for the 9 Mo isotopes for which data exist. Below the neutron separation energy, deviations between the different Oslo and NRF methods can be observed. These, together with the uncertainties associated to each of these methods, are discussed in Sec. 3.2. NRF measurements usually lead to higher PSFs below , but may be compatible with the Oslo data when all systematic uncertainties are included. A non-negligible spread can also be seen with respect to ARC data, for example for nuclides 96Mo and 98Mo. A relatively satisfactory smooth transition between data below and above the neutron threshold can be observed, despite the MeV energy gap that can exist between PSFs extracted from photonuclear data and other methods.
Recent (p,p′) data for 96Mo Martin17 are seen to bridge this gap around the neutron threshold, and are also found to be in agreement with NRF data. Future analysis of the model-dependent methods could take advantage of this alternative experimental method to further constrain the measurements.
In Fig. 41, we illustrate the available PSF data for 90Zr, 181Ta, 196Pt and 206Pb for which different methods have been used to extract the PSFs. As with the Mo isotopes, discrepancies are observed among the PSFs extracted from NRF, Oslo method, ARC and (p,) methods below . Differences also appear among the many photonuclear data at energies above the GDR peak.
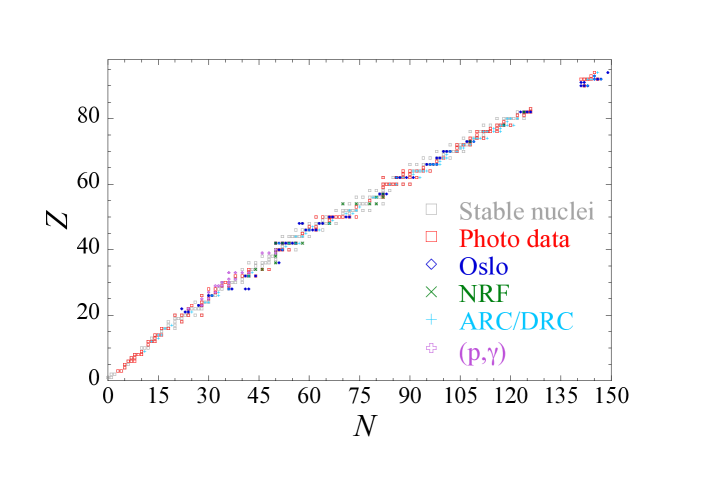
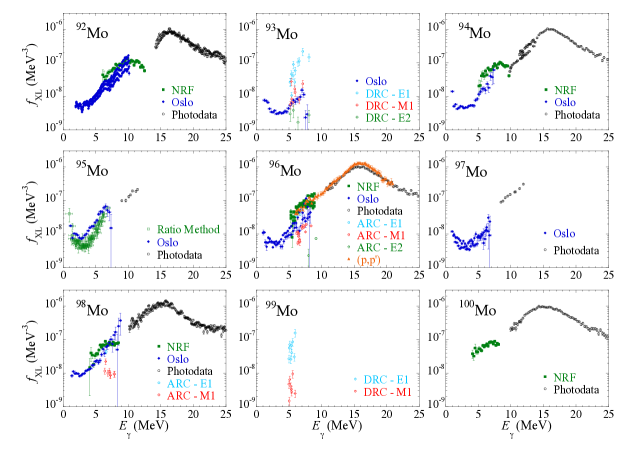
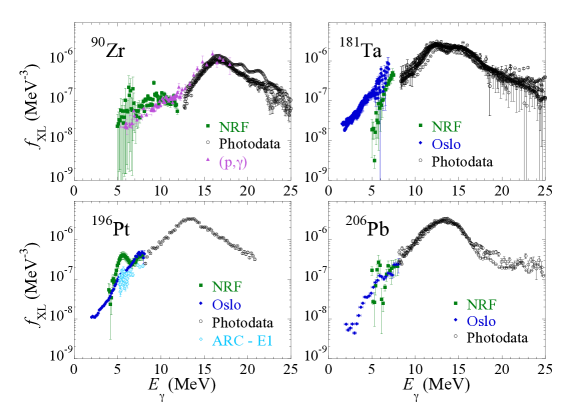
In cases, where multiple measurements yield discrepant PSFs, it is highly desirable to recommend the most reliable data set to the user community. In the particular case of photodata PSFs, several photoabsorption measurements can exist that may lead to rather different PSFs especially at energies above the GDR peak, as illustrated for example by the 181Ta case in Fig. 41. For each nucleus, a single PSF data set is therefore recommended based on the recently re-evaluated photonuclear reaction cross sections Kawano19 . The new evaluations were performed by the CRP for the “Updated IAEA Photonuclear Data Library” Kawano19 . In cases where a CRP evaluation was not performed, the recently published recommendations of Ref. Plujko18 are adopted. These recommendations are based on an assessment of the experimental data using the method of Varlamov et al. Varlamov14 and on systematics of neighbouring nuclei.
As all other methods used to extract PSFs below depend strongly on the models used to calculate input parameters or reference data used for normalization, a full uncertainty analysis is required before an evaluation and recommendation can be made. Such an analysis has only partially been performed within the CRP for 2 cases, 89Y and 139La, for which both NRF and Oslo data exist and the required information was available. Despite the effort however, we were unable to find problems with any of the available data sets and could not reconcile the data within the partial uncertainty ranges. The recommendation of a single data set is thus not possible, with the exception of 74Ge, where both the NRF and Oslo data give compatible results and thus both data files can be recommended to the community. The user is advised to consult the global model calculations described in Sec. 4 which have reasonable predictive power or at least could set the systematic trend. On the other hand, new measurements of the PSF for at least 89Y and 139La are strongly encouraged, using possibly other methods and/or reactions as well, to help resolve the discrepancies observed in these nuclei and many others, and allow us to recommend a unique PSF data set.
6.2 Theoretical PSF database
Calculations of , , and total dipole PSFs have been made using the D1M+QRPA+0lim and SMLO models described in Sec. 4 for all the nuclei for which experimental PSF data sets exist and are compiled in the experimental database as mentioned in the previous section. Globally, both models have proven their capacity to reproduce the bulk of experimental data. As detailed in Sec. 4, while the SMLO PSF has been fitted directly on photoabsorption cross section data, the D1M+QRPA+0lim PSFs have been only globally adjusted. The photoabsorption D1M+QRPA calculations for both the and PSFs are stored in tabulated form in data files per element for energies from 0 to 30 MeV by step of 0.1 MeV. Similarly, the SMLO PSFs have been estimated at 11 different temperatures and tabulated on the same energy grid in separate columns in the data files. The SMLO photoabsorption PSFs, i.e. the sum of scissors and spin-flip modes as given by Eq. 23, are also provided in table format for energies ranging between 0 and 30 MeV. In contrast, the low-energy enhancement for the deexcitation PSF given by Eq. 24 in the SMLO model and for the and PSFs given by Eqs. 25-26 in the D1M+QRPA+0lim are not included in the tabulated files.
6.3 Experimentally unknown nuclei
As shown in Sec. 5, both the SMLO and D1M+QRPA+0lim models of PSF have shown their capability to reproduce experimental data of various sorts. Despite the variety of experimental data on a large number of different species, this information is available only for nuclei within the valley of stability. It is therefore of interest to see to what extent the two models recommended here predict similar PSFs when considering exotic neutron-rich or neutron-deficient nuclei. To illustrate such an extrapolation, we show in Figs. 42 and 43 the and , respectively, photoabsorption PSFs given by the SMLO (at ) and D1M+QRPA models for the even-even Sn isotopes. Note that the low-energy contributions corresponding to the non-zero temperature case for the strength or the upbend component for the strength, are not included in this comparison. The predictions are seen to be rather similar from the most neutron-deficient to the most neutron-rich nuclei. In contrast, the PSFs may somehow differ due to the presence of sharp peaks in the D1M+QRPA approach. However, the overall agreement is rather good as the maximum of the spin-flip mode is at similar energies. Since the Sn isotopic chain is dominantly spherical, we also show in Fig. 44 a similar comparison of PSFs between the SMLO and D1M+QRPA models but this time for the rather deformed isotopic chain of Yb (). Globally, both the scissors and spin-flip modes give rise to a total PSF that is quite similar for both models, even for the most neutron-deficient 160Yb and most neutron-rich 218Yb nuclei. Both SMLO and D1M+QRPA strengths are not fully independent since the and dependence in the SMLO model has been inspired by the D1M+QRPA systematics Goriely18b (see Sec. 4.2). Figs. 43-44 illustrate the efficiency of the SMLO to describe in a simple phenomenological model the global trends obtained by the microscopic D1M+QRPA model.
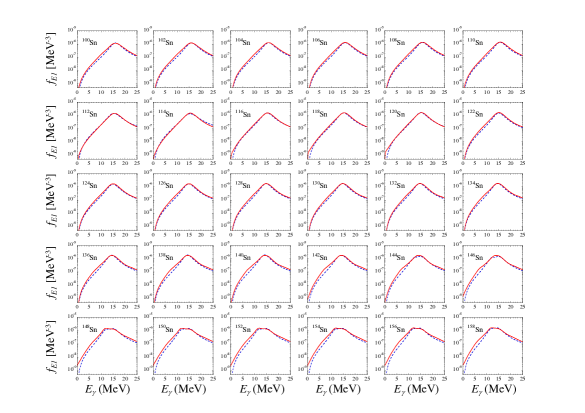
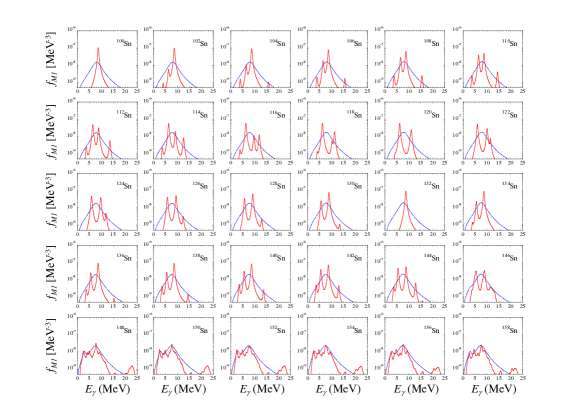
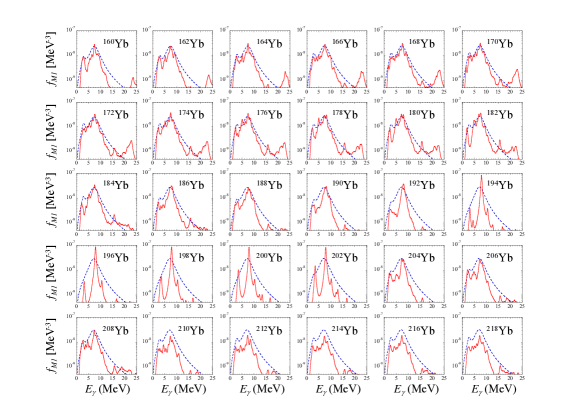
To further illustrate the potential impact of the differences between the SMLO and D1M+QRPA+0lim PSFs, we compare in Fig. 45 the radiative neutron capture MACS obtained with both models. The MACS are calculated with the TALYS reaction code at a temperature of K relevant in nucleosynthesis applications. More specifically, the ratio between both MACS are plotted and seen to lie within a factor of 2 for the vast majority of nuclei lying between the proton and the neutron drip lines.
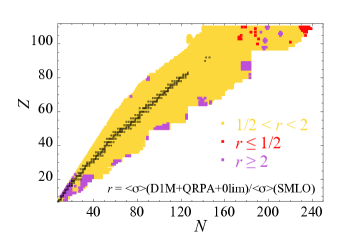
The database contains and PSFs calculated with the D1M+QRPA+0lim model for 7380 nuclei with from the proton to the neutron drip lines, and correspondingly, SMLO and PSFs are available for 8980 nuclei with . The data files have the same format as described in Sec. 6.2.
6.4 Database interface
All the PSF data files contained in the IAEA PSF database can be accessed through an online interface at www-nds.iaea.org/PSFdatabase. The interface offers the possibility to filter the database by nucleus and method. The selected data files, experimental or theoretical can be downloaded and plotted on-the-fly. The entire content of the experimental or theoretical database can also be downloaded in a compressed folder.
7 Conclusions
The present contribution summarizes a coordinated and systematic effort to compile and assess all the existing experimental data on PSFs extracted from many different experimental techniques at -ray energies below about 20 MeV. Further, two PSF models, one of them purely phenomenological, the other one semi-microscopic, have been systematically compared with all experimental data available and are recommended to globally describe the and PSFs for nuclei between the proton and neutron drip lines.
The CRP has produced a complete and comprehensive compilation of experimental PSFs. The different methods that are used to extract PSF data from photon-, neutron, and charged-particle-induced reactions have been described and assessed. Photonuclear PSFs have been recommended on the basis of a separate re-evaluation of photonuclear data performed within the CRP leading to a new IAEA photonuclear data library Kawano19 . For the other methods used to extract PSFs below the neutron separation energy , where there is only one measurement available, then that data set is recommended to the user. In cases where more than one different method was used to measure the PSFs, however, it was not possible to evaluate systematically the data due to lack of sufficient information on the model-dependent uncertainties that are inherent to all the considered methods. As all of these methods depend strongly on model calculations for normalization and/or disentanglement from level densities, a full uncertainty analysis taking into account the impact of the various models and parameter uncertainties is a prerequisite for an evaluation to be performed. In the absence of such a full uncertainty analysis, or in the presence of only a partial analysis as the one mentioned below, we are unable to recommend experimental PSF data below the neutron separation energies in cases where the different methods provide discrepant results.
The partial uncertainty analysis performed in both the NRF and Oslo methods on two cases, 89Y and 139La, has led to the realization that there is a problem with the data of 139La so this nuclide needs to be re-measured while for 89Y both methods agree within the uncertainties for most part of the energy region, except for the energies around 6.5 MeV. It is plausible that if a full uncertainty analysis had been performed for 89Y, both data sets would have been in agreement within the uncertainties in the whole energy range. One major conclusion of this work is that proper consideration and documentation of all the sources of uncertainties including model-dependent ones, is needed when comparing the different experimental techniques and trying to recommend the best data. It is therefore a strong recommendation of this CRP that a standardisation of the treatment of uncertainties and model dependencies for all the methods affected by them should be a priority for the scientific community involved actively in measurements of PSFs below . Establishing and promoting ’best practices’ in extracting PSFs from raw data will allow the present and future generation of experimentalists to produce consistent data that can be fully exploited in basic and applied sciences.
With the existing information at hand, we can at best propose new measurements for cases with discrepant data, using more than one method if possible and combining with a full uncertainty analysis, to allow for verification of the results and a better understanding of the methods and the part of the electromagnetic response they probe.
Global semi-microscopic (D1M+QRPA+0lim) and empirical (SMLO) models have been developed for electric and magnetic dipole PSFs. Both models have been compared with the existing experimental data as well as other indirect methods based on neutron capture spectra (singles or coincident ones). The global models have also been validated against measured average radiative widths and Maxwellian-averaged cross sections. As a result, they are expected to perform reasonably well when extrapolated to unknown nuclei and could also be used as a guide in cases where the existing experimental data are discrepant. However, it is clear from the global comparisons that these models also have some limitations and that going beyond the QRPA is the direction to take in the future.
The PSF database, complete with compilation, recommendations and global calculations, is readily available to the broad scientific community at the online IAEA server (URL:www-nds.iaea.org/PSFdatabase).
Acknowledgements.
This work was performed within the IAEA CRP on “Updating the Photonuclear Data Library and Generating a Reference Database for Photon Strength Functions” (F41032). Contributors from the following institutes are grateful to the IAEA for financial support within the CRP: CIAE, KAERI, IFIN-HH, Taras Shevchenko National University, Lomonosov Moscow State University, Centre for Energy Research (HAS), Charles University (Prague), and iThemba LABS. We wish to thank A.J. Koning, P. Obložinský, A.C. Larsen, K.L. Malatji, A. Tonchev, M. Guttormsen, V. Ingeberg, P. von Neumann-Cosel, G. M. Tveten, T. Renstrøm, R. Capote, O. Gorbachenko, K. Solodovnyk and Yuan Tian for fruitful discussions and for providing relevant material and data. This work was also partially supported by the Fonds de la Recherche Scientifique - FNRS and the Fonds Wetenschappelijk Onderzoek - Vlaanderen (FWO) under the EOS Project No O022818F, by the National Research Foundation of South Africa Grant No 118846, by the Czech Science Foundation Grant No. 19-14048S, the Research Council of Norway under the Project Grant No 263030, and the EU FP7 CHANDA project No 605203 for (n,) measurements. H.U. acknowledges support extended to the PHOENIX collaboration for the IAEA CRP by the Premier Project of Konan University.References
- (1) IAEA, TECDOC-1178 (2000)
- (2) R. Capote, M. Herman, P. Obložinský, P. Young, S. Goriely, T. Belgya, A. Ignatyuk, A. Koning, S. Hilaire, V. Plujko et al., Nuclear Data Sheets 110, 3107 (2009)
- (3) EGAF, https://www-nds.iaea.org/pgaa/egaf.html (2018)
- (4) ENSDF, http://www.nndc.bnl.gov/ensdf/ (2018)
- (5) A. Trkov, M. Herman, D.A. Brown, Tech. rep., Report BNL-90365-2009 Rev.2, BNL, USA (2011)
- (6) M. Harakeh, A. van der Woude, Giant resonances (Oxford University Press, 2001)
- (7) D. Brink, Ph.D. thesis, University of Oxford (1955)
- (8) P. Axel, Phys.Rev. 126, 671 (1962)
- (9) S. Kadmenskii, V. Markushev, V. Furmann, Sov. J. Nucl. Phys. 37, 165 (1983)
- (10) V. Plujko, Nucl. Phys. A 649, 209c (1999)
- (11) L. Bollinger, G. Thomas, Phys. Rev. Lett. 18, 1143 (1967)
- (12) L. Bollinger, G. Thomas, Phys. Rev. C 2, 1951 (1970)
- (13) G. Szeflinska, Z. Szeflinski, Z. Wilhelmi, Nucl. Phys. A 323, 253 (1979)
- (14) Z. Szefliński, G. Szeflińska, Z. Wilhelmi, T. Rzaca-Urban, H. Klapdor, E. Anderson, K. Grotz, J. Metzinger, Phys. Lett. B 126, 159 (1983)
- (15) B. Erlandsson, K. Nilson, A. Marcinkowski, Nucl. Phys. A 329, 1 (1979)
- (16) R. Alarcon, R.M. Laszewski, A. Nathan, S. Hoblit, Phys. Rev. C 36, 954 (1987)
- (17) M. Krtička, F. Bečvář, J. Honzátko, I. Tomandl, M. Heil, F. Käppeler, R. Reifarth, F. Voss, K. Wisshak, Phys. Rev. Lett. 92, 172501 (2004)
- (18) M.. Guttormsen, T. Tveter, L. Bergholt, F. Ingebretsen, J. Rekstad, Nucl. Instrum. Methods Phys. Res. A 374, 371 (1996)
- (19) M. Guttormsen, A. Larsen, A. Görgen, T. Renstrøm, S. Siem, T. Tornyi, G. Tveten, Phys. Rev. Lett. 116, 012502 (2016)
- (20) D. Martin, P. von Neumann-Cosel, A. Tamii, N. Aoi, S. Bassauer, C.A. Bertulani, J. Carter, L. Donaldson, H. Fujita, Y. Fujita et al., Phys. Rev. Lett. 119 (2017)
- (21) C.T. Angell, S.L. Hammond, H.J. Karwowski, J.H. Kelley, M. Krtička, E. Kwan, A. Makinaga, G. Rusev, Phys. Rev. C 86, 051302(R) (2012)
- (22) J. Isaak, D. Savran, M. Krtička, M. Ahmed, J. Beller, E. Fiori, J. Glorius, J.H. Kelley, B. Loher, N. Pietralla et al., Phys. Lett. B 727, 361 (2013)
- (23) J. Isaak, D. Savran, B. Löher, T.Beck, M. Bhike, U. Gayer, Krishichayan, N. Pietralla, M. Scheck, W. Tornow et al., Phys. Lett. B 788, 225 (2019)
- (24) G.A. Bartholomew, E.D. Earle, A.J. Ferguson, J.W. Knowles, M. Lone, Adv. Nuclear Phys. 7, 229 (1973)
- (25) J. Kopecky, M. Uhl, Phys. Rev. C 41, 1941 (1990)
- (26) P. Dimitriou, R. Firestone, S. Siem, Tech. Rep. INDC(NDS)-0649, International Atomic Energy Agency, Vienna, Austria (2013), https://www-nds.iaea.org/publications/indc /indc-nds-0649.pdf
- (27) P. Dimitriou, R.B. Firestone, S. Siem, F. Bečvář, M. Krtička, V.V. Varlamov, M. Wiedeking, EPJ Web of Conferences 93, 06004 (2015)
- (28) P. Dimitriou, T. Belgya, Y.S. Cho, D. Filipescu, R. Firestone, S. Goriely, N. Iwamoto, T. Kawano, J. Kopecky, M. Krtička et al., EPJ Web of Conferences 178, 06005 (2018)
- (29) S. Goriely, P. Dimitriou, Tech. Rep. INDC(NDS)-0712, International Atomic Energy Agency, Vienna, Austria (2016), https://www-nds.iaea.org/publications/indc /indc-nds-0712.pdf
- (30) S. Goriely, M. Wiedeking, P. Dimitriou, Tech. Rep. INDC(NDS)-0745, International Atomic Energy Agency, Vienna, Austria (2018), https://www-nds.iaea.org/publications/indc /indc-nds-0745.pdf
- (31) M. Wiedeking, D. Filipescu, P. Dimitriou, Tech. Rep. INDC(NDS)-0777, International Atomic Energy Agency, Vienna, Austria (2019), https://www-nds.iaea.org/publications/indc /indc-nds-0777.pdf
- (32) U. Kneissl, N. Pietralla, A. Zilges, J. Phys. G: Nucl. Part. Phys. 32, R217 (2006)
- (33) K. Heyde, P. von Neumann-Cosel, A. Richter, Rev. Mod. Phys. p. 2365 (2010)
- (34) H.R. Weller, M.W. Ahmed, H. Gao, W. Tornow, Y.K. Wu, M. Gai, R. Miskimen, Prog. Part. Nucl. Phys. 62, 257 (2009)
- (35) A.P. Tonchev, S.L. Hammond, J.H. Kelley, E. Kwan, H. Lenske, G. Rusev, W. Tornow, N. Tsoneva, Phys. Rev. Lett. 104, 072501 (2010)
- (36) R. Massarczyk, G. Rusev, R. Schwengner, F. Dönau, C. Bhatia, M.E. Gooden, J.H. Kelley, A.P. Tonchev, W. Tornow, Phys. Rev. C 90, 054310 (2014)
- (37) B. Löher, D. Savran, T. Aumann, J. Beller, M. Bhike, N. Cooper, V. Derya, M. Duchene, J. Endres, A. Hennig et al., Phys. Lett. B 756, 72 (2016)
- (38) J. Wilhelmy, B.A. Brown, P. Erbacher, U. Gayer, J. Isaak, Krishichayan, B. Löher, M. Müscher, H. Pai, N. Pietralla et al., Phys. Rev. C 98, 034315 (2018)
- (39) R. Schwengner, R. Beyer, F. Dönau, E. Grosse et al., Nucl. Instrum. Methods Phys. Res. A 555, 211 (2005)
- (40) G. Rusev, R. Schwengner, F. Dönau, M. Erhard, E. Grosse, A.R. Junghans, K. Kosev, N. Kostov, K.D. Schilling, A. Wagner et al., Phys. Rev. C 77, 064321 (2008)
- (41) R. Massarczyk, R. Schwengner, F. Dönau, E. Litvinova, G. Rusev, R. Beyer, R. Hannaske, A. Junghans, M. Kempe, J.H. Kelley et al., Phys. Rev. C 86, 014319 (2012)
- (42) F. Bečvář, Nucl. Instrum. Methods Phys. Res. A 417, 434 (1998)
- (43) M. Krtička, F. Bečvář, S. Valenta, Nucl. Instrum. Methods Phys. Res. A, in preparation (2019)
- (44) S. Agostinelli, J. Allison, K. Amako, J. Apostolakis, H. Araujo, P. Arce, M. Asai, D. Axen, S. Banerjee, G. Barrand et al., Nuclear Instruments and Methods in Physics Research A 506, 250 (2003)
- (45) A. Schiller, L. Bergholt, M. Guttormsen, E. Melby, J. Rekstad, S. Siem, Nucl. Instrum. Methods Phys. Res., Sect. A 447, 498 (2000)
- (46) M. Guttormsen, T. Tveter, L. Bergholt, F. Ingebretsen, J. Rekstad, Nucl. Instrum. Methods Phys. Res., Sect. A 374, 371 (1996)
- (47) M. Guttormsen, T. Ramsøy, J.Rekstad, Nucl. Instum. Methods Phys. Res., Sect. A 255, 518 (1987)
- (48) A.C. Larsen, M. Guttormsen, M. Krtička, E. Běták, A. Bürger, A. Görgen, H.T. Nyhus, J. Rekstad, A. Schiller, S. Siem et al., Phys. Rev. C 83, 034315 (2011)
- (49) A. Gilbert, A.G.W. Cameron, Can. J. Phys. 43, 1446 (1965)
- (50) A. Voinov, M. Guttormsen, E. Melby, J. Rekstad, A. Schiller, S. Siem, Phys. Rev. C 63, 044313 (2001)
- (51) C. Brits, K. Malatji, M. Wiedeking, B. Kheswa, S. Goriely, F. Bello Garrote, D. Bleuel, F. Giacoppo, A. Gorgen, M. Guttormsen et al., Phys. Rev. C (submitted) (2019)
- (52) B.V. Kheswa, M. Wiedeking, J.A. Brown, A.C. Larsen, S. Goriely, M. Guttormsen, F.L. Bello Garrote, L.A. Bernstein, D.L. Bleuel, T.K. Eriksen et al., Phys. Rev. C 95, 045805 (2017)
- (53) A.C. Larsen, M. Guttormsen, R. Schwengner, D.L. Bleuel, S. Goriely, S. Harissopulos, F.L. Bello Garrote, Y. Byun, T.K. Eriksen, F. Giacoppo et al., Phys. Rev. C 93, 045810 (2016)
- (54) A. Spyrou, S.N. Liddick, A.C. Larsen, M. Guttormsen, K. Cooper, A.C. Dombos, D.J. Morrissey, F. Naqvi, G. Perdikakis, S.J. Quinn et al., Phys. Rev. Lett. 113, 232502 (2014)
- (55) A. Spyrou, A.C. Larsen, S.N. Liddick, F. Naqvi, B.P. Crider, A.C. Dombos, M. Guttormsen, D.L. Bleuel, A. Couture, L.C. Campo et al., J. Phys. G: Nucl. Part. Phys. 44, 044002 (2017)
- (56) A.C. Larsen, J.E. Midtbø, M. Guttormsen, T. Renstrøm, S.N. Liddick, A. Spyrou, S. Karampagia, B.A. Brown, O. Achakovskiy, S. Kamerdzhiev et al., Phys. Rev. C 97, 054329 (2018)
- (57) V. Ingeberg, Master thesis, University of Oslo (2016)
- (58) C. Porter, R. Thomas, Phys. Rev. 104, 483 (1956)
- (59) J. Kopecky, INDC(NED) 013 (2016)
- (60) J. Kopecky, S. Goriely, S. Péru, S. Hilaire, M. Martini, Phys. Rev. C 95, 054317 (2017)
- (61) J. Kopecky, INDC(NDS) 0738 (2017)
- (62) J. Kopecky, INDC(NDS) 0772 (2018)
- (63) C. McCullagh, Ph.D. thesis, Stony Brook (1979)
- (64) C. McCullagh, M. Stelts, R. Chrien, Phys. Rev. C 23, 1394 (1981)
- (65) J. Kopecky, M. Uhl, Tech. Rep. 103, ECN-RX-94-103 (1994)
- (66) L. Rosta, L. Cser, Z. Révay, Applied Physics A: Materials Science and Processing 74, 292 (2002)
- (67) Z. Révay, Journal of large-scale research facilities 1, 20 (2015)
- (68) Z. Révay, G. Molnár, Radiochim Acta 91, 361 (2003)
- (69) R. Firestone, K. Abusaleem, M. Basunia, F. Bečvář, T. Belgya, L. Bernstein, H. Choi, J. Escher, C. Genreith, A. Hurst et al., Nuclear Data Sheets 119, 79 (2014)
- (70) M. Wiedeking, L.A. Bernstein, M. Krtička, D.L. Bleuel, J.M. Allmond, M.S. Basunia, J.T. Burke, P. Fallon, R.B. Firestone, B.L. Goldblum et al., Phys. Rev. Lett. 108, 162503 (2012)
- (71) M.D. Jones, A.O. Macchiavelli, M. Wiedeking, L.A. Bernstein, H.L. Crawford, C.M. Campbell, R.M. Clark, M. Cromaz, P. Fallon, I.Y. Lee et al., Phys. Rev. C 97, 024327 (2018)
- (72) M. Krtička, M. Wiedeking, F. Bečvář, S. Valenta, Phys. Rev. C 93, 054311 (2016)
- (73) A. Tamii, Y. Fujita, H. Matsubara, T. Adachi, J. Carter, M. Dozono, H. Fujita, K. Fujita, H. Hashimoto, K. Hatanaka et al., Nucl. Instr. Meth. Phys. Res. A 605, 326 (2009)
- (74) A. Tamii, I. Poltoratska, P. von Neumann-Cosel, Y. Fujita, T. Adachi, C.A. Bertulani, J. Carter, M. Dozono, H. Fujita, K. Fujita et al., Phys. Rev. Lett. 107 (2011)
- (75) I. Poltoratska, P. von Neumann-Cosel, A. Tamii, T. Adachi, C.A. Bertulani, J. Carter, M. Dozono, H. Fujita, K. Fujita, Y. Fujita et al., Phys. Rev. C 85, 041304 (2012)
- (76) C. Bertulani, G. Baur, Phys. Rep. 163, 299 (1988)
- (77) J. Birkhan, H. Matsubara, P. von Neumann-Cosel, N. Pietralla, V.Y. Ponomarev, A. Richter, A. Tamii, J. Wambach, Phys. Rev. C 93, 041302 (2016)
- (78) M. Mathy, J. Birkhan, H. Matsubara, P. von Neumann-Cosel, N. Pietralla, V.Y. Ponomarev, A. Richter, A. Tamii, Phys. Rev. C 95, 054316 (2017)
- (79) D. Frekers, H. Wortche, A. Richter, R. Abegg, R. Azuma, A. Celler, C. Chan, T. Drake, R. Helmer, K. Jackson et al., Phys. Lett. B 244, 178 (1990)
- (80) EXFOR, Experimental nuclear reaction data (2017), https://www-nds.iaea.org/exfor
- (81) K. Shoda, K. Abe, T. Ishizuka, N. Kawamura, M. Kimura, J. Phys. Soc. Japan 17, 735 (1962)
- (82) B.S.Ishkhanov, I. Kapitonov, I. Piskarev, V. Shevchenko, O. Shevchenko, Soviet Journal of Nucl. Phys. 11, 272 (1970)
- (83) V. Varlamov, M. Stepanov, V. Chesnokov, Jour. Bull. Russian Academy of Sciences 67, 723 (2003)
- (84) V. Varlamov, B. Ishkhanov, V. Orlin, K.A.Stopan, Eur. Phys. J. A 50, 114 (2014)
- (85) A. Banu, E. Meekins, J. Silano, H.J. Karwowski, S. Goriely, Phys. Rev. C 99, 025802 (2019)
- (86) T. Kawano et al., Nuclear Data Sheets, in preparation (2019)
- (87) T. Belgya, L. Szentmiklósi, R. Massarczyk, R. Schwengner, A. Junghans, E. Grosse, High-resolution study of the 113Cd(n, ) spectrum by statistical decay model with discrete levels and transitions, in EPJ Web of Conferences (2017), Vol. 146, ISBN 9782759890200, ISSN 2100014X
- (88) T. Belgya, L. Szentmiklosi, R. Massarczyk, R. Schwengner, G. Schramm, E. Birgersson, A. Junghans, Strength function from the 113Cd(n,) reaction, in Proceedings of the European Research Infrastructures for Nuclear Data Applications (ERINDA) workshop (2014)
- (89) J. Honzátko, K. Konečný, I. Tormandl, J. Vacik, F. Bečvář, P. Cejnar, Nucl. Instrum. Methods Phys. Res. A 376, 434 (1996)
- (90) M. Krtička, F. Bečvář, I. Tomandl, G. Rusev, U. Agvaanluvsan, G.E. Mitchell, Phys. Rev. C 77 (2008)
- (91) S. Valenta, F. Bečvář, J. Kroll, M. Krtička, I. Tomandl, Phys. Rev. C 92, 064321 (2015)
- (92) A. Bogdzel et al., JINR reprint 62, P15 (1982)
- (93) S.A. Sheets, U. Agvaanluvsan, J.A. Becker, F. Bečvář, T.A. Bredeweg, R.C. Haight, M. Jandel, M. Krtička, G.E. Mitchell, J.M. O’Donnell et al., Phys. Rev. C 79, 024301 (2009)
- (94) S. Valenta, B. Baramsai, T. Bredeweg, A. Couture, A. Chyzh, M. Jandel, J. Kroll, M. Krtička, G. Mitchell, J. O’Donnell et al., Phys. Rev. C 96, 054315 (2017)
- (95) M. Heil, R. Reifarth, M. Fowler, R. Haight, F. Kappeler, R. Rundberg, E. Seabury, J. Ullmann, J. Wilhelmy, K. Wisshak, Nucl. Instrum. Methods Phys. Res. A 459, 229 (2001)
- (96) R. Reifarth, T. Bredeweg, A. Alpizar-Vicente, J. Browne, E. Esch, U. Greife, R. Haight, R. Hatarik, A. Kronenberg, J. O’Donnell et al., Nucl. Instrum. Methods Phys. Res. A 531, 530 (2004)
- (97) A. Voinov, S.M. Grimes, C.R. Brune, M. Guttormsen, A.C. Larsen, T.N. Massey, A. Schiller, S. Siem, Phys. Rev. C 81, 024319 (2010)
- (98) C.L. Walker, M. Krtička, B. Baramsai, F. Bečvář, T.A. Bredeweg, A. Chyzh, R.C. Haight, M. Jandel, J. Kroll, G.E. Mitchell et al., Phys. Rev. C 92, 014324 (2015)
- (99) S.F. Mughabghab, Atlas of neutron resonances: resonance parameters and thermal cross sections Z=1-100 (Elsevier, 2006), ISBN 9780080461069
- (100) S. Goriely, S. Hilaire, A.J. Koning, Astron. Astrophys 487, 767 (2008)
- (101) A.J. Koning, D. Rochman, Nuclear Data Sheets 113, 2841 (2012)
- (102) I. Dillmann, M. Heil, F. Käppeler, R. Plag, T. Rauscher, F.K. Thielemann, AIP Conf. Proc. 819, 123 (2006)
- (103) I. Dillmann, T. Szücs, R. Plag, Z. Fülöp, F. Käppeler, A. Mengoni, T. Rauscher, Nuclear Data Sheets 120, 171 (2014)
- (104) R. Firestone, A new formulation of the nuclear level density by spin and parity (2017), http://tid.uio.no/workshop2017/talks/ OsloWS17_Firestone.pdf
- (105) S. Bassauer, P. von Neumann-Cosel, A. Tamii, Phys. Rev. C 94 (2016)
- (106) V. Plujko, O. Gorbachenko, R. Capote, P. Dimitriou, At. Data Nucl. Data Tables 123, 1 (2018)
- (107) H. Utsunomiya, A. Makinaga, S. Goko, T. Kaihori, H. Akimune, T. Yamagata, M. Ohta, H. Toyokawa, S. Muller, Y.W. Lui et al., Phys. Rev. C 74, 025806 (2006)
- (108) T. Deague, R. Stewart, Nucl. Phys. A 191, 305 (1972)
- (109) H. Beil, R. Bergère, P. Carlos, A.L. etre, A. Veyssiere, A. Parlag, Nucl. Phys. A 172, 426 (1971)
- (110) R. Bergère, Nucl. Phys. A 121, 463 (1968)
- (111) H. Utsunomiya, H. Akimune, S. Goko, M. Ohta, H. Ueda, T. Yamagata, H.O. K. Yamasaki, H. Toyokawa, Y.W. Lui, T. Hayakawa et al., Phys. Rev. C 67, 015807 (2003)
- (112) G. Gurevich, L. Lazareva, V. Mazur, S. Merkulov, G. Solodukhov, V. Tyutin, Nucl. Phys. A 351, 257 (1983)
- (113) R.L. Bramblett, J.T. Caldwell, G.F. Auchampaugh, S. Fultz, Phys. Rev. 129, 2723 (1963)
- (114) S. Fultz, B. Berman, J. Caldwell, R. Bramblett, M. Kelly, Phys. Rev. 186, 1255 (1969)
- (115) A. Leprêtre, H. Beil, R. Bergère, P. Carlos, A.D. Miniac, A. Veyssiere, K. Kernbach, Nucl. Phys. A 219, 39 (1974)
- (116) A. Makinaga, R. Schwengner, G. Rusev, F. Dönau, S. Frauendorf, D. Bemmerer, R. Beyer, P. Crespo, M. Erhard, A. Junghans et al., Phys. Rev. C 82, 024314 (2010)
- (117) A.J. Koning, S. Hilaire, S. Goriely, Nucl. Phys. A 810, 13 (2008)
- (118) M. Chadwick, P. Obložinský, P. Hodgson, G. Reffo, Phys. Rev. C 44, 814 (1991)
- (119) T. von Egidy, D. Bucurescu, Phys. Rev. C 80, 054310 (2009)
- (120) N. Benouaret, R. Schwengner, G. Rusev, F. Dönau, R. Beyer, M. Erhard, E. Grosse, A. Junghans, K. Kosev, C. Nair et al., Phys. Rev. C 79, 014303 (2009)
- (121) Oslo database, Level densities and gamma-ray strength functions (2017), http://www.mn.uio.no/fysikk/english/ research/about/infrastructure/OCL/ nuclear-physics-research/compilation/
- (122) S.F. Mughabghab, Atlas of Neutron Resonances: Volume 1: Resonance Properties and Thermal Cross Sections Z= 1-60., Atlas of Neutron Resonances, sixth edn. (Elsevier Science, 2018), ISBN 9780444637697
- (123) G.M. Tveten, T.R. m, A.C. Larsen, H. Utsunomiya et al., Phys. Rev. C (submitted) (2019)
- (124) F. Zeiser, G. Potel, G. Tveten, A. Larsen, M. Guttormsen, T. Laplace, S. Siem, D. Bleuel, B. Goldblum, L. Bernstein et al., arXiv:1902.02966 (2019)
- (125) B. Berman, J. Caldwell, R. Harvey, M. Kelly, R. Bramblett, S. Fultz, Phys. Rev. 162, 1098 (1967)
- (126) A. Leprêtre, H. Beil, R. Bergère, P. Carlos, A. Veyssiere, M. Sugawara, Nucl. Phys. A 175, 609 (1971)
- (127) S. Goriely, S. Hilaire, A.J. Koning, Phys. Rev. C 78, 064307 (2008)
- (128) T. von Egidy, D. Bucurescu, Phys. Rev. C 72, 044311 (2005)
- (129) K. Sieja, Phys. Rev. C 98, 064312 (2018)
- (130) T. von Egidy, D. Bucurescu, Phys. Rev. C 73, 049901(E) (2006)
- (131) T. Renstrøm, H.T. Nyhus, H. Utsunomiya, R. Schwengner, S. Goriely, A.C. Larsen, D.M. Filipescu, I. Gheorghe, L.A. Bernstein, D.L. Bleuel et al., Phys. Rev. C 93, 064302 (2016)
- (132) R. Massarczyk, R. Schwengner, L.A. Bernstein, M. Anders, D.Bemmerer, R. Beyer, Z. Elekes, R. Hannaske, A.R. Junghans, T. Kogler et al., Phys. Rev. C 92, 044309 (2015)
- (133) B. Berman, At. Data Nucl. Data Tables 15, 319 (1975)
- (134) D. Gardner, Neutron Radiative Capture, in Neutrons Physics and Nuclear Data in Science and Technology, edited by A. Michaudon, S. Cierjacks, R. Chrien (Pergamon Press, Oxford, New York, 1984), Vol. 3, pp. 62–118
- (135) V.A. Plujko, I.M. Kadenko, O.M. Gorbachenko, E.V. Kulich, Internat. J. Modern Phys. E 17, 240 (2008)
- (136) C.B. Dover, R. Lemmer, F. Hahne, Ann. Phys. 70, 458 (1972)
- (137) Y. Alhassid, B. Busch, S. Levit, Phys. Rev. Lett. 61, 1926 (1988)
- (138) Y. Alhassid, B. Busch, Nucl. Phys. A 509, 461 (1990)
- (139) E. Grosse, A. Junghans, R. Massarczyk, Eur. Phys. J. A 53, 225 (2017)
- (140) B.J. Allen, I. Bergqvist, R.E. Chrien, D. Gardner, W. Poenitz, Neutron Radiative Capture (Pergamon, New York, 1982)
- (141) S. Kamerdzhiev, J. Speth, G. Tertychny, Phys. Rep. 393, 1 (2004)
- (142) S. Goriely, Phys. Lett. B 436, 10 (1998)
- (143) V. Plujko, R. Capote, O. Gorbachenko, At. Data Nucl. Data Tables 97, 567 (2011)
- (144) G. Schramm, R. Massarczyk, A.R. Junghans, T. Belgya, R. Beyer, E. Birgersson, E. Grosse, M. Kempe, Z. Kis, K. Kosev et al., Phys. Rev. C 85, 014311 (2012)
- (145) M.R. Mumpower, T. Kawano, J.L. Ullmann, M. Krtička, T.M. Sprouse, Phys. Rev. C 96, 024612 (2017)
- (146) S. Goriely, V. Plujko, Phys. Rev. C 99, 014303 (2018)
- (147) D. Savran, M. Elvers, J. Endres, M. Fritzsche, B. Löher, N. Pietralla, V.Y. Ponomarev, C. Romig, L. Schnorrenberger, K. Sonnabend et al., Phys. Rev. C 84, 024326 (2011)
- (148) D. Savran, T. Aumann, A. Zilges, Prog. Part. Nucl. Phys. 70, 210 (2013)
- (149) W. Myers, W. Swiatecki, T. Kodama, L.J. El-Jaick, E.R. Hilf, Phys. Rev. C 15, 2032 (1977)
- (150) G. Bertsch, Phys. Rev. Lett. 13, 121 (1973)
- (151) K. Liu, G. Borwn, Nucl. Phys. A 265, 385 (1976)
- (152) J. Blaizot, D. Gogny, Nucl. Phys. A 284, 429 (1977)
- (153) E. Khan, N. Van Giai, M. Grasso, Nucl. Phys. A 731, 311 (2004)
- (154) S. Péru, H. Goutte, Phys. Rev. C 77, 044313 (2008)
- (155) R. Schwengner, G. Rusev, N. Tsoneva, N. Benouaret, R. Beyer, M. Erhard, E. Grosse, A.R. Junghans, J. Klug, K. Kosev et al., Phys. Rev. C 78, 064314 (2008)
- (156) S. Péru, G. Gosselin, M. Martini, M. Dupuis, S. Hilaire, J.C. Devaux, Phys. Rev. C 83, 014314 (2011)
- (157) M. Martini, S. Péru, S. Hilaire, S. Goriely, F. Lechaftois, Phys. Rev. C 94, 014304 (2016)
- (158) N.N. Arsenyev, A.P. Severyukhin, V.V. Voronov, N. Van Giai, Phys. Rev. C 95, 054312 (2017)
- (159) I. Deloncle, S. Péru, M. Martini, Eur. Phys. J. A 53, 170 (2017)
- (160) G. Colò, P.F. Bortignon, Nucl. Phys. A 696, 427 (2001)
- (161) D. Sarchi, P. Bortignon, G. Colò, Phys. Lett. B 601, 27 (2004)
- (162) N. Tsoneva, H. Lenske, Phys. Rev. C 77, 024321 (2008)
- (163) P. Papakonstantinou, R. Roth, Phys. Lett. B 671, 356 (2009)
- (164) P. Papakonstantinou, H. Hergert, V. Ponomarev, R. Roth, Phys. Lett. B 709, 270 (2012)
- (165) P. Papakonstantinou, H. Hergert, R. Roth, Phys. Rev. C 92, 034311 (2015)
- (166) A. Avdeenkov, S. Goriely, S. Kamerdzhiev, S. Krewald, Phys. Rev. C 83, 064316 (2011)
- (167) O. Achakovskiy, A. Avdeenkov, S. Goriely, S. Kamerdzhiev, S. Krewald, Phys. Rev. C 91, 034620 (2015)
- (168) D. Gambacurta, M. Grasso, O. Vasseur, Phys. Lett. B 777, 163 (2018)
- (169) D. Vretenar, N. Paar, P. Ring, G. Lalazissis, Nucl. Phys. A 692, 496 (2001)
- (170) P. Ring, Z.Y. Ma, N. Van Giai, D. Vretenar, A. Wandelt, L.G. Cao, Nucl. Phys. A 694, 249 (2001)
- (171) Z.Y. Ma, A. Wandelt, N. Van Giai, D. Vretenar, P. Ring, L. Cao, Nucl. Phys. A 703, 222 (2002)
- (172) P. Ring, E. Litvinova, T. Nikšić, N. Paar, D. Peña Arteaga, V. Tselyaev, D. Vretenar, Nucl. Phys. A 788, 194 (2007)
- (173) D. Peña Arteaga, P. Ring, Phys. Rev. C 77, 034317 (2008)
- (174) I. Daoutidis, S. Goriely, Phys. Rev. C 86, 034328 (2012)
- (175) E. Litvinova, N. Belov, Phys. Rev. C 88, 031302(R) (2013)
- (176) E. Litvinova, P. Ring, V. Tselyaev, Phys. Rev. C 88, 044320 (2013)
- (177) I. Egorova, E. Litvinova, Phys. Rev. C 94, 034322 (2016)
- (178) D.I. Sober, B.C. Metsch, W. Knüpfer, G. Eulenberg, G. Küchler, A. Richter, E. Spamer, W. Steffen, Phys. Rev. C 31, 2054 (1985)
- (179) P. von Neumann-Cosel, A. Poves, J. Retamosa, A. Richter, Phys. Lett. B 443, 1 (1998)
- (180) E. Caurier, G. Martínez-Pinedo, F. Nowacki, A. Poves, A.P. Zuker, Rev. Mod. Phys. 77, 427 (2005)
- (181) H.P. Loens, K. Langanke, G. Martínez-Pinedo, K. Sieja, Eur. Phys. J. A 48, 34 (2012)
- (182) R. Schwengner, S. Frauendorf, A.C. Larsen, Phys. Rev. Lett. 111, 232504 (2013)
- (183) R. Schwengner, S. Frauendorf, B.A. Brown, Phys. Rev. Lett. 118, 092502 (2017)
- (184) B.A. Brown, A.C. Larsen, Phys. Rev. Lett. 113, 252502 (2014)
- (185) K. Sieja, Phys. Rev. Lett. 119, 052502 (2017)
- (186) K. Sieja, EPJ Web of Conferences 146, 05004 (2017)
- (187) J.E. Midtbø, A.C. Larsen, T. Renstrøm, F.L. Bello Garrote, E. Lima, Phys. Rev. C 98, 064321 (2018)
- (188) S. Karampagia, B.A. Brown, V. Zelevinsky, Phys. Rev. C 95, 024322 (2017)
- (189) S. Goriely, E. Khan, Nucl. Phys. A 706, 217 (2002)
- (190) S. Goriely, E. Khan, M. Samyn, Nucl. Phys. A 739, 331 (2004)
- (191) S. Goriely, S. Hilaire, S. Péru, K. Sieja, Phys. Rev. C 98, 014327 (2018)
- (192) E. Lipparini, S. Stringari, Phys. Rep. 175, 103 (1989)
- (193) O. Bohigas, A. Lane, J. Martorell, Phys. Rep. 51, 267 (1979)
- (194) P. Gleissl, M. Brack, J. Meyer, P. Quentin, Ann. Phys. 197, 205 (1990)
- (195) V. Plujko, I. Kadenko, E. Kulich, S. Goriely, O. Davidovskaya, O. Gorbachenko, Verification of models for calculation of E1 radiative strength, in Workshop on Photon Strength Functions and Related Topics, edited by F. Bečvář (2008), Vol. 002
- (196) S. Goriely, S. Hilaire, M. Girod, S. Péru, Phys. Rev. Lett. 102, 242501 (2009)
- (197) N. Pietralla, P. von Brentano, R.D. Herzberg, U. Kneissl, N.L. Iudice, H. Maser, H.H. Pitz, A. Zilges, Phys. Rev. C 58, 184 (1998)
- (198) A. Voinov, E. Algin, U. Agvaanluvsan, T. Belgya, R. Chankova, M. Guttormsen, G.E. Mitchell, J. Rekstad, A. Schiller, S. Siem, Phys. Rev. Lett. 93, 142504 (2004)
- (199) M. Guttormsen, R. Chankova, U. Agvaanluvsan, E. Algin, L.A. Bernstein, F. Ingebretsen, T. Lönnroth, S. Messelt, G.E. Mitchell, J. Rekstad et al., Phys. Rev. C 71, 044307 (2005)
- (200) S. Goriely, S. Hilaire, S. Péru, M. Martini, I. Deloncle, F. Lechaftois, Phys. Rev. C 94, 044306 (2016)
- (201) S. Péru, M. Martini, Eur. Phys. J. A 50, 88 (2014)
- (202) E. Algin, U. Agvaanluvsan, M. Guttormsen, A.C. Larsen, G.E. Mitchell, J. Rekstad, A. Schiller, S. Siem, A. Voinov, Phys. Rev. C 78, 054321 (2008)
- (203) M. Krtička, S. Goriely, S. Hilaire, S. Péru, S. Valenta, Phys. Rev. C 99, 044308 (2019)
- (204) R.M. Laszewski, P. Rullhusen, S.D. Hoblit, S.F. LeBrun, Phys. Rev. C 34, R2013 (1986)
- (205) R.M. Laszewski, R. Alarcon, S.D. Hoblit, Phys. Rev. Lett. 59, 431 (1987)
- (206) R.M. Laszewski, R. Alarcon, D.S. Dale, S.D. Hoblit, Phys. Rev. Lett. 61, 1710 (1988)
- (207) R. Alarcon, R.M. Laszewski, D.S. Dale, Phys. Rev. C 40, R1097 (1989)
- (208) A. Richter, A. Weiss, O. Haüsser, B.A. Brown, Phys. Rev. Lett. 65, 2519 (1990)
- (209) N. Pietralla, P. von Brentano, R.D. Herzberg, U. Kneissl, J. Margraf, H. Maser, H.H. Pitz, A. Zilges, Phys. Rev. C 52, R2317 (1995)
- (210) C. Lüttge, P. von Neumann-Cosel, F. Neumeyer, C. Rangacharyulu, A. Richter, G. Schrieder, E. Spamer, D.I. Sober, S.K. Matthews, B.A. Brown, Phys. Rev. C 53, 127 (1996)
- (211) C. Fransen, B. Krischok, O. Beck, J. Besserer, P. von Brentano, T. Eckert, R.D. Herzberg et al., Phys. Rev. C 59, 2264 (1999)
- (212) A. Linnemann, P. von Brentano, J. Eberth, J. Enders, A. Fitzler, C. Fransen et al., Phys. Lett. B 554, 15 (2003)
- (213) A.S. Adekola, C.T. Angell, S.L. Hammond, A. Hill, C.R. Howell, H.J. Karwowski, J.H. Kelley, E. Kwan, Phys. Rev. C 83, 034615 (2011)
- (214) W. Mettner, A. Richter, W. Stock, B. Metsch, A.V. Hees, Nucl. Phys. A 473, 160 (1987)
- (215) T. Kibédi, T. Burrows, M. Trzhaskovskaya, P. Davidson, C. Nestor, Nucl. Instrum. Methods Phys. Res. A 589, 202 (2008)
- (216) M. Jandel, T.A. Bredeweg, A. Couture, M.M. Fowler, E.M. Bond, M.B. Chadwick, R.R.C. Clement, E.I. Esch, J.M. O’Donnell, R. Reifarth et al., Nucl. Instrum. Methods Phys. Res. B 261, 1117 (2007), 19th International Conference on Application of Accelerators in Research and Industry, Ft Worth, TX, AUG 20-25, 2006
- (217) Y. Xu, S. Goriely, A.J. Koning, S. Hilaire, Phys. Rev. C 90, 024604 (2014)
- (218) D. Rochman, S. Goriely, A. Koning, H. Ferroukhi, Phys. Lett. B 764, 109 (2017)
- (219) G. Rusev, R. Schwengner, R. Beyer, M. Erhard, E. Grosse, A. Junghans, K. Kosev, C. Nair, K. Schilling, A. Wagner et al., Phys. Rev. C 79, 061302 (2009)
- (220) G.M. Tveten, A. Spyrou, R. Schwengner, F. Naqvi, A.C. Larsen, T.K. Eriksen, F.L. Bello Garrote, L.A. Bernstein, D.L. Bleuel, L.C. Campo et al., Phys. Rev. C 94, 025804 (2016)
- (221) R. Chankova, A. Schiller, U. Agvaanluvsan, E. Algin, L.A. Bernstein, M. Guttormsen, F. Ingebretsen, T. Lönnroth, S. Messelt, G.E. Mitchell et al., Phys. Rev. C 73, 034311 (2006)
- (222) H. Utsunomiya, S. Goriely, T. Kondo, C. Iwamoto, H. Akimune, T. Yamagata, H. Toyokawa, H. Harada, F. Kitatani, Y.W. Lui et al., Phys. Rev. C 88, 015805 (2013)
- (223) B. Ishkhanov, I. Kapitonov, E. Lazutin, V. Sopov, I. Piskarev, G. Shevchenko, Soviet Journal of Nucl. Phys. 11, 394 (1970)
- (224) H. Beil, R. Bergère, P. Carlos, A.L. etre, A.D. Miniac, A. Veyssiere, Nucl. Phys. A 227, 427 (1974)
- (225) A. Makinaga, R. Massarczyk, R. Schwengner, M. Beard, F. Dönau, M. Anders, D. Bemmerer, R. Beyer, R. Hannaske, A.R. Junghans et al., Phys. Rev. C 90, 044301 (2014)
- (226) R. Massarczyk, G. Schramm, A.R. Junghans, R. Schwengner, M. Anders, T. Belgya, R. Beyer, E. Birgersson, A. Ferrari, E. Grosse et al., Phys. Rev. C 87, 044306 (2013)
- (227) T. Shizuma, N. Iwamoto, A. Makinaga, R. Massarczyk, R. Schwengner, R. Beyer, D. Bemmerer, M. Dietz, A. Junghans, T. Kögler et al., Phys. Rev. C 98, 064317 (2018)
- (228) F. Giacoppo, F.L. Bello Garrote, T.K. Eriksen, A. Görgen, M. Guttormsen, T.W. Hagen, A.C. Larsen, B.V. Kheswa, M. Klintefjord, P.E. Koehler et al., EPJ Web of Conferences 93, 01039 (2015)
- (229) N.U.H. Syed, M. Guttormsen, F. Ingebretsen, A.C. Larsen, T. Lönnroth, J. Rekstad, A. Schiller, S. Siem, A. Voinov, Phys. Rev. C 79, 024316 (2009)
- (230) E.G. Fuller, M.S. Weiss, Phys. Rev. 112, 560 (1958)
- (231) R.R. Harvey, J.T. Caldwell, R.L. Bramblett, S.C. Fultz, Phys. Rev. 136, B126 (1964)
- (232) G. Antropov, I. Mitrofanov, B. Russkikh, Jour. Bull. Russian Academy of Sciences 31, 320 (1968)
- (233) H. Askin, R. Hicks, K. Allen, R. Petty, M. Thompson, Nucl. Phys. A 204, 209 (1973)
- (234) Y. Sorokin, V. Khrushchev, B. Yurev, Jour. Bull. Russian Academy of Sciences 37, 137 (1973)
- (235) S. Goko, H. Utsunomiya, S. Goriely, A. Makinaga, T. Kaihori, S. Hohara, H. Akimune, T. Yamagata, Y.W. Lui, H. Toyokawa et al., Phys. Rev. Lett. 96, 192501 (2006)
- (236) T. Kondo, H. Utsunomiya, S. Goriely, I. Daoutidis, C. Iwamoto, H. Akimune, A. Okamoto, T. Yamagata, M. Kamata, O. Itoh et al., Phys. Rev. C 86, 014316 (2012)
- (237) L. Netterdon, A. Endres, S. Goriely, J. Mayer, P. Scholz, M. Spieker, A. Zilges, Phys. Lett. B 744, 358 (2015)