∎
Laser ablation in liquid: bridge from a plasma stage to bubble formation
Abstract
Laser ablation through liquid is an important process that have to be studied for applications which use laser ablation in liquid (LAL) and laser shock peening (LSP). LAL is employed for production of suspensions of nanoparticles, while LSP is applied to increase hardness and fatique/corrosion resistance properties of a surface layer. A bubble appears in liquid around the laser spot focused at a target surface after strong enough laser pulse. In the paper we connect the early quasi-plane heated layer created by a pulse in liquid and the bubble forming at much later stages. In the previous works these early stage from one side and the late stage from another side existed mainly as independent entities. At least, quantitative links between them were unknown. We consider how the quasi-plane heated layer of liquid forms thank to thermal conduction, how gradually conduction becomes weaker, and how the heated layer of liquid nearly adiabatically expands to few orders of magnitude in volume during the drop of pressure. Our molecular dynamics simulations show that the heated layer is filled by the diffusive atomic metal-liquid mixture. Metal atoms began to condense into nanoparticles (NP) when they meet cold liquid outside the edge of a mixing zone. This process limits diffusive expansion of metal atoms, because diffusive ability of NP is less than this ability for individual atoms. Thus the mixture expands together with hot liquid, and the NPs approximately homogeneously fill an interior of a bubble.
Keywords:
Laser ablation in liquid laser shock peening1 Introduction
Laser ablation in liquid (LAL) is important for many technological applications listed in the recent reviews LZ+Stephan:2018.LAL ; XIAO:2017 and papers nano9101348 ; Krylach_2019 ; doi:10.1063/1.5114630 ; doi:10.1021/acsnano.9b04610 ; Bally:2019 ; C8AN01276H . Another important direction of industrial applications is connected with laser shock peening (LSP) obzor:LSP:2017 ; Veiko:2017 ; Kudryashov:2019:UFast ; Kudryashov:2019:Filam ; CORREA:2015 . Theoretical analysis of LSP is related to the analysis of laser initiated shock waves. There are papers about elastic-plastic penetration of shocks Ashitkov:jetpLett:2010 ; superElast:2010okt ; Basil:1W2Z:PRL:2011 ; Kanel:elast-plast-SW:2012 ; Kanel:1426 ; Demaske:PRB:2013 ; Kanel:Ag:2014 . Nanosecond LSP is performed in water environment - water flows along surface of a target. This water surrounding is dynamically important feature of LSP. This feature increases amplitude of a shock obzor:LSP:2017 ; CORREA:2015 ; Fabbro:1990 and momentum transferred to a target. Thus LSP is similar to laser ablation in liquid.
LSP and LAL are two sides of the same process of laser interaction with target through transparent liquid. In LSP the people are interested in processes going inside a target - evolution of ejecta and production of nanoparticles (NP) are out of their area of interest. In femtosecond (fs) LAL T.Sano:2017 ; T.Sano:2018 the situation is opposite - shock runs away fast from a heat affected zone (tens of fs). While evolution of ejecta (laser plume) continues for a long time LZ+Stephan:2018.LAL ; Povarnitsyn-Itina:LAL:2013 ; povarnitsyn:ITINA:LAL:2014 ; LZ-bulk-LAL:2017 ; INA.jetp:2018.LAL ; Petrov:LAL:Appl.Surf.Sci:2019 ; Petrov:LAL:Contrib.Plasma.Phys:2019 . Namely this evolution is responsible for production of colloid of nanoparticles (NPs).
Amplitude of compressive shock is independent on presence or absence of liquid in fs LSP (if absorbed fluences are equal); this is true namely for fs LAL; but for ns LAL the presence of liquid affects compressive shock inside a target amplifying it. In nanosecond (ns) LAL Petrov:LAL:Appl.Surf.Sci:2019 ; Petrov:LAL:Contrib.Plasma.Phys:2019 the interaction between shocks in liquid and in target continues during a pulse (ns time scale). But again after finishing of a ns pulse the shocks in target and in liquid go far away from the metal/liquid contact zone. While motions which produce colloids slow evolve around this contact zone up to 1 microsecond Petrov:LAL:Appl.Surf.Sci:2019 ; Petrov:LAL:Contrib.Plasma.Phys:2019 .
In experiments (devoted to LAL) using high-speed photo-imaging, the formation, expansion, stopping of expansion, and the collapse of a bubble in a liquid around a laser spot are observed Amans:2016:APL ; LAL:exprmnt:bubble+spectr:2017 ; Amans:2019 ; Kanitz_2019 . Appearance of the bubble is observed starting from microsecond s). Until times of the order of fractions of a s, radiation emanating from the vicinity of the focusing spot is observed LAL:exprmnt:bubble+spectr:2017 ; Amans:2019 ; Kanitz_2019 . The early stages of LAL of the order of ns remain experimentally uninvestigated. In other experiments, people follow development of optical breakdown of a laser beam while the beam approaches to surface of a target Bulgakov:2017 ; Gurevich:2019a ; Gurevich:2019b .
There are relatively recent papers devoted to theory and numerical modeling of LAL Povarnitsyn-Itina:LAL:2013 ; povarnitsyn:ITINA:LAL:2014 ; LZ-bulk-LAL:2017 ; INA.jetp:2018.LAL ; LZ+Stephan:2018.LAL ; Petrov:LAL:Appl.Surf.Sci:2019 ; Petrov:LAL:Contrib.Plasma.Phys:2019 . In these works, the plasma stages of the development of processes are clearly traced. But these works are limited by short times to a few nanoseconds. The most important issue is the question of the relationship between the initial stages and the stage with the bubble.
Here we describe the connection between the initial stage with the quasi-plane plasma flow on the one side and the final stage with the expanding bubble on the other side. The analysis given below in the paper is divided into three main parts.
First, we present the data of calculating (by the hydrodynamic code 1D-2T-HD) the nanosecond laser action on gold through water up to the times at which the spherization of a shock wave front in water begins; spherization means transit from quasi-plane to quasi-spherical shape.
Secondly, we construct families of water adiabats that cover our range of entropies and pressure drops during expansion. This range is from the order of bar to pressures of 0.1-1 bar.
Thirdly, we present the data of molecular dynamics (MD) modeling regarding the mutual diffusion of gold and water together with the following picture of the condensation of gold atoms from MD.
Before describing these three parts of the work, we present data on the intermediate stage. At the intermediate stage, we will move from the description of the LAL flow using 1D-2T-HD code to the description using adiabatic curves.
2 Intermediate stage
The 1D-2T-HD code is a Lagrangian Samarskii:TheTheorDiffSc code in one dimension including full two-temperature (2T) physics Inogamov:2009:ASS ; INA.jetp:2018.LAL ; Shepelev:2019 . This means that electrons are much hotter than ions. For nanosecond (ns) laser pulse, the 2T effects are not significant Petrov:LAL:Appl.Surf.Sci:2019 ; Petrov:LAL:Contrib.Plasma.Phys:2019 . But code is universal in the sense that it may be used also for description of actions of ultrashort pulses where 2T physics plays dominate role. The code allows us to follow evolution of LAL up to few tens ns. To best of our knowledge, this is done for the first time in studies concerning LAL.
The main advantage in using the hydrodynamic code 1D-2T-HD is the use of adequate equations of state (EoS) substances. For gold the EoS is taken according to classical papers Bushman:1993 ; Khishchenko2002 ; lomonosov_2007 , see also database rusbank1 ; rusbank2 . Therefore, phase transitions are described in a continuous manner inside the flow field. For problems concerning the LAL, descriptions of melting, recrystallization, and evaporation are of exceptional importance. The code clearly tracks melting and evaporation fronts.
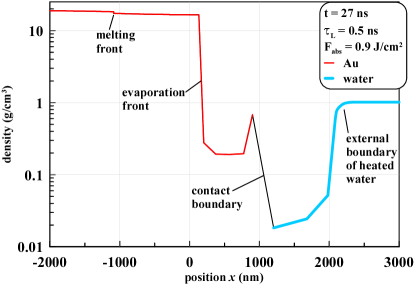
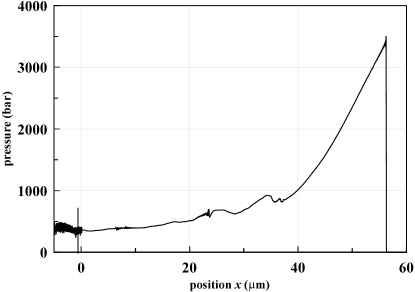
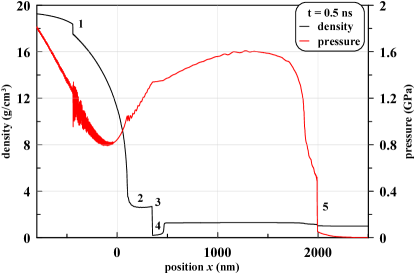
A typical example is shown in the figure 1. It presents vicinity of the gold-water contact. Namely this vicinity gives finite contribution into production of nanoparticles. There is a huge difference in the speed of sound in Au and water on the one side relative to the speed of expansion of the hot layer around the contact on the other side. Therefore, it is not surprising that the contact layer is much thinner than the distances traveled by the shock waves, see figures 2 and 3.
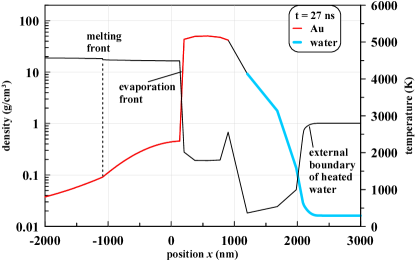
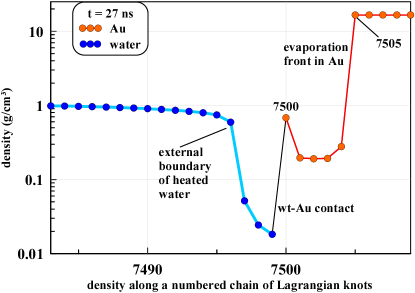
Figure 4 shows how hot the contact layers remain at times of the order of tens of nanoseconds. On the right outside the contact layer, the temperature quickly enough reaches the room temperature of the water. Since the dissipative heating of water in the shock wave is weak. Water heating occurs due to thermal conductivity. The transition layer from hot to cold water is indicated as ”external boundary of heated water” in figures 1 and 4.
Let us estimate the mass of evaporated gold and highly heated water. The calculation is carried out by the code 1D-2T-HD that works in Lagrangian coordinates. It is necessary to cover the extended calculation region with a sequence of Lagrangian knots. The extent of this region grows and grows as the shock wave propagates farther and farther into the water. To cope with this difficulty, it is necessary to roughen the Lagrangian grid over time. We keep the number of Lagrangian knots approximately equal to
The enlargement of Lagrangian segments occurs several times during simulation; when we are counting up to great times. The enlargement or increase means that more mass enters the Lagrangian segment The length corresponds to the length of the segment on the axis normal to the target surface before the start of the laser pulse. At the beginning of the simulation, the step along the Lagrangian grid was 1 nm in both gold and water. This means that the column mass (mass on the line of sight) and is concentrated in the Lagrangian segment for gold and for water, respectively; here and are densities of Au and water at room temperature.
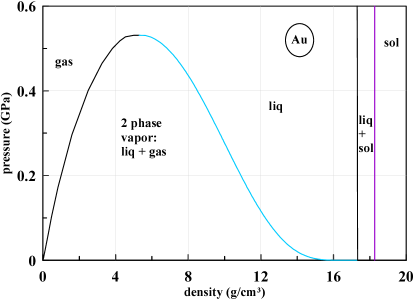
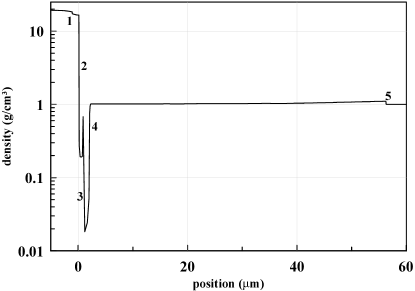
Figure 5 shows the density distribution along the Lagrangian coordinate at a time point of 27 ns; compare with figures 1 and 3. The horizontal axis in this figure represents the numbers of the Lagrangian nodes in the chain. Therefore the circles/nodes in figure 5 are equidistant. Lagrangian knot number 7500 is the last Lagrangian particle of gold on the border with water in figure 5. At the time shown in the figure, the length of the Lagrangian segment in water is 10 nm. As stated, a mass of water is concentrated in one Lagrangian particle. In a heated layer of water there are four such Lagrangian cells, see figure 5. Therefore, the mass of heated water per unit area of the laser spot is equal to g/cm Corresponding mass of hot water is g for laser beam diameter mm. This is the mass of water molecules.
About 4.5 Lagrangian cells make up a layer of evaporated gold, see figure 5. At the time point 27 ns in the figure 5, the length of one Lagrangian segment of gold is 2 nm. Therefore, the mass of evaporated gold per unit area is g/cm This mass is approximately four times the mass of hot water. Mass of evaporated gold is g for the 0.5 mm beam; corresponding number of Au atoms is If these atoms condense into nanoparticles (NP) with a diameter of 4 nm, then the number of produced NPs in one laser shot will be
3 Parameters of evaporated gold
Let’s see how evaporation looks on the phase plane of gold. First, let’s see how the phase planes are arranged. After that, we show the location of the hydrodynamic profile relative to the boundaries of the first-order phase transitions (see Section 4 below).
Figure 6 shows binodal (coexistence curve) and two-phase melting region. Expression
| (1) |
approximates dependence of saturation pressure on temperature which follows the wide-range equation of state (EoS) Bushman:1993 ; Khishchenko2002 ; lomonosov_2007 ; rusbank1 ; rusbank2 . Critical parameters for this version of EoS are:
| (2) |
The approximation of the boiling curve has the form:
| (3) | |||||
| (4) | |||||
where density is in g/cm temperature in K.
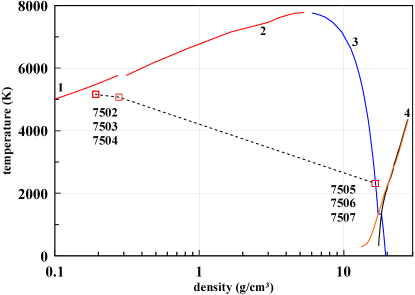
Excluding temperature from the parametric dependencies (1) and (3), we obtain the right branch of the binodal (the boiling curve in the density - pressure plane. This branch is shown in figure 6 as the blue curve. The left branch in the figure 6 is drawn according to the wide-range EoS Bushman:1993 ; Khishchenko2002 ; lomonosov_2007 ; rusbank1 ; rusbank2 . This is the condensation curve, which is highlighted in black in the figure 6. The asymptotic behavior at the zero of the condensation curve has the form
This means that the condensation curve on the plane weakly (only logarithmically) touches the horizontal axis: as This touch is so weak that in the figure 6 the dependence near zero looks like a straight line.
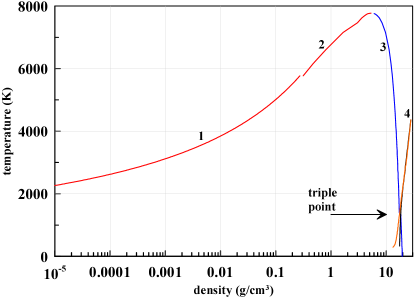
Figure 7 shows the situation on the plane of density and temperature. Curves 2, 3, and 4 in this figure are constructed according to the wide-range equation of state (EoS) Bushman:1993 ; Khishchenko2002 ; lomonosov_2007 ; rusbank1 ; rusbank2 . The tabular wide-range equation of state goes in rather large steps in the region of a substantially rarefied gas. In the figure 7, the coexistence curve of gas and a two-phase mixture is constructed using formulas for saturated vapor pressure (1) and equations of state of an ideal gas: the curve 1; here is mass of gold atom. This is done in order to increase the accuracy of the representation of the condensation curve.
The compressibility factor for wide-range EoS is 3.3, where critical parameters are presented in (2); they are marked with a subscript ”cr” here. This factor characterizes, firstly, the amplitude of the cohesive forces at the critical point and, secondly, the error of the equation of state of the ideal gas at the critical point. The specified error decreases with distance from the critical point. Therefore, curve 1 in Figure 7 is consistent with the tabular wide-range EoS as the temperature decreases from the critical temperature (2) to a temperature of K.
4 Thermodynamic characteristics of the hydrodynamic profile in the evaporated layer
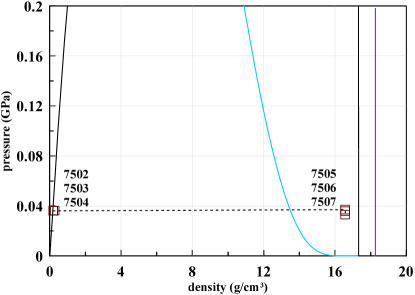
The thermodynamic description of gold was presented above (Section 3). Let us see in what thermodynamic states the portions of gold are in the case of the hydrodynamic profile shown in the figures 1-5. The combination of the profile and the phase diagram is shown in figures 8 and 9. The profile is represented by its Lagrangian nodes 7502-7507. The nodes with these numbers refer to evaporated gold and to the first few Lagrangian particles of gold melt, see figure 5.
From the analysis of figures 8 and 9 it follows that the distribution of quantities along the hydrodynamic profile strictly corresponds to the thermodynamic characteristics of substances. It is important that the method we used, together with the tabular equations of state, allows us to cross-cut through the fronts of first-order phase transitions. Through, i.e. without highlighting the front and dividing the flow into two parts - on one and the other side of the front. In this case, the coordination of heat fluxes to the left and to the right of the front and the front displacement velocity occurs automatically. Such coordination is necessary in order to provide the required heat flux to overcome the latent heat of fusion or evaporation.
At the evaporation front, there are jumps in density and temperature, see figures 8 and 9. The temperature jump is associated with a sharp drop in the thermal conductivity of gold during the transition of gold to a low-density phase. At the moment of 27 ns, the density in the vapor layer of gold decreases by two orders of magnitude compared to the value of 19.3 g/cm Reducing of thermal conductivity plays an important role. As a result, the conductive cooling of gold steam slows sharply. The main cooling mechanism is adiabatic expansion.
Basically, the expansion of the heated layers is supported by the pressure of saturated gold vapor together with pressure of hot water. At time 27 ns, shown in figures 8 and 9, the pressure in the vicinity of the contact is 360 bar. There are the contact layers of cold and hot water and evaporated and liquid gold under this pressure, see figures 2 and 3.
In figure 8, the edge of liquid gold (Lagrangian particles number 7505 and higher) is raised to a substantial height above the boiling curve (the blue curve). Whereas in figure 9 this edge is located directly on the boiling curve. The fact is that the pressure of 360 bar is very small compared to the bulk modulus of gold; 180 GPa in solid state. Accordingly, a change in density in the direction of compression is negligible and on the plane the points related to the liquid, are right on the boiling curve, see figure 9. The pressure rises sharply when we move from the boiling curve to a region occupied by liquid in the phase plane in figure 9.
As was said, in figure 8, the edge of liquid gold is raised to a substantial height above the boiling curve. This is because there is very little saturated vapor pressure related to density 16.6 g/cm and temperature K at the edge of the liquid; millibar bar. This means that the vaporized gold layer is formed at much earlier and much hotter stages of evolution compared with the time moment of 27 ns presented in figures 8 and 9. The mass additions to the vaporized gold layer can be neglected at stages of the order of ten nanoseconds because evaporation rate drops drastically.
5 Role of water. Adiabatic expansion of water
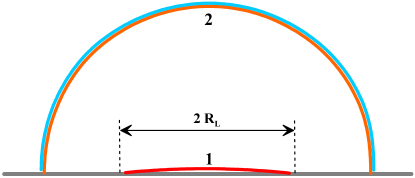
At times of the order of 100-1000 ns, a hemispherical bubble 2 gradually forms from a quasi-flat hot layers of vaporized gold and gaseous water shown in figures 1-5. This process is depicted in figure 10. Hot layers 1 in figure 10 are near the contact.
The name ”cavitation” bubble is widely used in the literature on LAL. In fact, the bubble does not form at all due to cavitation. It is directly inflated with evaporated water. In the early stages, water heated by contact with hot metal evaporates. Further, cold water recedes under the pressure of hot gaseous water. That is, the bubble is correctly called the boiling bubble.
Moreover, the above applies to laser ablation in a fluid (LAL) using femtosecond (fs) laser action (fs LAL). In this case, in a early short time interval, there is indeed cavitation inside the target material. But still, inflation of the bubble occurs much later. This late stage expansion of the bubble in liquid is again due to the expansion of gaseous ablation products.
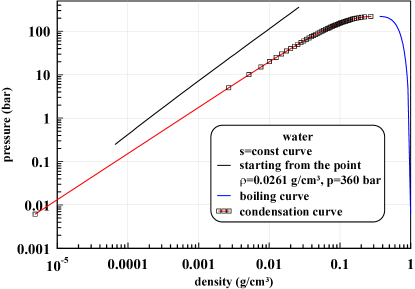
Figure 11 shows the binodal of water and the adiabat of water. This adiabat starts from a point with a pressure of 360 bar and a density of 0.0261 g/cm The indicated point corresponds to the state of water in a highly heated layer at a time point of 27 ns, see figures 4 and 5. The boiling and condensation curves in Figure 11 are taken from NIST reference data NIST . The adiabatic curve starting from the point g/cm bar was calculated using water steam calculator watersteamcalculator .
Below we estimate the maximum radius of expansion of the bubble, see figure 10. At this value of the radius, the expansion of the bubble stops. Further, the bubble is compressed by a low external pressure. External pressure is small compared to the pressure in the contact layer in the early stages. Let the external pressure at the moment of maximum expansion of the bubble equals to the pressure in the experimental vessel before the laser exposure: Let the pressure in this vessel be 1 bar prior to exposure.
From the solutions of the Rayleigh-Plesset equation, it is known that at the moment of inhibition of motion around the bubble the pressure inside the bubble drops below external pressure This is due to the inertia of the expanding fluid that surrounds the bubble. In this case, the internal pressure in the bubble is several times lower than the external pressure this is overexpansion beyond the point of equilibrium of forces, as in the case of a pendulum. For these reasons, the end point for calculating the expansion adiabat in Fig. 11 was chosen.
The analysis of the question of the value of requires a separate discussion, which is beyond the scope of this article. A simplified version is adopted here. Let us describe at a qualitative level what the complexity is. A shock wave propagates around the surrounding fluid, see Figure 2. There is pressure in front of this shock wave (pressure is just behind the front) and pressure in the depth behind the wave in the region of the contact layer. Pressure is internal for the shock wave and external first for the hot plane layer and then for the bubble. The pressure in bubble is different from pressure at distances of several radii of the bubble.
The pressure behind the shock wave can drop significantly below the pressure in front of the shock front; this is formation of a rarefaction cavity behind a strong shock wave. If this occurs at the stage of maximum expansion of the bubble, then pressure will be significantly lower than pressure because the bubble is inside the rarefaction cavity in this case. In this case, it will be necessary to extend the adiabatic curve in Figure 11 further, in the direction of increased extensions.
What the situation is with function depends on the size of the vessel and bubble of course, we consider the case If the vessel is small, then there is a reflection of the shock wave from the walls of the vessel, scattering of the reflected waves, and pressure drop in the vicinity of the bubble to weakly non-linear shock propagates in water with speed of sound 1.5 km/s and passes 15 cm during 100 s. But if (a) the vessel is large and (b) the excess pressure in the shock wave does not become small at the stage of maximum expansion of the bubble, then pressure will drop below pressure
We conclude this discussion of the question of pressure We restrict ourselves to the approximation This approximation with bar corresponds to the endpoint of the adiabatic curve in figure 11.
6 Expansion of a bubble
Determine the size of from the expansion degree along the adiabatic curve; here is radius of a bubble. We write the law of conservation of mass:
| (5) |
here is defined in figure 10, is thickness of the hot contact layer shown in figures 1 and 4, is density in the point where the adiabatic curve in figure 11 starts, and density inside a bubble at the stage of maximum expansion is density in the point where the adiabatic curve in figure 11 ends. The law (5) holds, since entropy changes steeply from the hot layer to cold water, see figures 1, 4, and 5. Therefore, the evaporation/condensation exchange between the gas in the bubble and the surrounding liquid is small.
From mass conservation (5) follows the formula
| (6) |
We take the values: g/cm g/cm (this is the end point in figure 11), microns (this is thickness of the hot layer from gold and water in figure 4). In this case, the equation (6) takes the form:
| (7) |
For the production of colloids of nanoparticles, rather large spots (for illustration see figure 10) of illumination of the order of a millimeter are used. The size of is usually on the order of a millimeter. Of course, the size of a bubble substantially depends on the size of the spot. Large bubbles are easier to detect. The estimate (7) gives significantly less than 1 mm. Apparently, this is due to the relatively small absorbed energy J/cm adopted in our calculation; calculation parameters are shown in figure 1. In addition, in experiments the pulse duration usually is longer, than our, often 5-10 ns. Then, firstly, the hot layer in figure 4 will become even hotter, and secondly, the hot layer in figures 1, 4, and 5 will become thicker.
Even in our not extremely hot case the whole adiabatic curve corresponding to a hot layer passes above the two-phase region of water during all stages of evolution, see figure 11. It is sometimes believed that water immediately enters the two-phase region as soon as the pressure drops below a critical water pressure of 220 bar. In our case, this is not so, see figure 11. It also means that the effective adiabatic exponent
| (8) |
of expanding gaseous water is noticeably greater than unity; here is the function presented as the adiabatic curve in figure 11. With good accuracy we have (8) for the adiabatic curve shown in figure 11. Whereas inside the two-phase region at low mixture densities, the pressure on the adiabatic curve changes with an exponent that is only slightly greater than unity.
The starting point of the adiabatic curve in figure 11 corresponds to a time of 27 ns in a particular calculation, presented above (figures 1-5, 8, 9, 11); calculation parameters are shown in figure 1. Initially, a decrease in density and pressure in the hot layer occurs due to planar expansion, that is, due to the expansion in direction normal to the surface of the target. Then there is a transition to spherical expansion, see figure 10. At what point in time the spherization of expansion of the bubble occurs depends on the radius The larger the radius, the later such a transition will take place.
7 Early hydrodynamic evolution
The results related to the time of 27 ns were presented above, figures 1-5, 8, 9. At this point in time, the shock wave in the water travels to a distance of about 60 microns from the contact, see figure 2. That is, at spot radii of the order of 100 microns, the stage of transition to the regime of spherical propagation of a shock wave in water approaches. At this stage, the one-dimensional (1D) approximation adopted in the code 1D-2T-HD becomes inapplicable.
Here we are talking about the stage of spherical propagation of a shock wave; everywhere refers to the hemisphere. The transition to the stage of spherical expansion of the bubble occurs much later, since the speed of expansion of the bubble is much lower than the speed of sound in water (1.5 km/s).
To describe the subsequent evolution, we use the adiabatic approximation, see figure 11. The fact is that the thermal diffusivity of water in the hot layer becomes small, of the order of according to reference data NIST . In such a situation, the thermal cooling time of the hot water layer
becomes about 3 microseconds; here we use thickness of the hot layer equal to 2 microns. Whereas the hydrodynamic expansion time of the hot layer at the stage shown in the figures 1-5 is about 0.1 microseconds. Indeed, at a point in time of 27 ns, shown in figure 2, the velocity of expansion of the hot layer is about 30 m/s. Let’s also mention that in this time, the water velocity immediately behind the shock wave front is 180 m/s.
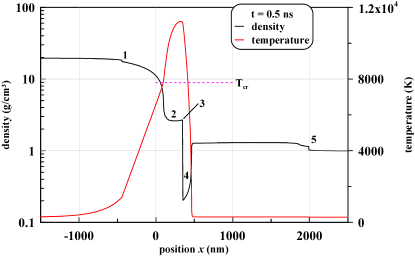
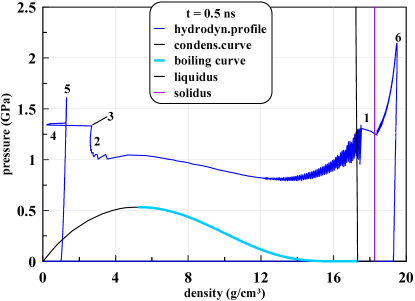
So, the data at the time point of 27 ns were presented above, figures 1-5. This moment of time was used by us for the transition from the hydrodynamic code 1D-2T-HD to adiabatic evolution - the starting point on adiabatic curve in figure 11 relates to the state of hot water at time 27 ns. Let’s give briefly here the data related to the initial stage of evolution. The pulse duration in the hydrodynamic simulation is 0.5 ns. The calculation parameters are shown in figure 1. Figures 12 and 13 show the hydrodynamic profiles at a time moment of 0.5 ns, when the laser heating ends.
A laser pulse passes through transparent water and is absorbed at the edge of a gold target. Further, thermal conductivity distributes the absorbed energy into the thickness of gold. At the same time, water is heated from gold in a contact way. The thermal conductivity of dense gold is greater than the thermal conductivity of water. Therefore, much more heat is stored in gold. The temperature distribution at time 0.5 ns is shown in Figure 12.
Gold heating in the absorption zone is accompanied by a rise in pressure in this zone. Of course, under the influence of an ultrashort pulse, the pressure calculated for the same absorbed energy is greater, than when exposed to a nanosecond pulse. However, the generation of significant pressures is also associated with a long pulse, see Figure 13. An ultrashort pulse will be called a pulse for which the acoustic time scale is shorter than the heating duration; here is thickness of heat affected zone, is speed of sound in gold. In the case of a long pulse, on the contrary, the acoustic scale is shorter than the pulse duration For figures 12 and 13, the thickness is approximately 700 nm. Accordingly, the acoustic scale is about 200 ps.
The increased pressure leaves the heating zone at the speed of sound in the case of a long pulse. Two smooth pressure hillocks arise, the shape of which is associated with the profile of the laser pulse in time. In our case, we use a pulse whose shape in time is equal to the Gaussian function in our 1D-2T-HD simulation ns, see figure 1; this is e-folding time. These acoustic hillocks are emitted along their characteristics towards gold and towards water, see Figure 13. Radiation ceases with the cessation of heating. Accordingly, the spatial width of the hillocks is This is how the minimum pressure is formed on the pressure profile in figure 13. A low pressure zone is formed between pressure hills that propagate into gold and water.
8 Comparison of hydrodynamic and molecular-dynamics simulations
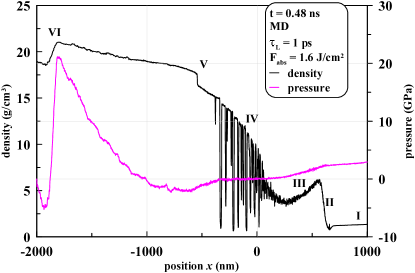
Molecular dynamics (MD) simulation results are shown in figures 14 and 15. The molecular dynamics simulation technique is described in the article INA.jetp:2018.LAL . In contrast to the hydrodynamic simulation described above (figures 1-5, 12, 13), the case of ultrashort exposure with ps is considered here. Absorbed energy is J/cm
Density and pressure profiles are shown in figure 14. Shock in water at the right side isn’t shown. The fact is that in molecular dynamics modeling we use a special boundary condition on the right side in the water. This condition is placed on the Lagrangian particle at a considerable distance from the contact. First, in the calculation with a small cross section, the trajectory of this Lagrangian particle is determined; the cross section is perpendicular to the axis along direction of motion. Then, in the MD calculation with a large cross section, a part of the water from the contact to the specified Lagrangian particle is used. This reduces the number of atoms that are used in the calculation. The technique is described in the article INA.jetp:2018.LAL . Shock compressed water is marked by ”I” in figure 14.
Due to nucleation under action of tensile stress at time and due to separation of the spall layer III, a foam layer IV is formed, see figure 14. In the initial stages, the spall layer moves at a considerable speed. When propagating into a liquid, this layer is slowed down thanks the inertia of the liquid, which is displaced by the spallation layer. This leads to a gradual slowdown in the movement of the spall layer. As a result, two circumstances are formed that are absent when the spallation layer expands into vacuum. Firstly, the spall layer is in quasi-hydrostatic equilibrium. Therefore, we call it the ”atmosphere,” see INA.jetp:2018.LAL and figures 14, 15. The fact is that sound runs through this layer in a time that is less than the time during which braking occurs. This allows us to talk about hydrostatic equilibrium. As a result of the action of weight (effective gravity), pressure and density gradients in the atmosphere (hydrostatic compression) arise, see figure 14.
The second circumstance that distinguishes laser ablation in a liquid (LAL) is as follows. When flying into vacuum, the initial velocity distribution of the mass that has escaped is preserved over time. Therefore, the droplets formed during the decay of the foam fly behind fragments of the spall layer. Whereas when the spallation layer spreads into the liquid (LAL), the atmosphere is slowed down by the liquid. At the same time, the foam behind is protected from the liquid by the layer of the atmosphere and maintains its speed. As a result, membranes and droplets of foam fly into the atmosphere. There is an increase in mass concentrated in the atmosphere. In addition, the influx of momentum somewhat reduces the rate of deceleration of the atmosphere. In the end, most of the foam adheres to the atmosphere.
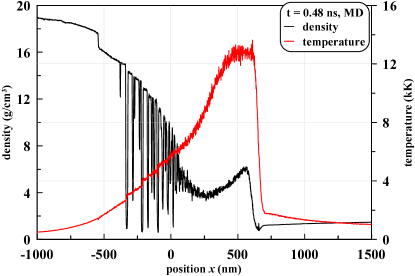
Our gold layer used in the MD simulation has a finite thickness. On the left, this layer in figures 14 and 15 is bordered by vacuum (free boundary). At the time point 0.48 ns shown in figures 14 and 15, the shock wave in gold reflects from the free boundary. One can see how a rarefaction wave begins to propagate from the free boundary towards the triangular shock wave in gold. Dynamically, this is an insignificant detail if we are interested in the fate of the atmosphere, the diffusion layer, and shock-compressed water.
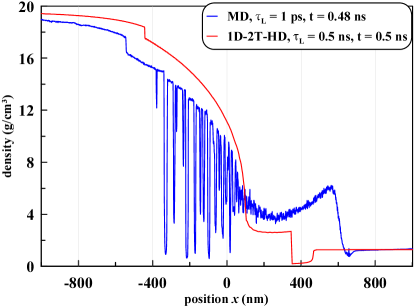
Comparison of the 1D-2T-HD and MD profiles is presented in figure 16. In 1D-2T-HD the hot layer of water is wider; maybe as a result of heat conduction in water included in 1D-2T-HD. Also comparing the figures 12 and 15, we see that in MD the shock wave leaves a more significant trace of heating in water. Of course, this is due to the fact that at the initial stage, shock waves created by ultrashort laser pulse are much more intense compared to nanosecond pulse.
9 Comparison of hydrodynamic and molecular-dynamics thermodynamical states
Figure 17 shows the thermodynamic states in the case of nanosecond exposure with parameters given in figure 1; simulation by the code 1D-2T-HD is presented. The time is 0.5 ns. The rise in pressure along the evaporated layer of gold 2 is due to the formation of a minimum of pressure at the edge of the gold target. As mentioned above, the formation of a minimum is associated with the end of heating of gold by nanosecond laser pulse. As a result of this, the separation of acoustic waves traveling into gold and water occurs, see figure 13.
Numbers 1-5 indicate the characteristic sections of the hydrodynamic profile in figures 12 and 13. These numbers are repeated in figure 17. This is done in order to see which areas of the phase diagram belong to certain sections of the profile. The meaning of the number 5 in figures 13 and 17 is different. In figure 13, this is the front of a forming shock wave in water. Whereas in figure 17 this is the maximum of the pressure hill in the water. A pressure hill is called a nonlinear acoustic wave traveling into water.
In figure 17 the number 6 is added. The number 6 is not presented in figures 12 and 13. The number 6 denotes a shock wave that propagates into the volume of a gold target. In figures 12 and 13 this wave is located beyond the left frame of the figures. As you can see, at the time 0.5 ns this wave runs on solid gold.
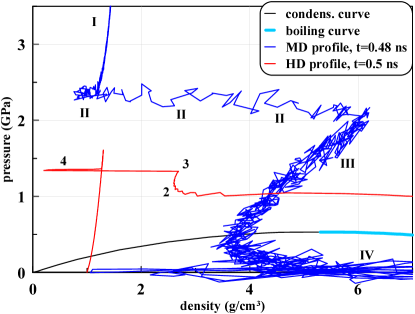
Figure 18 is needed to demonstrate that in the simulations made in two different ways, the substance in the vicinity of the contact is in the supercritical region. Therefore, there is no surface tension and diffusive mixing of the target substance and the liquid proceeds rapidly. The hydrodynamic calculation was performed using the Lagrangian scheme. In this scheme, diffusion is absent. The presence of diffusion weakly affects the dynamics of the system (but is extremely important for production of nanoparticles). Molecular dynamics approach takes into account diffusion to the full extent.
10 Diffusion, condensation, and locking nanoparticles inside hot water
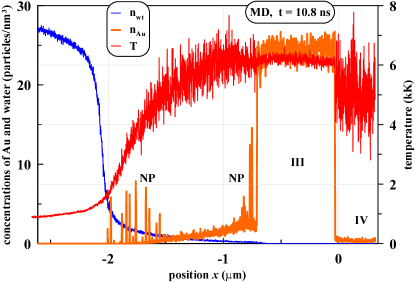
Figure 19 shows, firstly, how the processes of diffusive interpenetration of gold and water proceed. Secondly, a temperature profile is presented. The thermal conductivity of rarefied water and low-density gold are very small. Therefore, a high temperature remains for a long time. The temperature decreases mainly due to the adiabatic expansion of the hot layer.
Thirdly, we see the development of the process of condensation of atomic gold in a mixture with gaseous water. It is with this process that sharp spikes appear on the gold concentration profile Groups of these spikes are marked with the letters ”NP” (NanoParticles) in figure 19.
The pressure at time 10.8 ns shown in Figure 19 is approximately 700 bar. The Roman numerals I, II, III, IV in figure 18 refer to The numerals III and IV in figure 19 have the same meaning as in figures 14 and 18. But figures 14 and 18 ns) on the one hand and figure 19 ns) on the other hand are far apart in time. Over the time interval from 0.48 ns to 10.8 ns, the area occupied by the foam was empty. Gold from foam IV sticks to the layer III. The layer of diffusion mixing expanded.
The most important effect is as follows. Diffusing gold atoms fill a layer of low-density hot water. This is due to increased values of the diffusion coefficient in low-density water. At the edge of a layer of hot water, gold atoms begin to escape into cold water. The temperature of gold vapor in water decreases in this particular place. As a result, active condensation of gold atoms into nanoparticles begins. The spikes on the left edge of the diffusion layer in figure 19 correspond to it.
So, on the edge that separates hot and cold water, the gold vapor condenses. Nanoparticles are involved in Brownian motion. Their mobility is small. The diffusion coefficient of nanoparticles is small compared with the diffusion coefficient of atoms; because they are much more massive and moves slowly. Consequently, the diffusion propagation of gold atoms into water is blocked at the interface between hot and cold water.
The boundary between hot (high entropy) and cold water transforms into the boundary of the bubble when the water layer with high entropy expands. This process is shown in figures 10 and 11. As a result, the gold nanoparticles are locked inside the bubble. This is precisely the situation observed in the experiments Kanitz_2019 ; LZ+Stephan:2018.LAL .
11 Conclusion
The article is devoted to the analysis of processes that occur during laser ablation in a liquid. Two independent codes were used for analysis: the hydrodynamic code 1D-2T-HD and the molecular dynamics (MD) code. The complete evolution of the flow from the absorption of laser energy to the formation of a bubble in a liquid is considered. The main results are as follows.
(A) At a sufficiently high absorbed energy of the order of Joules per square centimeter, the gold at the edge of the target appears for a rather long time in supercritical states, that is, in states above the critical point in temperature and pressure. Moreover, what has been said applies both to ultrashort pulses and to nanosecond pulses.
(B) In supercritical states, capillary force disappears; this force separates substances at the contact boundary between them.
(C) The disappearance of the dividing boundary sharply intensifies the diffusion interpenetration of substances. The situation becomes similar to that which occurs when two gases come into contact.
(D) Water near the border with gold is heated mainly due to thermal conductivity. There is also a contribution related to the diffusion of hot gold vapors. Heating due to dissipation in the shock front is less significant. Shock heating is greater when exposed to an ultrashort pulse, since the shock wave is much more powerful compared to the nanosecond case. Thermal conductivity and diffusion create a thin layer of hot water in the contact area.
(E) The boundary between cold and hot water gradually transforms into the boundary of the bubble. Moreover, the expanding hot water fills the inside of the bubble.
(F) The diffusion of gold atoms is significant. Gold vapor fills a layer of hot water.
(G) At the edge of hot and cold water, gold atoms condense into nanoparticles with sizes from a nanometer or more. The Brownian creep of the formed nanoparticles is slow. Their diffusion coefficient is small compared with the diffusion coefficient of atoms. Therefore, the nanoparticles are located inside the bubble.
Acknowledgements.
The work of the INA, the VAKh, and YuVP was carried out under the state order of ITP RAS. VVZ thanks for support of the Russian Science Foundation grant number 19-19-00697.References
- (1) C.Y. Shih, R. Streubel, J. Heberle, A. Letzel, M.V. Shugaev, C. Wu, M. Schmidt, B. Gokce, S. Barcikowski, L.V. Zhigilei, Nanoscale 10, 6900 (2018). DOI 10.1039/C7NR08614H
- (2) J. Xiao, P. Liu, C.X. Wang, G.W. Yang, Progr. Mater. Science 87, 140 (2017). DOI 10.1016/j.pmatsci.2017.02.004
- (3) D.V. Pavlov, A.Y. Zhizhchenko, M. Honda, M. Yamanaka, O.B. Vitrik, S.A. Kulinich, S. Juodkazis, S.I. Kudryashov, A.A. Kuchmizhak, Nanomaterials 9(10) (2019). DOI 10.3390/nano9101348
- (4) I.V. Krylach, S.I. Kudryashov, R.O. Olekhnovich, M.K. Moskvin, M.V. Uspenskaya, Laser Physics Letters 16(10), 105602 (2019). DOI 10.1088/1612-202x/ab3d32
- (5) S.I. Kudryashov, A.O. Levchenko, P.A. Danilov, N.A. Smirnov, A.A. Rudenko, N.N. Melnik, N.I. Busleev, A.A. Ionin, Appl. Phys. Lett. 115(7), 073102 (2019). DOI 10.1063/1.5114630
- (6) A.V. Kabashin, A. Singh, M.T. Swihart, I.N. Zavestovskaya, P.N. Prasad, ACS Nano 13(9), 9841 (2019). DOI 10.1021/acsnano.9b04610. PMID: 31490658
- (7) A.L. Bailly, F. Correard, A. Popov, G. Tselikov, F. Chaspoul, R. Appay, A. Al-Kattan, A. Kabashin, D. Braguer, M.A. Esteve, Scientific Reports 9 (2019). DOI 10.1038/s41598-019-48748-3
- (8) C. Byram, S.S.B. Moram, V.R. Soma, Analyst 144, 2327 (2019). DOI 10.1039/C8AN01276H
- (9) D. Karthik, S. Swaroop, Mater. Manuf. Processes 32(14), 1565 (2017)
- (10) V.P. Veiko, S.A. Volkov, R.A. Zakoldaev, M.M. Sergeev, A.A. Samokhvalov, G.K. Kostyuk, K.A. Milyaev, Quantum Electronics 47(9), 842 (2017). DOI 10.1070/qel16377
- (11) S.I. Kudryashov, A.A. Samokhvalov, E.I. Ageev, V.P. Veiko, JETP Letters 109(5), 298 (2019). DOI 10.1134/S0021364019050096.
- (12) S.I. Kudryashov, A.A. Samokhvalov, E.I. Ageev, V.P. Veiko, JETP Letters 109(7), 432 (2019). DOI 10.1134/S0021364019070087
- (13) C. Correa, D. Peral, J. Porro, M. Díaz, L. Ruiz de Lara, A. García-Beltrán, J. Ocaña, Optics and Laser Technology 73, 179 (2015). DOI 10.1016/j.optlastec.2015.04.027
- (14) S.I. Ashitkov, M.B. Agranat, G.I. Kanel’, P.S. Komarov, V.E. Fortov, JETP Lett. 92(8), 516 (2010). DOI 10.1134/S0021364010200051
- (15) V.V. Zhakhovskii, N.A. Inogamov, JETP Lett. 92(8), 521 (2010). DOI 10.1134/S0021364010200063
- (16) V.V. Zhakhovsky, M.M. Budzevich, N.A. Inogamov, I.I. Oleynik, C.T. White, Phys. Rev. Lett. 107(13), 135502 (2011). DOI 10.1103/PhysRevLett.107.135502
- (17) E.B. Zaretsky, G.I. Kanel, J. Appl. Phys. 112, 073504 (2012). DOI https://doi.org/10.1063/1.4755792
- (18) G.I. Kanel, AIP Conf. Proc. 1426, 939 (2012). DOI https://doi.org/10.1063/1.3686432
- (19) B.J. Demaske, V.V. Zhakhovsky, N.A. Inogamov, I.I. Oleynik, Phys. Rev. B 87(5), 054109 (2013). DOI 10.1103/PhysRevB.87.054109
- (20) E.B. Zaretsky, G.I. Kanel, J. Appl. Phys. 110(7), 073502 (2011). DOI 10.1063/1.3642989
- (21) R. Fabbro, J. Fournier, P. Ballard, D. Devaux, J. Virmont, J. Appl. Phys. 68(2), 775 (1990). DOI 10.1063/1.346783
- (22) T. Sano, T. Eimura, R. Kashiwabara, T. Matsuda, Y. Isshiki, A. Hirose, S. Tsutsumi, K. Arakawa, T. Hashimoto, K. Masaki, Y. Sano, Journal of Laser Applications 29(1), 012005 (2017). DOI 10.2351/1.4967013
- (23) T. Kawashima, T. Sano, A. Hirose, S. Tsutsumi, K. Masaki, K. Arakawa, H. Hori, Journal of Materials Processing Technology 262, 111 (2018). DOI https://doi.org/10.1016/j.jmatprotec.2018.06.022
- (24) M.E. Povarnitsyn, T.E. Itina, P.R. Levashov, K.V. Khishchenko, Phys. Chem. Chem. Phys. 15, 3108 (2013). DOI 10.1039/C2CP42650A
- (25) M.E. Povarnitsyn, T. Itina, Appl. Phys. A 117(1), 175 (2014). DOI 10.1007/s00339-014-8319-1
- (26) C.Y. Shih, M.V. Shugaev, C. Wu, L.V. Zhigilei, J. Phys. Chem. C 121(30), 16549 (2017). DOI https://doi.org/10.1021/acs.jpcc.7b02301
- (27) N.A. Inogamov, V.V. Zhakhovskii, V.A. Khokhlov, J. Exp. Theor. Phys. 127(1)(1), 79 (2018). DOI 10.1134/S1063776118070075
- (28) Y. Petrov, V. Khokhlov, V. Zhakhovsky, N. Inogamov, Appl. Surf. Sci. 492, 285 (2019). DOI https://doi.org/10.1016/j.apsusc.2019.05.325
- (29) Y.V. Petrov, N.A. Inogamov, V.V. Zhakhovsky, V.A. Khokhlov, Contrib. Plasma Phys. 59(6), e201800180 (2019). DOI https://doi.org/10.1002/ctpp.201800180. ArXiv:1812.09929 [physics.comp-ph] (2018),
- (30) J. Lam, J. Lombard, C. Dujardin, G. Ledoux, S. Merabia, D. Amans, Appl. Phys. Lett. 108(7), 074104 (2016). DOI 10.1063/1.4942389
- (31) N. Walsh, J. Costello, T. Kelly, Appl. Phys. B 123, 179 (2017). DOI 10.1007/s00340-017-6754-3
- (32) D. Amans, W. Cai, S. Barcikowski, Appl. Surf. Sci. 488, 445 (2019). DOI 10.1016/j.apsusc.2019.05.117
- (33) A. Kanitz, M.R. Kalus, E.L. Gurevich, A. Ostendorf, S. Barcikowski, D. Amans, Plasma Sources Science and Technology 28(10), 103001 (2019). DOI 10.1088/1361-6595/ab3dbe
- (34) S.V. Starinskiy, Y.G. Shukhov, A.V. Bulgakov, Appl. Surf. Sci. 396, 1765 (2017). DOI 10.1016/j.apsusc.2016.11.221
- (35) J.S. Hoppius, S. Maragkaki, A. Kanitz, P. Gregorčič, E.L. Gurevich, Appl. Surf. Sci. 467-468, 255 (2019). DOI https://doi.org/10.1016/j.apsusc.2018.10.121
- (36) A. Kanitz, D.J. Förster, J.S. Hoppius, R. Weber, A. Ostendorf, E.L. Gurevich, Appl. Surf. Sci. 475, 204 (2019). DOI https://doi.org/10.1016/j.apsusc.2018.12.184
- (37) A.A. Samarskii, The Theory of Difference Schemes, vol. 786 Pages (CRC Press, 2001)
- (38) N.A. Inogamov, V.V. Zhakhovskii, S.I. Ashitkov, V.A. Khokhlov, Y.V. Petrov, P.S. Komarov, M.B. Agranat, S.I. Anisimov, K. Nishihara, Appl. Surf. Sci. 255, 9712 (2009). DOI 10.1016/j.apsusc.2009.04.139
- (39) V.V. Shepelev, N.A. Inogamov, P.A. Danilov, S.I. Kudryashov, A.A. Kuchmizhak, O.B. Vitrik, J. Phys.: Conf. Ser. 1147(1), 012065 (2019). DOI 10.1088/1742-6596/1147/1/012065. Proc. XXXIII International Conference on Equations of State for Matter, March 1-6, 2018, Elbrus, Kabardino-Balkaria, Russia (Elbrus-2018)
- (40) A.V. Bushman, G.I. Kanel’, A.L. Ni, V.E. Fortov, Intense dynamic loading of condensed matter (Taylor & Francis, 1993)
- (41) K.V. Khishchenko, S.I. Tkachenko, P.R. Levashov, I.V. Lomonosov, V.S. Vorobev, Int. J. Thermophys. 23(5), 1359 (2002). DOI 10.1023/A:1019821126883
- (42) I.V. Lomonosov, Laser and Particle Beams 25, 567 (2007). DOI 10.1017/S0263034607000687
- (43) http://teos.ficp.ac.ru/rusbank/
- (44) http://www.ihed.ras.ru/rusbank/
- (45) E.W. Lemmon, M.O. McLinden, D.G. Friend, NIST Chemistry WebBook, NIST Standard Reference Database Number 69 (National Institute of Standards and Technology, Gaithersburg MD, 20899, 2019), chap. Thermophysical Properties of Fluid Systems. DOI https://doi.org/10.18434/T4D303
- (46) Calculation of the thermophysical properties of water and water vapor. URL http://www.ivpromenergo.ru/page/programs/watersteamcalculator.php