Supplementary Material:– Scaling relation for the adsorption energies at bimetallic magnetic surface: Role of
surface magnetic moment and work-function
The calculated adsorption energy for O and OH molecule in bimetallic magnetic transition metal (TM) surface and the mono-atomic TM surface in close-packed structure is presented in Table-I.
Table 1: Adsorption energy, for stable site of bimetallic TM magnetic systems and mono-atomic TM in close packed surface, for ∗O and ∗OH adsorbate.
Systems
Eads (eV)
Systems
Eads (eV)
∗O
∗OH
∗O
∗OH
MnPd
-6.08
-3.98
Fe
-7.02
-3.83
MnPt
-6
-3.66
Pd
-4.6
-2.17
FePd
-6.05
-3.75
Pt
-4.53
-2.03
FePt
-5.79
-3.47
Co
-4.49
-2.66
Co3Pt
-5.89
-3.56
Ag
-3.73
-2.16
CoPt
-5.37
-3.14
Ni
-3.43
-1.94
CoPt3
-4.96
-2.96
Au
-3.33
-1.49
NiPt
-4.84
-2.5
Cu
-3.2
-2.23
I.1 Parameters associated with scaling relation
Pearson correlation coefficient matrices are calculated for the bimetallic magnetic TM surface, which is a measure of the linear association between two variables and , where . The parameters of the set is presented in Table-II.
Table 2: Average valence electron (), work function (sb) of the clean slab, as well as with the presence of adsorbates (O/OH), magnetic moment of slab, m(sb), net charge transfer (CT) with the presence of O and OH molecule and the adsorption energy of O and OH adsorbate in magnetic bimetallic TM surface.
Systems
m(sb)
CT(O)
(O)
CT(OH)
MnPd
8.5
4.47
2.06
-6.18
-0.36
5.37
-3.98
-0.2
4.17
MnPt
8.5
4.72
1.77
-6
-0.32
5.29
-3.66
-0.19
4.55
FePd
9
4.72
1.7
-6.05
-0.36
5.42
-3.75
-0.17
3.26
FePt
9
4.85
1.72
-5.79
-0.34
5.48
-3.47
-0.16
3.43
Co3Pt
9.25
5.03
1.49
-5.89
-0.33
5.54
-3.56
-0.15
3.26
CoPt
9.5
5.11
1.18
-5.37
-0.31
5.69
-3.14
-0.14
3.52
CoPt3
9.75
5.33
0.77
-4.96
-0.27
5.78
-2.69
-0.13
3.65
NiPt
10
5.33
0.57
-4.84
-0.25
5.75
-2.5
-0.15
3.62
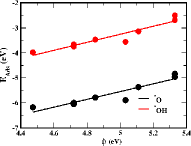
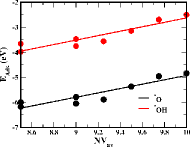
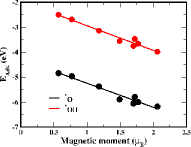
Figure 1: Adsorption energies as a function of (a) work function of slab ((sb)), (b) the average valence electron () and (c) magnetic moment of slab (m(sb)) of bimetallic magnetic TM surface. The adsorption energy scale linearly with all parameters in both O and OH adsobate.
Table 3: Correlation between selected parameters, and the adsorption energy of O and OH adsorbate.
Plots
O
OH
slope
intercept
R2
slope
intercept
R2
(sb) vs Eads
1.56
-13.34
0.89
1.6
-11.28
0.87
NVav vs Eads
0.87
-13.6
0.86
0.89
11.5
0.86
m(sb) vs Eads
-0.96
-4.28
0.95
-0.98
-1.96
0.96
From the corresponding Pearson correlation data matrix, a multiple regression was carried out to determine the individual contribution towards the adsorption process. Multiple regression analysis gives estimates for the coefficients as below
(1a)
(1b)
where and , with = 0,1,2,3, are the regression coefficients for OH and O adsorption respectively.
II Charge transfer through DDEC6 and Bader analysis method
To compare our result we have reported the values calculated from both DDEC6 and Bader analysis. The trend in CT is similar in both the case, only the magnitude of CT is found to be different. For any electronic charge partitioning scheme, the absolute
magnitude of the charges in the particular system is of less importance than their relative
charges. The calculated values are reported in Table-IV.
Table 4: Adsorption energy , DDEC6 and Bader charges of O atom in ∗O and ∗OH adsorption. The charge on H atoms found to be similar ( 0.3 ) for all the system.
Systems
Eads (eV)
DDEC6
Bader
∗O
∗OH
q(O):O
q(O):OH
q(O):O
q(O):OH
MnPd
-6.08
-3.98
-0.36
-0.56
-0.91
-1.18
MnPt
-6
-3.66
-0.32
-0.56
-0.87
-1.15
FePd
-6.05
-3.75
-0.36
-0.55
-0.92
-1.17
FePt
-5.79
-3.47
-0.34
-0.54
-0.89
-1.16
Co3Pt
-5.89
-3.56
-0.36
-0.56
-0.89
-1.19
CoPt
-5.37
-3.14
-0.31
-0.52
-0.83
-1.15
CoPt3
-4.96
-2.96
-0.27
-0.51
-0.75
-1.09
NiPt
-4.84
-2.5
-0.25
-0.53
-0.73
-1.11
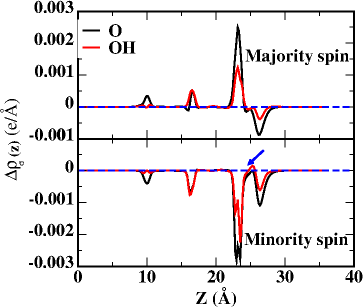
Figure 2: The line profiles of the plane-averaged charge transfer between an adatom and FePt magnetic surface as a function of the z coordinate perpendicular to the surface, , where . The arrow mark show the charge depletion in interface region for ∗OH adsorption.