11in
Vol.0 (20xx) No.0, 000–000
\vs\noReceived 2019 June 24; accepted 2019 October 15
First Time-Resolved CCD Photometry and Time-series Analysis of NSV 13601
Abstract
We present the first results of a time-resolved CCD photometric and time-series analysis of NSV 13601, a variable star of Pegasus constellation. The 14” SCT of Maharaja Krishnakumarsinhji Bhavnagar University(MKBU) was used for observations. Analysis was performed both in Vstar and Period04 software and compared their results. The main results are as follows: From data analysis, it’s period, 77.784 d(MKBU Data V)(VStar), 77.632 d(MKBU Data Ic)(VStar), 77.058 d(MKBU Data V)(Period04) and 49.560 d(MKBU Data Ic)(Period04). It’s V and I mean magnitudes for MKBU Data are 12.203 (V) and 11.292 (I) mag respectively. We confirm it as a variable star.
keywords:
Stars: individual: NSV 13601 — stars: oscillations — techniques: photometric.1 Introduction
NSV 13601111https://www.aavso.org/vsx/index.php?view=detail.top&oid=52225(RA: 21:13:01.24, DEC: +18:56:29.2), an eclipsing binary type variable star in the Pegasus constellation.
Many astronomical databases were searched for collecting details about this star, the details are given as below,
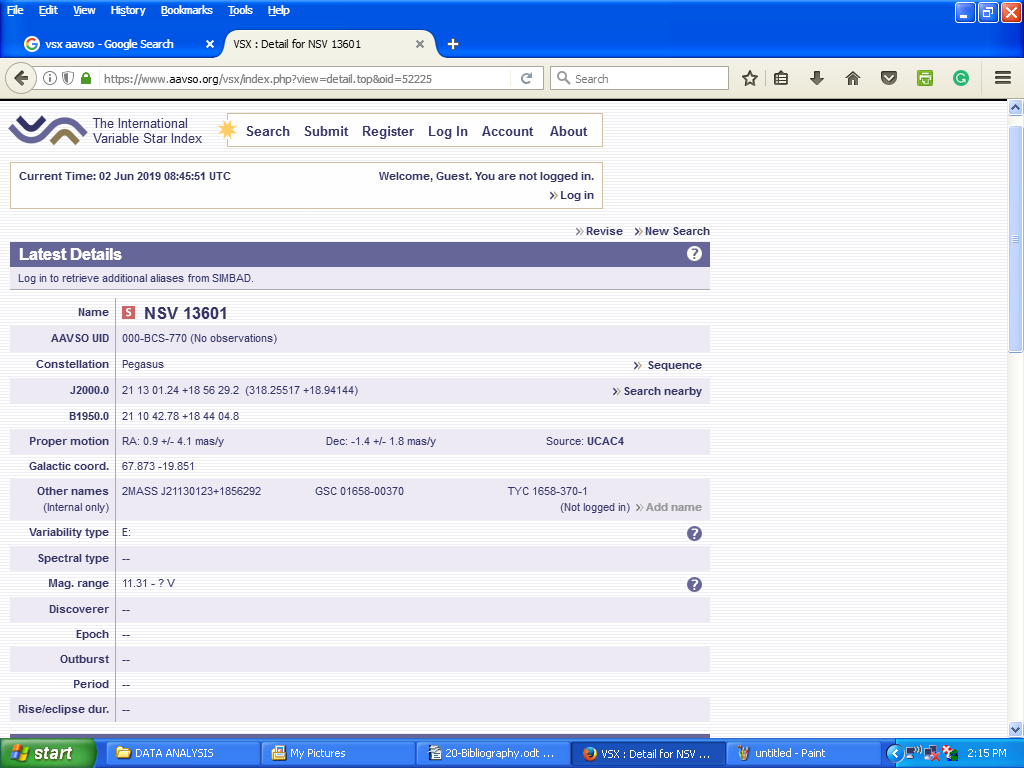
On VSX database222https://www.aavso.org/vsx/, It is designated as Suspected Variable with Mag. (11.31 - ? V) and having variability type as E. It’s other names are 2MASS J21130123+1856292, GSC 01658-00370 and TYC 1658-370-1.
On GCVS database333http://www.sai.msu.su/gcvs/cgi-bin/search.htm, it’s type is E:, magnitude range is Max.: 13. and Min.: < 13.5.
Many other astronomical databases like, CDS portal444http://cdsportal.u-strasbg.fr/, CRTS DR3555https://crts.iucaa.in/CRTS/, The Catalina survey666http://crts.caltech.edu/, Hipparcos777https://www.cosmos.esa.int/web/hipparcos, The Hipparcos Main Catalog888https://heasarc.gsfc.nasa.gov/W3Browse/all/hipparcos.html, DASCH(apass) Catalog999http://dasch.rc.fas.harvard.edu/index.php, gaia101010https://www.cosmos.esa.int/web/gaia/dr2, Hipparcos-2111111https://www.cosmos.esa.int/web/hipparcos/hipparcos-2, ASAS-SN121212https://asas-sn.osu.edu/variables and AAVSO131313https://www.aavso.org/data-download were searched, but no relevant information was found about NSV 13601.
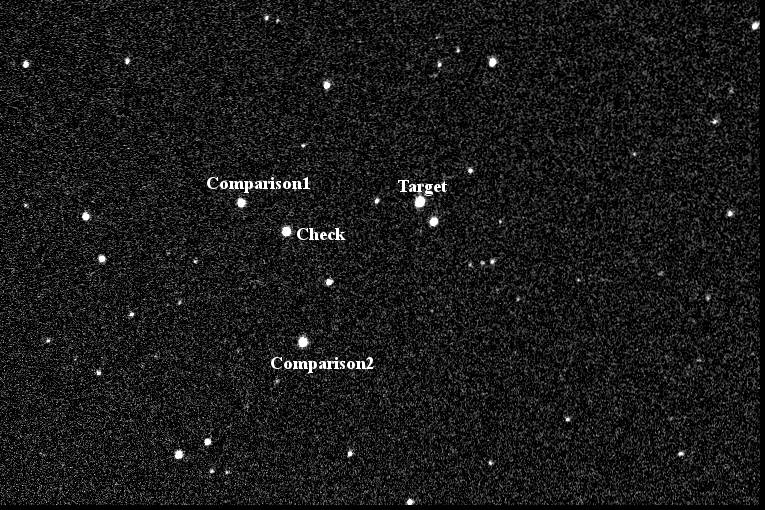
After collecting all these information about Target Star, finder chart was prepared from AAVSO star chart plotter along with it’s photometry table, comparison and check star were selected from the table nearest to the variable star and with magnitude very close to target variable star. All the three stars were in the same CCD frame.
The standard CCD differential photometry was performed and details about variable star, comparison star and check star is given in Table-2. Also, MKBU CCD (V)image is given in Fig. 1.
Total of 34 nights worth of data was collected and total number of frames were 170 each in (V) and (Ic) filters respectively.
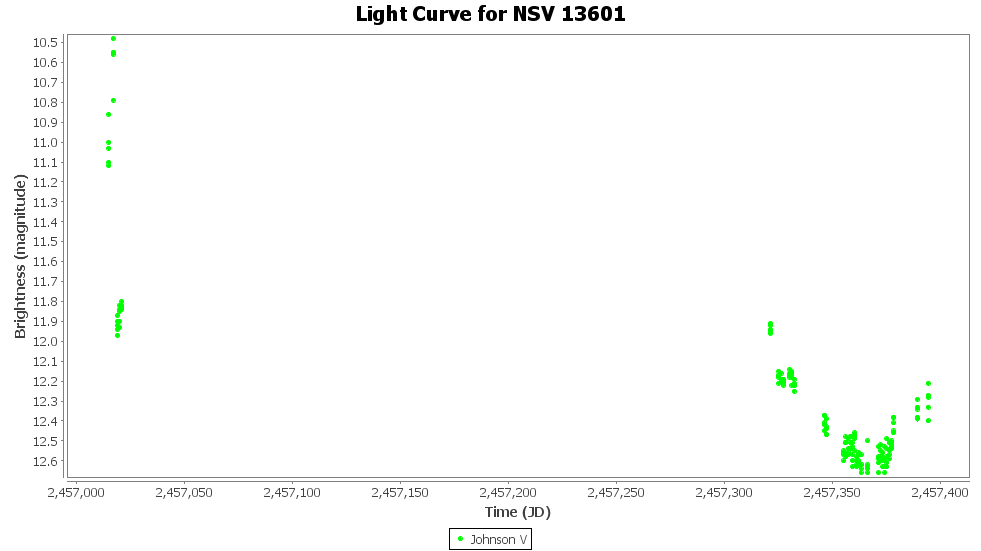
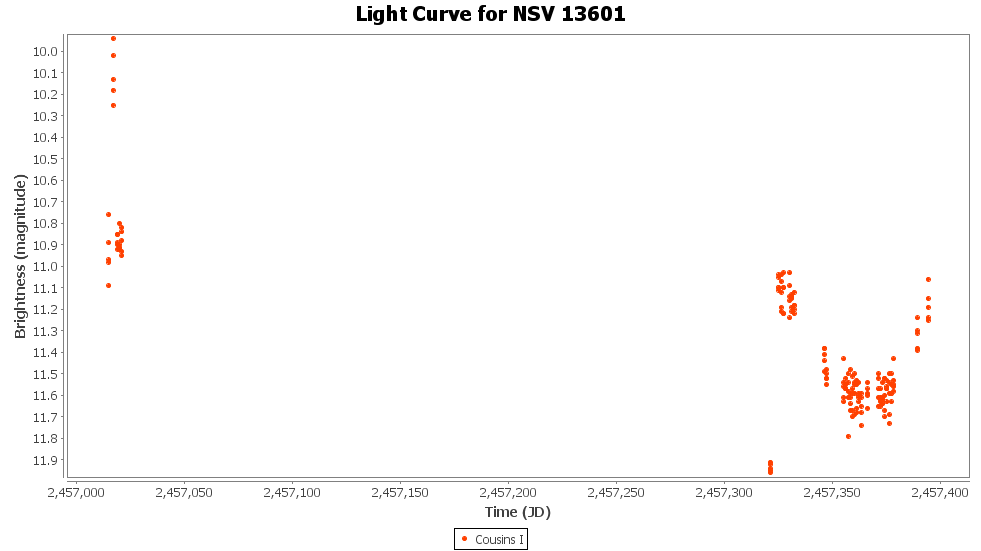
Light curves were prepared for MKBU Data-V and MKBU Data-Ic as shown in Fig. 2 and 5 respectively, for further time-series analysis.
2 Methodology
2.1 Instrumentation
All the photometric data analyzed for this paper were obtained using 14” optical
telescope; Celestron Schmidt-Cassegrain reflector telescope mounted at MK
Bhavnagar University Observatory, Bhavnagar (Lat: 21.7542° N ; Long: 72.1304° E),
India.141414https://www.google.com/maps/place/Bhavnagar+Observatory/@21.7543468,72.1303431,19z
/data=!4m5!3m4!1s0x0:0x30504b9860ad6057!8m2!3d21.7542085!4d72.1303511?hl=en(Bhatnagar et al. 2001)
The automated Observatory contains a 14” Celestron Schmidt-Cassegrain reflector type Telescope (D = 355.6mm, F = 3910mm, f/11) mounted on a Equatorial mount. Telescope has an SBIG ST-7XME CCD Camera(Table-1) along with SBIG CFW-8A filter wheel with Johnson-Cousins UBVRI photometric filters151515https://en.wikipedia.org/wiki/Photometric_system(Bessell 1990). The telescope has two stepper motors (Aerotech Model 310SML3) for RA and DEC axes which are controlled by micro-stepping stepper motor translators (Aerotech DM8010). The whole system was indigenously developed in collaboration with IUCAA, Pune161616https://www.iucaa.in/ (Inter University Center for Astronomy and Astrophysics). For telescope control SCOPE(by Mel Bartel) was used in conjunction with Cartes Du Ciel. There is an USB connection between CCD and PC for data as well as commands. Astronomy data is locally stored in PC. A GPS receiver is also connected with PC which periodically updates clocks of the computers.
The stepper motors are mechanically coupled to the telescope through a friction drive of ratio 1:24. Thus the movement of telescope is finely controlled by the stepper motor to the tune of 25000 steps per rotation in both the axes resulting in about 2.16 arc sec per step accuracy. Friction drive was selected to avoid backlash. The friction drive wheels of 1 inch and 24 inch diameter are machined to an accuracy of a few micron and are nitride hardened.
Only V and I, Standard Johnson-Cousins filters were used for this study as other filters were found to have deteriorated by environmental effects so their data were not used.
Technical specifications of MKBU telescope with ST-7XME CCD camera and focal reducer used are given in table-1.171717https://www.qdigital-astro.com/calculator
| CCD camera: | SBIG ST-7XME |
|---|---|
| Telescope: | Celestron 14” f/11 |
| Reducer: | 0.63xReducer |
| Pixel Binning: | 1x1 |
| Image scale: | 0.75 arsec/pixel |
| Focal length: | 2463mm |
| Focal ratio: | 76.93 |
| field of view of CCD camera: | 9.6’ x 6.4’(arcmin, width x height) |
2.2 Observations and data reduction
MaxIm DL photometric image analysis software was used for our data reduction work. All time-series astronomical images were first calibrated for basic noise removal and then all continuous sequences were aligned and photometry performed on them.
For flat fielding twilight images of sky were captured and used daily. After all the images were captured, master files were made for each of these and used for final calibration part.
In MaxIm DL, all the flats, darks and bias files were combined into single standard master file according to different photometry filters. For calibration, these master files were used. The process involved using the object star’s light image and perform calibration using the master calibration files in MaxIm DL. This way all the light data images were calibrated for each observation. Subsequently these calibrated light images were aligned using the alignment tool of the MaxIm DL. These aligned images were integrated to get better signal-noise ratio.
These calibrated and integrated light images were used in differential photometry tool of MaxIm DL, by selection of each individual object star, reference star and check stars. By providing proper inputs to the MaxIm DL this results in a Magnitude Vs JD(Jullian Day) graph in CSV or AAVSO Text format file. The time accuracy is as good as provided by GPS time syncing.
An object star, one check stars(standard star) and one comparison star were selected to perform differential photometry(Rodrigez-Gil 2005). Standard observatory procedures were used with minimum air-mass considerations.
For data reduction(calibration), flats field frames, dark frames and bias frames as well as light frames were set into MaxIm DL configuration which then collects each of these automatically according to set exposure time and other Johnson-Cousins UBVRI filter value settings. All the light curve analysis were performed in Vstar, to double check the results, Period04 (a standard astronomy time-series analysis package) was also used.
Aladin181818https://aladin.u-strasbg.fr/ was used to compare the captured CCD image with the standard field image.
2.2.1 Differential Photometry
For standardization of CCD photometric method and to calibrate the whole system, 5 known variable stars were studied. One of which was presented in the paper(Gohil and Bhatnagar 2019). This section presents the basic CCD differential photometry performed on suspected variable NSV 13601.
For finding suspected variable star GCVS191919http://www.sai.msu.su/gcvs/gcvs/ and VSX databases were used. NSV 13601, a suspected variable star was shortlisted based on it’s closeness to zenith at the observation location and time. NSV 13601 was selected due to it’s magnitude less than 15, suitable for observing from small telescope located in semi urban area.
All the flats (flat CCD image frames) were also taken in different filters daily at the dusk time when the sky was evenly lit. The CCD’s internal Peltier cooler was kept at it’s minimum temperature (around -20 ∘C) during all the observations to reduce the thermal noise.
The target observation photometric sequences used were optimum for differential photometry(Miles 1998J). The sequence of observation were,
Bias ->Dark ->“Object Star + Comparison Star + Check Star”->Dark->Bias (For each Filter)
The “Object Star + Comparison Star + Check Star” were chosen so that, they were near to each other and could be located in the same CCD image frame.
For aperture photometry, the aperture, annulus and gap were chosen so that the aperture only contained the star’s light and the annulus contained the background.
From the image thus obtained, the intensity was differentially derived by Photometry tool of MaxIm DL202020https://diffractionlimited.com/ for the target using the known comparison and standard stars. The light curve were obtained for the target star from each combined CCD image generated at different times.
Data from V and Ic photometric filter was used as the data from other filters was found to be unreliable due to their environmental deterioration. The standard extinction correction could not be carried out in the conventional photometric way. Therefore for atmospheric corrections, it became advantageous to observe only when the object star, comparison star and check star were at the zenith. The CCD differential photometry takes care of the corrections. Moon less clear (photometric) nights were selected for observations.
The data labeled as MKBU is taken at MKBUs observatory212121https://mkbhavuni.edu.in/mkbhavuniweb/.
Suspected Variable Stars
The data presented here was captured at the available beginning of this study(2014). Since then some additional information on variability have become available. Details given for NSV 13601.
| Star type | AUID | J2000.0 | Magnitudes | |||||
| () | () | () | () | () | () | () | ||
| Object Star | 000-BCS-770 | 21:13:01.24 | 18:56:29.20 | - | 11.31-? | - | - | - |
| Check Star | 000-BCS-776 | 21:13:11.29 | 18:57:12.1 | 11.665(0.155)*̂ | 11.386(0.026)@̂ | 0.279(0.157) | - | 10.833(0.143)$̂ |
| Comparison Star-1 | 000-BCS-777 | 21:13:13.29 | 18:58:03.7 | - | 11.875(0.137)$̂ | - | - | 11.144(0.217)$̂ |
| Comparison Star-2 | 000-BCS-764 | 21:12:37.32 | 19:02:54.9 | 12.478(0.257)*̂ | 11.044(0.023)@̂ | 1.434(0.258) | - | 9.667(0.126)$̂ |
Here, * = Tycho-2 , $ = TASS , @ = ASAS3
2.2.2 Time-series analysis
Time-series analysis on the data collected at MKBU observatory and the results derived, are presented in this section. This time-series analysis was mainly done in Vstar(AAVSO) software.222222http://www.citizensky.org/content/vstar Light curves was generated by MaxIm DL and directly used as input into VStar software. Time-series analysis was performed to find periods of NSV 13601. Initially Gemini constellation was studied to test and calibrate data capture as well as analysis method. Satisfactory results were generated by analyzing these stars. Then, the time-series analysis was performed on NSV 13601.
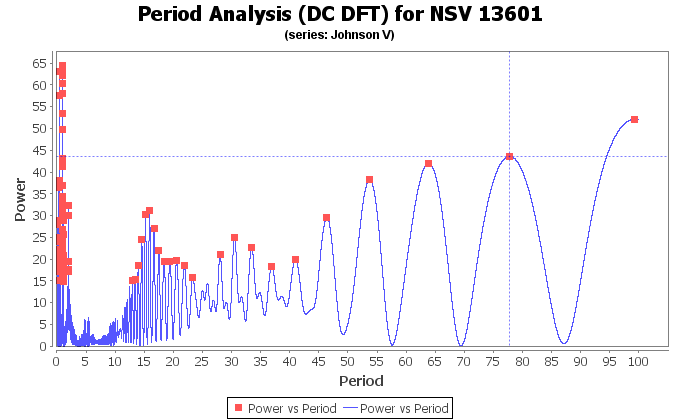
First the LC(Light Curve) were inspected on different time scales in Vstar to roughly find the daily variation of object star. Then the detailed time-series analysis, using DC-DFT(Date compensated Discreet Fourier Transform) facility of Vstar was carried out on the MKBU data. It gave the top frequency hits, which were probable candidates for the object star’s period. Periodogram and Amplitude spectrum were generated and after selecting most probable frequency for the period of variable star, PLC(Phased Light Curves) were drawn. The PLC and residual spectrum was model fit, and mean fit curve were also drawn. This sequence was carried out on all MKBU collected data of variable and suspected variable stars.
In the following sections the respective graphs, figures and tables are given with each star and in the end their period search results are also given in respective tables. Period04 software package232323http://www.univie.ac.at/tops/Period04/ was also used to verify the results, (Period04 is very well known for searching frequency of time-series data using Fourier transform). Accurate results provided by Period04 were also compared with results of Vstar with their respective photometric filters and then the frequency which were common in all the results were selected.
For NSV 13601, scattered data were available from a few sources. The observations at MKBU have produced new data for these suspected variables. Already massive efforts are going on to gather and process data from various sources automatically and update the status.
Presentation of Analysed data:
The following sections present analysis of time series data from MKBU Telescope as well as from other sources (where available) for NSV 13601 using Vstar. Each presented analysis, graphically contains several results from various steps describing either data sufficiency or are checkpoints in analysis. Descriptions given below are for NSV 13601(Fig 2 to 7). The sequence of analyzed data presented is by VSTAR only. We used PERIOD04’s analysis result directly in Table 3 for comparison purpose. This sequence is followed on data from MKBU telescope (for both V and Ic filters). Finally the conclusion drawn are presented.
(Fig. 2) shows light curve(LC) of NSV 13601, it is, Johnson V mag vs JD graph. Only in MKBU Data-Ic filter, LC graph is Cousins Ic mag vs JD. Otherwise for all other data Johnson V filter mag vs JD graph is used.
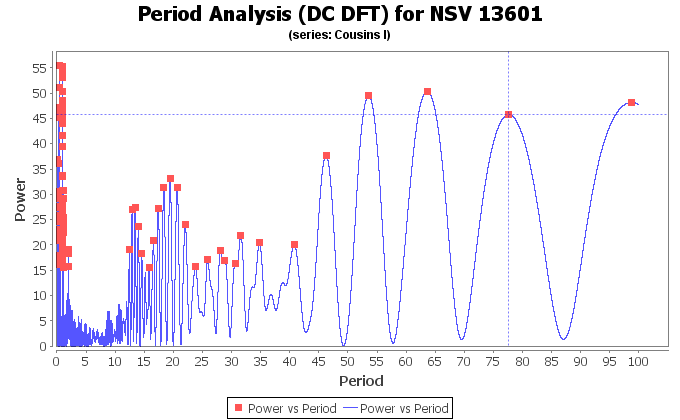
On the time-series, DC-DFT was applied and as a result, top-frequency hits were found along with Periodogram(Fig. 3) and Amplitude spectrum.
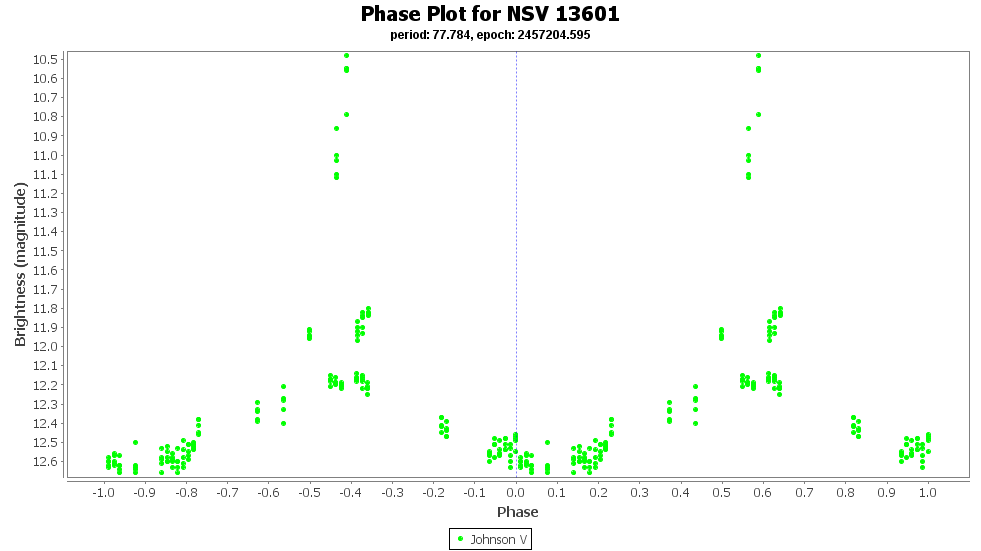
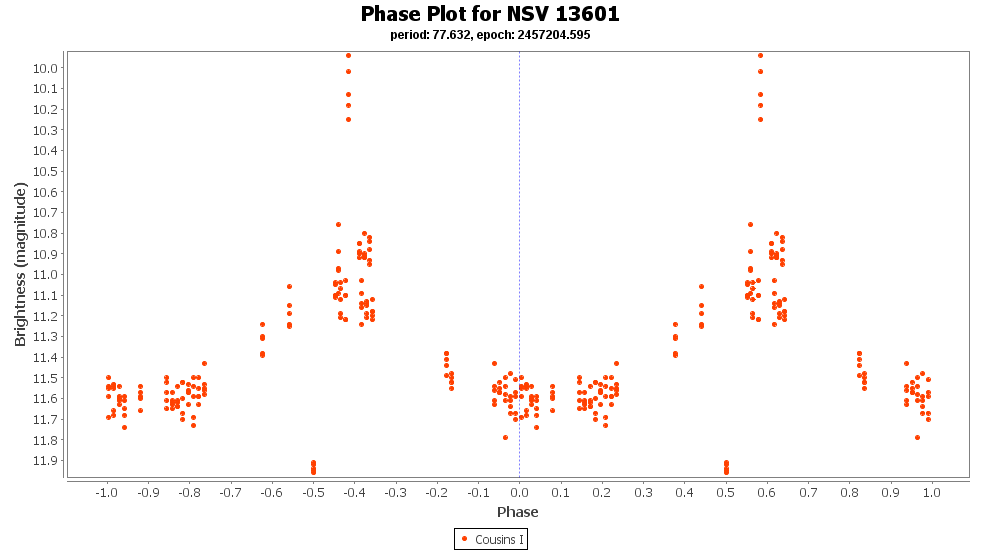
Frequency with highest amplitude was selected as the most probable frequency of the variable star and phased light curve(PLC)(Fig. 4) were drawn. By looking at the PLC it can be reasonably inferred whether the star is a variable or not.
Table - 3 is the results of pre-whitening process, in which every possible frequency is extracted and then that frequency is removed from the remaining data and again Fourier transform is applied on residuals, this process is followed till the residual value reaches near the 0.01. After that it is assured that no other possible frequency of variable star is left in data anymore.
Sometimes when time-series data does not perform/pass these checks, as it should, then Period04’s frequency analysis and Vstar’s Top frequency hits were compared and the most common frequency was selected for the period.
Time-Series Analysis of Suspected Variable Star NSV 13601:
Vstar Analysis:(MKBU Data)
1. Visual Filter (V):
From Figure 2 to 4, LC, DC-DFT periodogram, PLC are shown respectively for MKBU data in V filter.
2. Infrared Filter (Ic):
From Figure 5 to 7, LC, DC-DFT periodogram, PLC are shown respectively for MKBU data in Ic filter.
3 Results
Many of the known variable stars were studied for calibration of MKBUs photometric system and method. Many suspected variable stars were shortlisted and studied by MKBU telescope. Here presented their results. Their period as well as their magnitude were determined. Presented below are the summarized results of analysis of the selected stars.
| Star Name | MKBU Data(V) | MKBU Data(Ic) |
|---|---|---|
| () | () | () |
| VStar | 77.784 | 77.632 |
| Period04 | 77.058 | 49.560 |
4 Conclusion
Conclusion: NSV 13601 is a variable star. Some more study is required to define it’s variability more precisely.
Our aim and strategy was to first standardize our photometric system and then search for suspected variables, maybe short-period, and do their time-series analysis. As a result of our study, we found all of our suspected variable star’s periods and magnitude to the scientifically satisfactory level.
At the time of our selection( 2014) for NSV 13601, it was classified as a suspected variable status on VSX, CDS and other astronomical databases.
*Recently(May 15, 2019) it was found that some databases (mainly CDS) have been updated and are now showing some of earlier suspected stars as variable stars. VSX is still showing them as suspected as before.(as on 1/06/2019) (sample screen shot in Fig. 8)
Acknowledgements.
We would like to acknowledge the M. K. Bhavnagar University for providing Astronomical research facility at Kumari Aanya Binoy Gardi Observatory and We would also like to thank, IUCAA(Inter University Center For Astronomy And Astrophysics), AAVSO(American Association for Variable Star Observers), VSX(Variable Star Index)(AAVSO).References
- Bhatnagar et al. (2001) Bhatnagar S.P., Dodia U., Anandram M. N., Kagli B. A., Gupta R., 2001, JISI, 31, 234, 239
- Bessell (1990) Bessell M. S., 1990, PASP, 102, 1181B
- Rodrigez-Gil (2005) P. Rodrigez-Gil, 2005, A & A, 431, 289
- Gohil and Bhatnagar (2019) Gohil V. A., Bhatnagar S. P., 2019, RAA, 19, 9, 125
- Miles (1998J) Miles, R., 1998J, BAA, 108, 65M