uGMRT search for cold gas at towards red quasars
Abstract
We present results from our search for H i 21-cm and OH 18-cm absorption at towards red quasars showing strong Mg ii absorption using uGMRT. The quasars J15011822 and J15215508 show multiple strong associated Mg ii absorption at and signature of reddening in their optical spectra. We report the detection of H i 21-cm absorption towards J15215508 at the systemic redshift of the quasar, with (H i) cm-2 for spin temperature of 100 K and unit covering factor. The H i 21-cm absorption is offset from the blueshifted strong Mg ii absorbers by 1500 km s-1. We do not detect H i 21-cm absorption at the redshift of the associated Mg ii absorption and at the systemic redshift towards J15011822. We argue that lack of one-to-one correspondence between Mg ii and H i 21-cm absorption could be related with clumpiness of the neutral gas and the radio and optical sightlines probing different volume of the gas. We find that the presence of strong associated Mg ii absorption and reddening in the optical spectra of the quasars lead to an increased detection rate of associated H i 21-cm absorption at 1. We also report non-detection of intervening OH absorption ([OH][H i] (1-4)) at = 1.3 towards two red quasars, J08505159 and J08523435, which show strong metal and H i 21-cm absorption and the 2175 Å dust extinction bump.
keywords:
galaxies: quasar: absorption line galaxies: ISM1 Introduction
H i 21-cm absorption towards radio-loud quasars can be used to probe the cold neutral gas in intervening galaxies, usually selected via the presence of or Mg ii absorption in the quasar’s optical spectra (e.g. Briggs & Wolfe, 1983; Lane, 2000; Curran, 2010; Kanekar et al., 2009; Kanekar et al., 2014; Gupta et al., 2009, 2012; Srianand et al., 2012; Dutta et al., 2017a; Dutta et al., 2017b; Dutta et al., 2017c). The average detection rate of H i 21-cm absorption in strong Mg ii systems is 20% over , and has been found to increase with equivalent width of Mg ii and Fe ii absorption (Gupta et al., 2012; Dutta et al., 2017b), while the detection rate in damped absorbers is 10-20% (Srianand et al., 2012; Kanekar et al., 2014). The neutral gas in the environment of radio-loud active galactic nuclei (AGNs) can be probed by H i 21-cm absorption as well (e.g. van Gorkom et al., 1989; Gupta et al., 2006; Chandola et al., 2011; Curran et al., 2013; Allison et al., 2014; Geréb et al., 2015; Maccagni et al., 2017; Aditya & Kanekar, 2018a, b; Dutta et al., 2018, 2019; Grasha et al., 2019). Such studies find a typical detection rate of 30% in radio galaxies. However, searches for H i 21-cm absorption associated to AGNs have been mostly unsuccessful (10% detection rate). This could reflect either a lack of neutral gas along the line of sight due to geometric effects (e.g. Gupta et al., 2006) or stronger ionization by the high- AGNs compared to the low- samples (e.g. Curran et al., 2008; Grasha et al., 2019).
Complementary to H i 21-cm absorption, OH 18-cm absorption lines can be used to study the cold molecular phase of the gas. The OH radical is one of the common constituents of diffuse and dense molecular clouds and one of the best tracers of molecular hydrogen in the Galaxy (Liszt & Lucas, 1996, 1999). In addition, the H i 21-cm and OH 18-cm absorption lines, if detected at high significance level, can be used to place tight constraints on the variations of fundamental constants of physics (Uzan, 2003). However, only six OH absorbers at cosmologically significant redshifts in radio wavelengths are known to date (Chengalur et al., 1999; Chengalur & Kanekar, 2003; Kanekar & Chengalur, 2002; Kanekar et al., 2005; Gupta et al., 2018).
Quasars obscured by dust, either in intervening galaxies along the line-of-sight or in the quasar host galaxy itself, could present optimal sightlines to detect cold gas associated with the dust via H i and metal absorption. Such quasars could be identified on the basis of their red optical, infrared or optical-to-infrared colours and in radio-selected samples (Gregg et al., 2002; Ross et al., 2015; Glikman et al., 2018). We note, however, that the red colours of quasars could also arise due to their intrinsically red spectral energy distribution (SED), for example due to synchrotron emission from the radio jets (Srianand & Kembhavi, 1997; Whiting et al., 2001).
There have been observations of H i 21-cm absorption arising from dusty intervening galaxies that cause reddening in the optical spectra of the background quasars (Srianand et al., 2008; Dutta et al., 2017b). In case of associated H i 21-cm absorption, Carilli et al. (1998) have found a high (80%) detection rate in a sample of five radio-selected optically-faint quasars (see also Ishwara-Chandra et al., 2003). Chandola & Saikia (2017) have found that radio galaxies with redder mid-infrared colours from Wide-field Infrared Survey Explorer (WISE; Wright et al., 2010) show a higher detection rate of H i 21-cm absorption. Further, Curran et al. (2006) have found that the molecular fraction and line strength of associated OH absorbers are related with the optical-to-infrared colour of the quasars.
However, there have also been studies that find low detection rates of associated H i 21-cm absorption in obscured quasars. Yan et al. (2016) have found a 20% detection rate in obscured AGNs at , selected on basis of optical-to-near-infrared colours, although their results could be limited by presence of radio frequency interference (RFI) and absence of accurate spectroscopic redshifts. Recently, Glowacki et al. (2019) have found a detection rate of 12.5% (25% for sources with spectroscopic redshifts) in a sample of quasars selected on the basis of their radio flux and either faint optical magnitude or red WISE mid-infrared colour. All the three H i 21-cm absorption detected by them are from the sub-sample of optically-faint quasars. However, the lack of H i 21-cm absorption in their WISE mid-infrared colour-selected sub-sample is not statistically significant.
Here we explore an alternative method to select dust-obscured red quasars to search for H i 21-cm and OH 18-cm absorption quasars showing optical reddening and strong Mg ii absorption. One expects dust to be associated with metal-enriched gas, and or reddening of quasars has been found to depend on the equivalent width of strong Mg ii absorption (Budzynski & Hewett, 2011). Dutta et al. (2017b) have demonstrated that intervening H i 21-cm absorption arises on an average in systems with stronger metal absorption and towards quasars which show higher reddening [i.e. ] due to dust associated with the H i and metal absorption in their optical spectra. We investigate here whether red quasars showing strong associated Mg ii absorption give rise to H i 21-cm absorption as well. According to hierarchical models of gas-rich major merger-driven galaxy formation, in the initial black hole growth phase fueled by gas inflow, the nuclear region is buried in dust (Sanders & Mirabel, 1996; Hopkins et al., 2008). Associated H i 21-cm absorption from red quasars is thus an useful tool to probe feedback processes in this dust-enshrouded phase of quasar evolution. Recently, we have obtained high detection rate (84%) of H i 21-cm absorption in 0.2 radio-loud galaxy mergers (Dutta et al., 2018, 2019). Dust-reddened quasars can allow us to probe the merger phase at higher redshifts as well.
To address the paucity of H i 21-cm and OH 18-cm absorption at high-, we have started to search for these lines in previously unexplored redshift ranges towards red quasars, using the newly commissioned upgraded Giant Metrewave Radio Telescope (uGMRT; Gupta, 2014) receivers. These receivers offer almost continuous frequency coverage over MHz, thus allowing one to search for absorption lines in redshift ranges that were not previously accessible to radio interferometers in relatively RFI-free environment, e.g. H i 21-cm at and OH 18-cm at . Such searches would be useful to plan future observations with the Square Kilometre Array precursors, ASKAP (Schinckel et al., 2012) and MeerKAT (Booth & Jonas, 2012). Note that although the Green Bank Telescope currently offers broad frequency coverage below 1 GHz, it is a single dish and hence more affected by RFI. Here we present the results from our search for intervening OH 18-cm main absorption lines at towards the red quasars J085042.24515911.6 (hereafter J08505159) and J085244.74343540.4 (hereafter J08523435); and our search for associated H i 21-cm absorption at towards the red quasars J150129.87182221.1 (hereafter J15011822) and J152134.17550857.2 (hereafter J15215508). The details of the sources and observations are presented in Section 2. The results on individual sources are presented in Section 3. These are discussed and summarized in Section 4.
2 Sample & Observations
2.1 Source Selection
2.1.1 Sources for OH 18-cm absorption search
We selected J08505159 and J08523435 to search for OH 18-cm absorption because they both show strong H i 21-cm and metal absorption lines, dust reddening [ 0.3-0.4] and the 2175 Å ultraviolet (UV) extinction bump (Srianand et al., 2008). Note that the broad absorption bump at 2175 Å is a spectroscopic feature due to extinction by interstellar dust, most likely polycyclic aromatic hydrocarbons, that is seen in the Milky Way, Magellanic Clouds, as well as high- absorption-line systems (Draine, 2003; Wang et al., 2004; Jiang et al., 2011). Hence, while the reason for the reddening of the optical continuum of the quasar could be degenerate (see Section 1), the 2175 Å bump confirms the presence of dust unambiguously.
The above two quasars were part of a systematic survey of H i 21-cm absorption in strong Mg ii systems (Gupta et al., 2009). Strong absorption from Mg ii [rest equivalent width (REW) of Mg ii 2796, = 4.6 Å and 2.9 Å for J08505159 and J08523435, respectively], Fe ii (REW of Fe ii 2600, = 2.3 Å and 2.1 Å for J08505159 and J08523435, respectively), as well as weaker transitions of Mn ii, Zn ii, Cr ii and Ti ii, are detected at in the Sloan Digital Sky Survey (SDSS; York et al., 2000) spectra of the quasars. In addition, the 9.7 silicate feature is detected in absorption from the system towards J08523435 (Kulkarni et al., 2011). The background radio sources are relatively weak, with 1.4 GHz flux density of 63 mJy and 69 mJy for J08505159 and J08523435, respectively.
In the H i 21-cm absorption survey of strong Mg ii systems, there is another system associated with a 2175 Å bump towards the red quasar J095631.05404628.2 (J09564046; Gupta et al., 2012). This system is very similar to J08505159 and J08523435 in terms of metal line strength and reddening properties. However, the background radio source in this case is resolved into two components in the GMRT 610 MHz image and no H i 21-cm absorption is detected towards it, leading to constraint on the spin temperature (Ts) and covering factor () of the gas, Ts 7800 K (for details see section 5.2 of Gupta et al., 2012). Hence, we did not consider this system for OH 18-cm search.
2.1.2 Sources for H i 21-cm absorption search
We identified the red quasars, J15011822 and J15215508, from the SDSS Data Release 12 (DR12; Alam et al., 2015), specifically using the Mg ii catalog of Zhu & Ménard (2013). We searched for strong Mg ii absorption [ Å] whose redshifted H i 21-cm line can be observed with uGMRT, towards radio-loud quasars [1.4 GHz flux mJy in the Faint Images of the Radio Sky at Twenty-Centimeters (FIRST; White et al., 1997) catalog]. We restricted to sources where the optical and radio sightlines match within radius. We then selected those quasars which have colour excess [] greater than of the distribution, where is calculated by comparing the colour of the quasar to the median colour for SDSS quasars at the same redshift. This led to a sample of fifteen red quasars. We visually inspected the optical spectra of these quasars, and after removing systems with false identification of Mg ii or incorrect estimate of , Broad Absorption Line (BAL) quasars, and double radio sources (to avoid ambiguity between optical and radio sightlines), we were left with eight quasars. Five of them show intervening Mg ii absorption over 0.6-2.0 and three show associated (within 3000 km s-1 of the systemic redshift) Mg ii absorption at 1.1.
We fitted the quasar SDSS spectra by using the composite spectra of Selsing et al. (2016) and Vanden Berk et al. (2001), reddened by the Milky Way, Small Magellanic Cloud (SMC), Large Magellanic Cloud (LMC) or LMC2 supershell extinction curves (Gordon et al., 2003). Both the composite spectra give similar results. We assume that the reddening is caused due to dust present in the strong Mg ii absorption. For details of the SED fitting procedure we refer to Srianand et al. (2008). The reddening of the quasars thus obtained is in the range of 0.1-0.3, which is significant at on comparing to control sample of quasars at the same redshift (see Section 3.2 for further details). Of the above eight quasars, six have been previously searched for H i 21-cm absorption at the redshift of the strong Mg ii system, with two detections (Ishwara-Chandra et al., 2003; Gupta et al., 2009; Kanekar et al., 2009; Dutta et al., 2017b) 111One of the quasars, J092136.23621552.1, showing intervening Mg ii and H i 21-cm absorption (Dutta et al., 2017b), has been searched for and not detected in associated H i 21-cm absorption (Aditya et al., 2016). However, there is no associated Mg ii absorption ( 1 Å) detected in the SDSS spectrum as well.. Results of the H i 21-cm absorption search towards the remaining two quasars, showing multiple strong associated Mg ii absorption at , are presented in this work.
2.2 Observations
The radio spectral line searches were conducted using Band 4 (550850 MHz) receivers of the uGMRT and the GMRT software back-end as the correlator (Proposal IDs: 32_050, 33_100, 34_022, 34_034). The details of the observations are listed in Table 1. The observations were carried out using 2, 4 or 16 MHz baseband bandwidth split into 512 channels. During the observations, standard calibrators were regularly observed for flux density, bandpass and gain calibration. The data were acquired in parallel hand correlations, and were reduced using the National Radio Astronomy Observatory (NRAO) Astronomical Image Processing System (aips) following standard procedures (see Dutta et al., 2016, for details).
| Quasar | Date | Time | Central | Spectral | Channel | ||
|---|---|---|---|---|---|---|---|
| Frequency | coverage | width | |||||
| (h) | (MHz) | (km s-1) | (km s-1) | ||||
| (1) | (2) | (3) | (4) | (5) | (6) | (7) | (8) |
| J08505159 | 1.894 | 1.3265 | 2017 July 02, 03 | 8.4 | 716.3 | 1745 | 3.4 |
| J08523435 | 1.652 | 1.3095 | 2017 July 22, 23 | 25.7 | 721.5 | 1730 | 3.4 |
| 2018 August 11, 13, 19 | |||||||
| J15011822 | 1.186 | 1.1859, 1.1818 | 2018 January 19 | 5.8 | 650.4 | 1920 | 3.8 |
| J15215508 | 1.070 | 1.0450, 1.0593, 1.0654 | 2018 January 01 | 6.1 | 692.2 | 7200 | 14.1 |
| 2018 August 12 | 5.3 | 686.1 | 910 | 1.8 |
Notes. Column 1: quasar name. Column 2: redshift of quasar. Column 3: redshift of strong Mg ii absorption. Column 4: observation date. Column 5: total time on-source in hours. Column 6: central observing frequency in MHz. Column 7: spectral coverage in km s-1. Column 8: channel width in km s-1.
3 Results
The results derived from the uGMRT observations are listed in Table 2. All the radio sources are compact in the continuum maps (spatial resolution of ). The absorption spectra (see Fig. 1) are extracted at the location of the peak continuum flux density of the radio sources. Below we discuss the results for each source in detail.
| Quasar | Peak | Spectral | ||
| Flux | rms | |||
| Density | ||||
| (mJy | (mJy | (km s-1) | ||
| beam-1) | beam-1) | |||
| (1) | (2) | (3) | (4) | (5) |
| J08505159 | 65 | 1.1 | 0.017 | 0.224 (OH) |
| J08523435 | 58 | 0.4 | 0.007 | 0.092 (OH) |
| J15011822 | 243 | 0.7 | 0.003 | 0.144 (H i) |
| J15215508 | 195 | 1.0 | 0.0210.005 | 0.650.09 (H i) |
Notes. Column 1: quasar name. Column 2: peak flux density in mJy beam-1. Column 3: spectral rms in mJy beam-1 per 3 km s-1. Column 4: peak optical depth in case of detection or 1 upper limit in case of non-detections. Column 5: integrated optical depth in case of detection or 3 upper limit in case of non-detections. Note that the upper limits corresponding to the OH 1667 MHz line towards J08505159 and J08523435 have been estimated for velocity width of 5 km s-1, while the upper limit for the H i 21-cm line towards J15011822 have been estimated for velocity width of 100 km s-1.
| Quasar | Dust | (H i) | ( Ts) | |
|---|---|---|---|---|
| Model | ||||
| (cm-2) | (K) | |||
| (1) | (2) | (3) | (4) | (5) |
| J08505159 | LMC2 | 0.27 0.01 | 5.2 1.0 | 191 |
| J08523435 | LMC2 | 0.36 0.01 | 7.0 1.3 | 534 |
| J15011822 | SMC Bar | 0.24 0.01 | 8.7 1.0 | |
| J15215508 | SMC Bar | 0.15 0.01 | 5.3 0.8 | 4473 |
Notes. Column 1: quasar name. Column 2: Best-fitting dust extinction model. Column 3: Best-fitting . Column 4: (H i) in units of (cm-2) obtained from the relation between (H i) and (Gordon et al., 2003). is the dust-to-gas ratio relative to the best-fitting dust model. Column 5: ( Ts) (K) obtained by comparing the (H i) from SED fit with the observed H i 21-cm . The SED fit parameters for J08505159 and J08523435 are taken from Srianand et al. (2008).
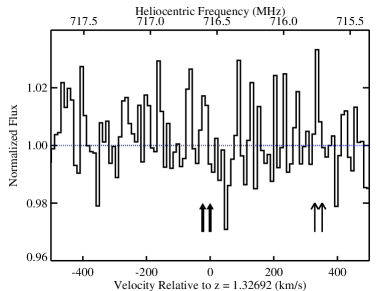
3.1 OH 18-cm absorption towards J08505159
Srianand et al. (2008) have modeled the SED of the quasar J08505159 using the SDSS composite spectrum of Vanden Berk et al. (2001) and different dust extinction curves redshifted to the rest-frame of the intervening Mg ii absorption. The LMC2 supershell extinction curve is found to give best fit to the quasar SED, with 0.3. The SED modeling and the versus (H i) relationship in the LMC (Gordon et al., 2003) gives (H i) cm-2, where is the dust-to-gas ratio relative to the LMC. The results from SED fitting are listed in Table 3. The H i 21-cm absorption consists of two components (full-width-at-half-maximum, FWHM = 24 km s-1 and 49 km s-1) separated by 23 km s-1, with an integrated optical depth of 15 km s-1.
We do not detect absorption from the two OH 18-cm main lines in this system (see panel (a) of Fig. 1). We reach a 3 optical depth limit for the 1667 MHz line of 0.224 km s-1 over a velocity width of 5 km s-1. This translates to a column density upper limit of (OH) (Tex/3.5 K) (1/) cm-2, where Tex is the excitation temperature and is the covering factor (following Liszt & Lucas, 1996; Stanimirović et al., 2003). Tex = 3.5 K is the peak of the lognormal function fitted to the Tex distribution of Galactic OH absorbers (Li et al., 2018). The radio source is compact in the Very Long Baseline Array (VLBA) 20-cm sub-arcsecond-scale map presented in Gupta et al. (2012), which recovers all the arcsecond-scale flux. Hence, we take to be unity. Using the (H i) obtained from SED fitting discussed above and assuming = 1, we can put a limit on the abundance ratio [OH][H i] .
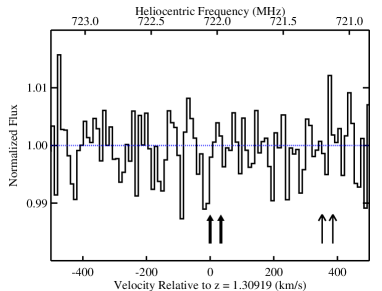
3.2 OH 18-cm absorption towards J08523435
The SED of the quasar J08523435, similar to J08505159, is best fit with LMC2 extinction curve and 0.4 (Srianand et al., 2008). The (H i) derived from SED modeling is cm-2. The H i 21-cm absorption from the Mg ii system comprises a narrow (FWHM = 23 km s-1) and a broad (FWHM = 63 km s-1) component, separated by 34 km s-1. The total optical depth of the absorption is 7 km s-1.
We initially detected a tentative absorption feature near the expected position of the redshifted OH 18-cm main lines from this system in 2017. Hence, we obtained deeper observations of this system in 2018 (see Table 1). We observed this system for a total of 26 h on-source, reaching a spectral rms of 0.4 mJy beam-1 per 3 km s-1 channel. However, we do not detect any significant absorption feature in the final spectrum. The spectrum shown in panel (b) of Fig. 1 is obtained by coadding the noise-weighted normalized spectra from the five different observing runs. The tentative absorption feature is not produced consistently in all the runs as well as in the two different polarizations. The initial tentative feature could have been due to narrow sporadic low-level RFI (at 721.5 MHz), that is not significant in the final coadded spectra, due to the Doppler shift caused by heliocentric motion of the Earth between the different observing runs.
The final spectrum has a 3 optical depth sensitivity for the 1667 MHz line of 0.092 km s-1 over a velocity width of 5 km s-1. This corresponds to (OH) (Tex/3.5 K) (0.68/) cm-2. We estimate = 0.68 based on the ratio of the flux density of the strongest component of the radio source detected in the VLBA 20-cm map (Gupta et al., 2012) to its arcsecond-scale flux density. Assuming = 1 and the (H i) estimated from SED fitting, we get [OH][H i] .
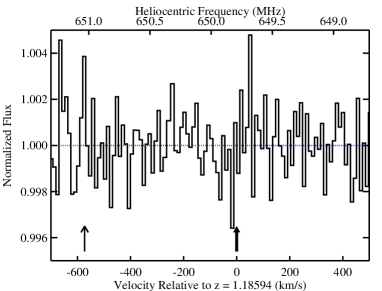
3.3 H i 21-cm absorption towards J15011822
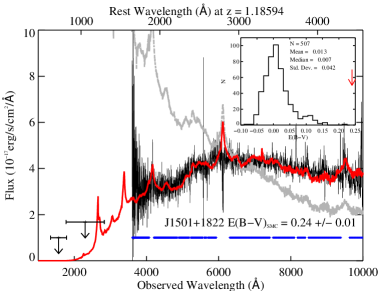
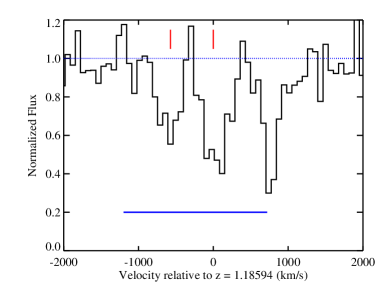
The SDSS spectrum of the quasar J15011822 is intriguing as it is devoid of any prominent broad emission lines. We identify the redshift of the quasar from [O ii] emission line and associated Mg ii absorption line as = 1.1859 0.0007. There is a second Mg ii absorption 570 km s-1 blueward at =1.18177 (see panel (a) of Fig. 3). The Mg ii 2796 transition at =1.18594 is blended with the Mg ii 2803 transition at =1.18177, leading to Å. For the =1.18177 absorption, Å. Weak Fe ii absorption lines are also detected from these two systems, with Å at and Å at =1.18594. For both the systems, we get a upper limit on REW of Mg i Å. From integrating the [O ii] emission line, we get [O ii] luminosity of erg s-1 (uncorrected for dust). Quasars with associated Mg ii absorption have been found to show significant excess in [O ii] emission, which could be due to either enhanced star formation in the quasar host or the AGN itself (Shen & Ménard, 2012; Khare et al., 2014). If the [O ii] emission in this case is caused by starburst, then the star formation rate (SFR), uncorrected for dust, would be M⊙ yr-1 (following Kewley et al., 2004).
The SDSS spectrum of the quasar is best fit with the SMC Bar extinction law and , assuming that the reddening is due to dust associated with the strong Mg ii absorption at the systemic redshift (see Fig. 2). The error in include the uncertainties in the extinction law parameters. Note that there are no strong intervening metal line absorption at 0.4 detected in the SDSS spectrum, so the reddening of the quasar is most likely due to the associated Mg ii system. We further applied the same SED fitting procedure with SMC Bar extinction law to a control sample of non-BAL quasars in SDSS, within of and of (21) of the quasar and having spectra with signal-to-noise ratio 10. The details of the control sample are given in Fig. 2. The standard deviation of the distribution of the control sample reflects the typical systematic error in the SED fitting procedure due to the dispersion of the non-reddened quasar SED. In this case, we find that the quasar is reddened at a significance level of . The best-fitting SED is also found to be consistent with the Galaxy Evolution Explorer (GALEX) UV photometry (Fig. 2). Here for the UV part of the wavelength, we have taken the composite spectrum of Telfer et al. (2002). From the near-UV (NUV) flux, we obtain the luminosity as W Hz-1.
H i 21-cm absorption is not detected from this quasar at the redshift of either Mg ii absorption (see panel (c) of Fig. 1). From the observed optical depth limit, the upper limit on (H i) is (Ts/100 K) (1/) cm-2 per 100 km s-1 linewidth. On the other hand, from SED fitting we expect (H i) cm-2. Here is the dust-to-gas ratio relative to the SMC. Comparing the two (H i) estimates, we can constrain ( Ts) K. The radio source is classified as a flat-spectrum radio source (Healey et al., 2007), with flux of 55 mJy at 8.4 GHz and 97 mJy at 4.8 GHz, and a spectral index of between 650 MHz and 4.8 GHz. Considering the flat spectral index, the radio emission is likely to be compact, but in the absence of high resolution images the covering factor is undetermined.
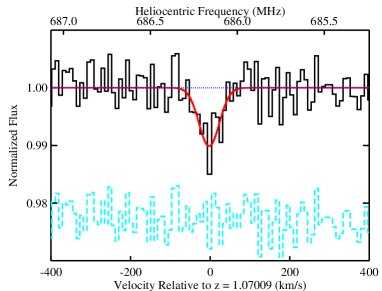
3.4 H i 21-cm absorption towards J15215508
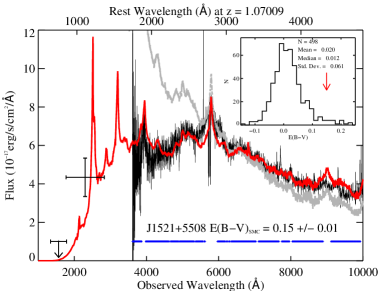
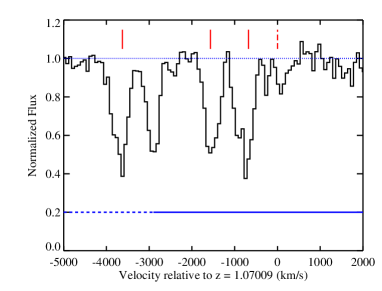
The red quasar J15215508 shows broad emission lines in its SDSS spectrum at = 1.0701 0.0004. This is an interesting quasar which has three blueshifted Mg ii absorption at 1.04504, 1.05926 and 1.06540 (see panel (b) of Fig. 3). The Mg ii absorption lines could be arising from strong outflows from the quasar or from an over-density of galaxies clustering around the quasar. The Mg ii 2796 transition at =1.06540 is blended with the Mg ii 2803 transition at =1.05926. The for the three absorption systems at = 1.04504, 1.05926 and 1.06540 are Å, Å and Å, respectively. The corresponding for the three systems are Å, Å and Å, respectively. The upper limit on REW of Mg i is Å for all three systems. The [O ii] emission line detected in the SDSS spectrum at =1.07009 gives a dust-uncorrected luminosity of erg s-1, and SFR of M⊙ yr-1 (following Kewley et al., 2004), if the emission is due to starburst in the host galaxy. The UV luminosity of this quasar, based on the GALEX NUV photometry, is W Hz-1. This quasar is also identified as a candidate -ray blazar of mixed class based on its WISE mid-infrared colours (D’Abrusco et al., 2014).
Performing SED fitting of the quasar SDSS spectrum, we find that both SMC Bar and SMC Wing extinction laws give best fit to the quasar, with and , respectively. However, the fit obtained from SMC Bar extinction law is more consistent with the GALEX UV photometry (see Fig. 2). Hence, we adopt this fit for the discussion here. Based on SED fitting to a control sample of SDSS quasars (similar to Section 3.3), the reddening of this quasar is significant at level. The (H i) derived from the SED fitting is cm-2. Note that the reddening is assumed to be due to dust present in the quasar host galaxy. Some of the reddening could also be due to dust associated with the blueshifted Mg ii absorption systems, in which case the above estimated and (H i) values would be upper limits. SED fits that assume reddening due to dust in the quasar host galaxy or in the Mg ii systems have similar values. Note that there are no intervening Mg ii systems detected over 0.41.0 in the SDSS spectrum.
Initially we observed this quasar with a bandwidth of 16 MHz and a resolution of km s-1, which covered the H i 21-cm line at the redshift of the three Mg ii systems and at the systemic redshift of the quasar. We did not detect any absorption at 1.05926 and 1.06540, and the frequency ranges around 1.04504 were affected by poor bandpass stability and RFI. From this spectrum, we put a upper limit on (H i) (Ts/100 K) (1/) cm-2 per 100 km s-1 near = 1.05926 and 1.06540. In addition, we detected a tentative absorption at the quasar systemic redshift of 1.07009.
We carried out follow-up observation of this system, with a 2 MHz band centred at the tentative detection and a resolution of 2 km s-1. The resultant spectrum confirmed the detection, with the peak optical depth detected at and the integrated optical depth at . We show the absorption spectrum rebinned to 10 km s-1 resolution in panel (d) of Fig. 1. The H i absorption coincides with the systemic redshift of the quasar and is redshifted by 3628 km s-1, 1568 km s-1 and 679 km s-1 from the three Mg ii absorption systems. Note that we do not detect any strong Mg ii absorption ( Å) at the redshift of the H i absorption. The total optical depth of the absorption translates to (H i) (Ts/100 K) (1/) cm-2. We fitted a single component Gaussian to the absorption profile with a FWHM of 60 km s-1. The velocity width which contains 90% of the optical depth is 75 km s-1.
Combining the observed optical depth and the (H i) derived from SED fitting, gives us ( Ts) K. Based on the 4.85 GHz flux of 45 mJy (Gregory & Condon, 1991) and the observed flux in our uGMRT data, we estimate a spectral index of for the radio source. Since no sub-arcsecond-scale image exists for this radio source, cannot be constrained. The dust-to-gas ratio in this system could be higher than that observed in the SMC, i.e. could be greater than unity, as is possible in high- absorbers due to different grain chemistry or size (see Shaw et al., 2016; Noterdaeme et al., 2017; Dutta et al., 2017b; Rawlins et al., 2018). This is similar to what is inferred from the lack of H i 21-cm absorption towards the red quasar J09564046 (see Section 2.1.1 and Gupta et al., 2012). The above estimate on ( Ts) can thus be taken as an upper limit on Ts.
4 Discussion
We have started searching for H i 21-cm and OH 18-cm absorption lines at towards red quasars in the newly available frequency ranges offered by the uGMRT. We have presented here the results for our search for OH 18-cm absorption from two intervening strong Mg ii systems at and H i 21-cm absorption from two associated strong Mg ii systems at , all towards quasars showing reddening in their optical spectra [ 0.1-0.4].
4.1 OH 18-cm absorption towards red quasars
The quasars J08505159 and J08523435, although weak in their radio emission (60 mJy at 1.4 GHz), were promising candidates for follow-up OH 18-cm absorption observations because of the presence of strong metal absorption ( 3Å), 2175 Å extinction bump, and strong dust reddening [ 0.3-0.4]. The (H i) values [(5-7) cm-2] derived from SED fitting of the SDSS spectra are also high (Srianand et al., 2008), though there is no evidence for strong dependence of the OH detection rate on (H i) among the known Galactic and extragalactic OH absorbers (Gupta et al., 2018). The upper limits achieved on (OH) [(1-2) cm-2] should be sensitive to detect the higher end of the (OH) detected in our Galaxy (Li et al., 2018; Rugel et al., 2018). The constraints on the [OH][H i] abundance ratio [(1-4)] are lower than the median [OH][H i] observed in our Galaxy (Li et al., 2018; Rugel et al., 2018). This could indicate towards an evolution in the physical conditions and abundance of molecular gas at . However, we note that the scatter in the Galactic measurements is large, and that dust-to-gas ratios greater than that in the LMC would push the above derived limits higher. In both these systems, we can most likely rule out the presence of dense molecular gas. The presence of dust in these systems means that we cannot rule out the presence of molecular gas completely along these sightlines. We are hence probably still not reaching the sensitivity required to detect the diffuse molecular gas, i.e. with (OH) cm-2. The upcoming MeerKAT Absorption Line Survey (MALS; Gupta et al., 2016) will specifically target bright high- quasars to reach OH column density sensitivities below this ( cm-2) over (Gupta et al., 2018).
4.2 H i 21-cm absorption towards red quasars
We have detected H i 21-cm absorption at the systemic redshift of the quasar J15215508, with (H i) (Ts/100 K) (1/) cm-2. However, we do not detect H i absorption from the blueshifted strong Mg ii absorption systems along this line-of-sight [(H i) (Ts/100 K) (1/) cm-2]. We also do not detect H i absorption from the strong Mg ii systems associated with the quasar J15011822 [(H i) (Ts/100 K) (1/) cm-2]. The reasons for non-detection of associated H i 21-cm absorption in general are the absence of neutral gas due to ionization by high luminosity-AGN, higher spin temperature in the vicinity of AGN, and extended background radio structure and small-scale structure in the absorbing gas itself leading to small covering factor. The two quasars discussed here show the presence of strong Mg ii absorption and dust reddening, which indicate the presence of neutral gas in the vicinity of the quasars. The (H i) estimates inferred from SED fitting, assuming that the reddening is due to dust associated with the quasars, are (5-9) cm-2. If part of the reddening is caused due to dust present in the blueshifted Mg ii absorption systems, the (H i) estimates would be upper limits. Additionally, based on the and , the probability of (H i) being greater than and cm-2, is 92% and 51%, respectively (see Dutta et al., 2017b, for details). Further, the UV luminosity of these quasars is below the critical luminosity believed to ionize neutral gas completely (Curran et al., 2008; Curran & Whiting, 2012). Hence, we can rule out the absence of neutral gas as the reason behind the lack of H i 21-cm absorption.
The relatively flat radio spectrum of these two quasars implies compact structure, though in absence of sub-arcsecond-scale images, the background radio structure and exact gas covering factor are uncertain. We are probing absorption over scales of kpc at the redshift of the quasars222Adopting a flat -cold dark matter cosmology with = 70 km s-1 Mpc-1 and = 0.30.. It is likely that the neutral gas is present in small clumps along these sightlines, and we are not detecting H i 21-cm absorption from all the clumps due to difference in the optical and radio sightlines. This would explain the detection of H i 21-cm absorption at the systemic redshift of the quasar J15215508 and non-detection at the redshift of the blueshifted Mg ii absorption. Indeed, the absence of strong Mg ii absorption at the redshift of the H i 21-cm absorption implies that the radio sightline is probing a different volume of gas than the optical sightline. Differences in H i 21-cm and metal absorption profiles, with the H i 21-cm absorption not always coinciding with the strongest metal component, have been observed even in intervening systems with high resolution optical spectra available (e.g. Gupta et al., 2009; Rahmani et al., 2012; Dutta et al., 2015). While no strong correlation has been found between line width of intervening H i 21-cm absorption and linear size of radio sources from subarcsecond-scale images, the largest velocity widths are seen towards radio sources with extended structure at arcsecond-scales (Gupta et al., 2012). This can be explained if the absorbing gas is patchy, which is consistent with the above scenario that gives rise to differences in H i and metal absorption.
Next, we discuss the detection rate of H i 21-cm absorption in red quasars and in particular the detection rate of associated absorption at 1. As outlined in Section 2.1.2, the two quasars, J15011822 and J15215508, were selected on the basis of their SDSS red colours and strong Mg ii absorption. This selection procedure resulted in a total sample of eight red quasars (with associated and intervening absorbers), out of which six had been previously observed, with two detections. Hence, including the two quasars presented here, the detection rate of H i 21-cm absorption in this sample of red quasars is 38%333Poissonian errors computed using tables of Gehrels (1986)..
Considering only associated absorption, two out of three red quasars show H i 21-cm absorption towards J15215508 reported here, and towards 3C 190 (=1.2) (Ishwara-Chandra et al., 2003). It is interesting to note that, similar to the velocity offset in H i and Mg ii absorption towards J15215508, the peak H i optical depth in case of the absorption towards 3C 190 also does not coincide in velocity with the peak of the Mg ii absorption. Even though the uncertainties are large due to the small number of red quasars searched to date at 1, the detection rate of associated H i 21-cm absorption in red quasars is higher than the typical detection rate (10%) in samples of 1 AGNs selected without any condition on reddening or the presence of metal absorption. For example, from the compilation presented in Aditya & Kanekar (2018a) and Aditya & Kanekar (2018b), associated H i 21-cm absorption has been detected in 4 out of 56 flat-spectrum and gigahertz-peaked-spectrum radio sources at 1. SDSS spectrum is available for one of the four sources with detection (TXS 1200045) and we do not detect any strong associated Mg ii absorption ( 1 Å) within 3000 km s-1 of the systemic redshift of the quasar. The optical spectra available for two other sources (TXS 1245197 and TXS 1954513) in the literature (di Serego Alighieri et al., 1994; Lawrence et al., 1996) do not show signature of associated Mg ii absorption. However, these are very low-resolution (10 Å) spectra from which we cannot place any strong constraints. Note that 60% of the H i absorption spectra reported in Aditya & Kanekar (2018a) and Aditya & Kanekar (2018b) are not sensitive enough to detect the absorption towards J15215508 reported here. For 17 of the sources with H i 21-cm non-detection, SDSS spectra are available, and we do not detect Mg ii absorption ( 1 Å) within 3000 km s-1 of the systemic redshift. Similarly, for the H i 21-cm non-detections in compact radio sources reported in the recent study of Grasha et al. (2019), no associated Mg ii absorption is detected in the available SDSS spectra. Hence, the lack of H i 21-cm absorption in these cases is consistent with the absence of metal-rich neutral gas in the vicinity of the AGNs.
Next, we consider all quasars with associated Mg ii absorption at in SDSS spectra that have been searched for H i 21-cm absorption. In addition to the three systems in our red quasar sample, there are five quasars that do not fulfill the optical colour or radio flux criteria of our sample (Section 2.1.2), but show Mg ii absorption at 3000 km s-1 of the systemic redshift. Three out of these five have been detected in H i 21-cm absorption J010826.84003724.1 (=1.375; Gupta et al., 2009), J114521.32045526.7 (=1.345; Kanekar et al., 2009), J091927.61014603.0 (=1.286; Dutta et al., 2017b). The peak H i optical depth of the absorption is again offset (up to 100 km s-1) from the peak Mg ii absorption in these systems. Two of these quasars have VLBA images available, which show structures in the radio emission at subarcsecond-scales, with 0.3-0.5 (Gupta et al., 2012). This supports our above argument that the neutral gas near these AGNs have structures at small scales that give rise to different absorbing components in the optical and radio sightlines. The total detection rate of associated H i 21-cm absorption in the above Mg ii-selected systems is 62% (57% considering only 1 Å systems). Thus, the presence of strong associated Mg ii absorption increases the detection rate of associated H i 21-cm absorption in 1 quasars. Due to small number statistics, we are not able to determine yet whether the presence of reddening signature further enhances the detection rate.
Similar to what has been found for intervening Mg ii absorbers (Gupta et al., 2012; Dutta
et al., 2017b), we do not find any correlation of the H i 21-cm optical
depth and velocity width with of the associated Mg ii absorption at , albeit the number of such absorbers is small (5). However, considering
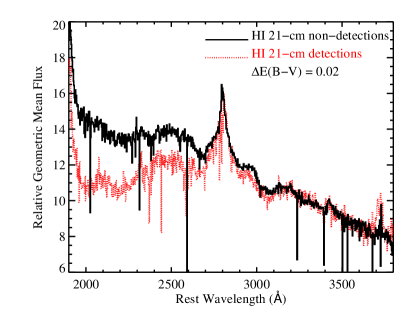
the effect of reddening alone, we find that the distributions of the colour excess, , of the quasars with and without associated H i 21-cm absorption at 1 are different. A two-sided Kolmogorov-Smirnov test gives maximum deviation between the two cumulative distributions as
= 0.54, with the probability of finding this difference by chance being = 0.03. The effect of reddening due to dust can be seen more clearly
from the geometric mean stacked SDSS spectra, at the rest-frame of the quasar, of the associated H i 21-cm absorbers (6) and non-absorbers (26) at
1444For this analysis we consider all the quasars searched for associated H i 21-cm absorption at 1 that have SDSS spectra available.
(Fig. 4). The quasars which show associated H i 21-cm absorption tend to be more reddened on average, with the stacked spectrum of quasars
showing associated H i 21-cm absorption having a differential reddening of = 0.02 with respect to the stacked spectrum of quasars not detected
in associated H i 21-cm absorption. Therefore, there are indications of both strong Mg ii absorption and optical reddening leading to higher occurrence of
associated H i 21-cm absorption in 1 quasars. Further searches towards reddened quasars along with characterization of the parsec-scale radio structure
through VBLA imaging are the way forward towards understanding the incidence, distribution and physical conditions of neutral gas in high- quasars.
ACKNOWLEDGEMENTS
We thank the anonymous reviewer for their helpful comments and suggestions.
RD acknowledges support from the Alexander von Humboldt Foundation.
We thank the staff at GMRT for their help during the observations.
GMRT is run by the National Centre for Radio Astrophysics of the Tata Institute of Fundamental Research.
Funding for SDSS-III has been provided by the Alfred P. Sloan Foundation, the Participating Institutions, the National Science Foundation,
and the U.S. Department of Energy Office of Science. The SDSS-III web site is http://www.sdss3.org/.
SDSS-III is managed by the Astrophysical Research Consortium for the Participating Institutions of the SDSS-III Collaboration
including the University of Arizona, the Brazilian Participation Group, Brookhaven National Laboratory, Carnegie Mellon University,
University of Florida, the French Participation Group, the German Participation Group, Harvard University, the Instituto de Astrofisica
de Canarias, the Michigan State/Notre Dame/JINA Participation Group, Johns Hopkins University, Lawrence Berkeley National Laboratory,
Max Planck Institute for Astrophysics, Max Planck Institute for Extraterrestrial Physics, New Mexico State University, New York University,
Ohio State University, Pennsylvania State University, University of Portsmouth, Princeton University, the Spanish Participation Group,
University of Tokyo, University of Utah, Vanderbilt University, University of Virginia, University of Washington, and Yale University.
References
- Aditya & Kanekar (2018a) Aditya J. N. H. S., Kanekar N., 2018a, MNRAS, 473, 59
- Aditya & Kanekar (2018b) Aditya J. N. H. S., Kanekar N., 2018b, MNRAS, 481, 1578
- Aditya et al. (2016) Aditya J. N. H. S., Kanekar N., Kurapati S., 2016, MNRAS, 455, 4000
- Alam et al. (2015) Alam S., et al., 2015, ApJS, 219, 12
- Allison et al. (2014) Allison J. R., Sadler E. M., Meekin A. M., 2014, MNRAS, 440, 696
- Booth & Jonas (2012) Booth R. S., Jonas J. L., 2012, African Skies, 16, 101
- Briggs & Wolfe (1983) Briggs F. H., Wolfe A. M., 1983, ApJ, 268, 76
- Budzynski & Hewett (2011) Budzynski J. M., Hewett P. C., 2011, MNRAS, 416, 1871
- Carilli et al. (1998) Carilli C. L., Menten K. M., Reid M. J., Rupen M. P., Yun M. S., 1998, ApJ, 494, 175
- Chandola & Saikia (2017) Chandola Y., Saikia D. J., 2017, MNRAS, 465, 997
- Chandola et al. (2011) Chandola Y., Sirothia S. K., Saikia D. J., 2011, MNRAS, 418, 1787
- Chengalur & Kanekar (2003) Chengalur J. N., Kanekar N., 2003, Physical Review Letters, 91, 241302
- Chengalur et al. (1999) Chengalur J. N., de Bruyn A. G., Narasimha D., 1999, A&A, 343, L79
- Curran (2010) Curran S. J., 2010, MNRAS, 402, 2657
- Curran & Whiting (2012) Curran S. J., Whiting M. T., 2012, ApJ, 759, 117
- Curran et al. (2006) Curran S. J., Whiting M. T., Murphy M. T., Webb J. K., Longmore S. N., Pihlström Y. M., Athreya R., Blake C., 2006, MNRAS, 371, 431
- Curran et al. (2008) Curran S. J., Whiting M. T., Wiklind T., Webb J. K., Murphy M. T., Purcell C. R., 2008, MNRAS, 391, 765
- Curran et al. (2013) Curran S. J., Whiting M. T., Sadler E. M., Bignell C., 2013, MNRAS, 428, 2053
- D’Abrusco et al. (2014) D’Abrusco R., Massaro F., Paggi A., Smith H. A., Masetti N., Landoni M., Tosti G., 2014, The Astrophysical Journal Supplement Series, 215, 14
- Draine (2003) Draine B. T., 2003, ARA&A, 41, 241
- Dutta et al. (2015) Dutta R., Srianand R., Muzahid S., Gupta N., Momjian E., Charlton J., 2015, MNRAS, 448, 3718
- Dutta et al. (2016) Dutta R., Gupta N., Srianand R., O’Meara J. M., 2016, MNRAS, 456, 4209
- Dutta et al. (2017a) Dutta R., Srianand R., Gupta N., Momjian E., Noterdaeme P., Petitjean P., Rahmani H., 2017a, MNRAS, 465, 588
- Dutta et al. (2017b) Dutta R., Srianand R., Gupta N., Joshi R., Petitjean P., Noterdaeme P., Ge J., Krogager J.-K., 2017b, MNRAS, 465, 4249
- Dutta et al. (2017c) Dutta R., Srianand R., Gupta N., Joshi R., 2017c, MNRAS, 468, 1029
- Dutta et al. (2018) Dutta R., Srianand R., Gupta N., 2018, MNRAS, 480, 947
- Dutta et al. (2019) Dutta R., Srianand R., Gupta N., 2019, MNRAS, 489, 1099
- Gehrels (1986) Gehrels N., 1986, ApJ, 303, 336
- Geréb et al. (2015) Geréb K., Maccagni F. M., Morganti R., Oosterloo T. A., 2015, A&A, 575, A44
- Glikman et al. (2018) Glikman E., et al., 2018, ApJ, 861, 37
- Glowacki et al. (2019) Glowacki M., et al., 2019, MNRAS, p. 2114
- Gordon et al. (2003) Gordon K. D., Clayton G. C., Misselt K. A., Landolt A. U., Wolff M. J., 2003, ApJ
- Grasha et al. (2019) Grasha K., Darling J., Bolatto A., Leroy A. K., Stocke J. T., 2019, arXiv e-prints, p. arXiv:1909.12422
- Gregg et al. (2002) Gregg M. D., Lacy M., White R. L., Glikman E., Helfand D., Becker R. H., Brotherton M. S., 2002, ApJ, 564, 133
- Gregory & Condon (1991) Gregory P. C., Condon J. J., 1991, The Astrophysical Journal Supplement Series, 75, 1011
- Gupta (2014) Gupta Y., 2014, in Astronomical Society of India Conference Series. pp 441–447
- Gupta et al. (2006) Gupta N., Salter C. J., Saikia D. J., Ghosh T., Jeyakumar S., 2006, MNRAS, 373, 972
- Gupta et al. (2009) Gupta N., Srianand R., Petitjean P., Noterdaeme P., Saikia D. J., 2009, MNRAS, 398, 201
- Gupta et al. (2012) Gupta N., Srianand R., Petitjean P., Bergeron J., Noterdaeme P., Muzahid S., 2012, A&A, 544, A21
- Gupta et al. (2016) Gupta N., et al., 2016, in Proceedings of MeerKAT Science: On the Pathway to the SKA. 25-27 May. p. 14 (arXiv:1708.07371)
- Gupta et al. (2018) Gupta N., Momjian E., Srianand R., Petitjean P., Noterdaeme P., Gyanchandani D., Sharma R., Kulkarni S., 2018, ApJ, 860, L22
- Healey et al. (2007) Healey S. E., Romani R. W., Taylor G. B., Sadler E. M., Ricci R., Murphy T., Ulvestad J. S., Winn J. N., 2007, The Astrophysical Journal Supplement Series, 171, 61
- Hopkins et al. (2008) Hopkins P. F., Hernquist L., Cox T. J., Kereš D., 2008, ApJS, 175, 356
- Ishwara-Chandra et al. (2003) Ishwara-Chandra C. H., Dwarakanath K. S., Anantharamaiah K. R., 2003, Journal of Astrophysics and Astronomy, 24, 37
- Jiang et al. (2011) Jiang P., Ge J., Zhou H., Wang J., Wang T., 2011, ApJ, 732, 110
- Kanekar & Chengalur (2002) Kanekar N., Chengalur J. N., 2002, A&A, 381, L73
- Kanekar et al. (2005) Kanekar N., et al., 2005, Physical Review Letters, 95, 261301
- Kanekar et al. (2009) Kanekar N., Prochaska J. X., Ellison S. L., Chengalur J. N., 2009, MNRAS, 396, 385
- Kanekar et al. (2014) Kanekar N., et al., 2014, MNRAS, 438, 2131
- Kewley et al. (2004) Kewley L. J., Geller M. J., Jansen R. A., 2004, AJ, 127, 2002
- Khare et al. (2014) Khare P., Berk Daniel V., Rahmani H., York D. G., 2014, ApJ, 794, 66
- Kulkarni et al. (2011) Kulkarni V. P., Torres-Garcia L. M., Som D., York D. G., Welty D. E., Vladilo G., 2011, ApJ, 726, 14
- Lane (2000) Lane W. M., 2000, PhD thesis, University of Groningen
- Lawrence et al. (1996) Lawrence C. R., Zucker J. R., Readhead A. C. S., Unwin S. C., Pearson T. J., Xu W., 1996, ApJS, 107, 541
- Li et al. (2018) Li D., et al., 2018, ApJS, 235, 1
- Liszt & Lucas (1996) Liszt H., Lucas R., 1996, A&A, 314, 917
- Liszt & Lucas (1999) Liszt H., Lucas R., 1999, in Carilli C. L., Radford S. J. E., Menten K. M., Langston G. I., eds, Astronomical Society of the Pacific Conference Series Vol. 156, Highly Redshifted Radio Lines. p. 188
- Maccagni et al. (2017) Maccagni F. M., Morganti R., Oosterloo T. A., Geréb K., Maddox N., 2017, A&A, 604, A43
- Noterdaeme et al. (2017) Noterdaeme P., et al., 2017, A&A, 597, A82
- Rahmani et al. (2012) Rahmani H., Srianand R., Gupta N., Petitjean P., Noterdaeme P., Vásquez D. A., 2012, MNRAS, 425, 556
- Rawlins et al. (2018) Rawlins K., Srianand R., Shaw G., Rahmani H., Dutta R., Chacko S., 2018, MNRAS, 481, 2083
- Ross et al. (2015) Ross N. P., et al., 2015, MNRAS, 453, 3932
- Rugel et al. (2018) Rugel M. R., et al., 2018, A&A, 618, A159
- Sanders & Mirabel (1996) Sanders D. B., Mirabel I. F., 1996, ARA&A, 34, 749
- Schinckel et al. (2012) Schinckel A. E., Bunton J. D., Cornwell T. J., Feain I., Hay S. G., 2012, in Proc. SPIE. p. 84442A, doi:10.1117/12.926959
- Selsing et al. (2016) Selsing J., Fynbo J. P. U., Christensen L., Krogager J.-K., 2016, A&A, 585, A87
- Shaw et al. (2016) Shaw G., Rawlins K., Srianand R., 2016, MNRAS, 459, 3234
- Shen & Ménard (2012) Shen Y., Ménard B., 2012, ApJ, 748, 131
- Srianand & Kembhavi (1997) Srianand R., Kembhavi A., 1997, ApJ, 478, 70
- Srianand et al. (2008) Srianand R., Gupta N., Petitjean P., Noterdaeme P., Saikia D. J., 2008, MNRAS, 391, L69
- Srianand et al. (2012) Srianand R., Gupta N., Petitjean P., Noterdaeme P., Ledoux C., Salter C. J., Saikia D. J., 2012, MNRAS, 421, 651
- Stanimirović et al. (2003) Stanimirović S., Weisberg J. M., Dickey J. M., de la Fuente A., Devine K., Hedden A., Anderson S. B., 2003, ApJ, 592, 953
- Telfer et al. (2002) Telfer R. C., Zheng W., Kriss G. A., Davidsen A. F., 2002, ApJ, 565, 773
- Uzan (2003) Uzan J.-P., 2003, Reviews of Modern Physics, 75, 403
- Vanden Berk et al. (2001) Vanden Berk D. E., et al., 2001, AJ, 122, 549
- Wang et al. (2004) Wang J., Hall P. B., Ge J., Li A., Schneider D. P., 2004, ApJ, 609, 589
- White et al. (1997) White R. L., Becker R. H., Helfand D. J., Gregg M. D., 1997, ApJ, 475, 479
- Whiting et al. (2001) Whiting M. T., Webster R. L., Francis P. J., 2001, MNRAS, 323, 718
- Wright et al. (2010) Wright E. L., et al., 2010, AJ, 140, 1868
- Yan et al. (2016) Yan T., Stocke J. T., Darling J., Momjian E., Sharma S., Kanekar N., 2016, AJ, 151, 74
- York et al. (2000) York D. G., et al., 2000, AJ, 120, 1579
- Zhu & Ménard (2013) Zhu G., Ménard B., 2013, ApJ, 770, 130
- di Serego Alighieri et al. (1994) di Serego Alighieri S., Danziger I. J., Morganti R., Tadhunter C. N., 1994, MNRAS, 269, 998
- van Gorkom et al. (1989) van Gorkom J. H., Knapp G. R., Ekers R. D., Ekers D. D., Laing R. A., Polk K. S., 1989, AJ, 97, 708