Cascading parallel fractures on Enceladus
1Department of Terrestrial Magnetism, Carnegie Institution for Science, Washington, DC, 20015, 2Department of Earth & Planetary Science, University of California Berkeley, Berkeley, CA, 94720, 3Department of Earth & Planetary Sciences, University of California Davis, Davis, CA, 95616. *Corresponding author: dhemingway@carnegiescience.edu.
Main Text
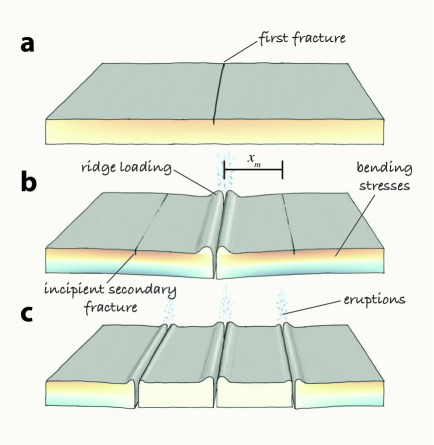
Active eruptions from the south polar region of Saturn’s small ( diameter) moon Enceladus are concentrated along a series of lineaments known as the ‘tiger stripes’ 1, 2, thought to be partially open fissures that connect to the liquid water ocean beneath the ice shell 3, 4. Whereas aspects of the tiger stripes have been addressed in previous work, no study to date simultaneously explains why they should be located only at the south pole, why there are multiple approximately parallel and regularly spaced fractures, and what accounts for their spacing of . Here we propose that secular cooling and the resulting ice shell thickening and global tensile stresses 5, 6 cause the first fracture to form at one of the poles, where the ice shell is thinnest due to tidal heating 7. The tensile stresses are thereby partially relieved, preventing a similar failure at the opposite pole. We propose that subsequent activity then concentrates in the vicinity of the first fracture as the steadily erupted water ice loads the flanks of the open fissure, causing bending in the surrounding elastic plate and further tensile failure in bands parallel to the first fracture, leading to a cascading sequence of parallel fissures until the conditions no longer permit through-going fractures.
The large amplitude of Enceladus’ forced physical librations 8 demonstrates that a global liquid water ocean is present beneath the outer ice shell, consistent with the floating ice shell model proposed to explain the muted gravitational field asymmetries 9 in spite of the large topography 10, 11, 12. Interior models suggest a south polar shell thickness in the vicinity of , whereas the north polar shell thickness is likely closer to 7. Given that the erupted ice grains appear to be sampling this internal ocean 13, 14, the tiger stripes may be taken as open fissures that fully penetrate the ice shell, providing a direct conduit to the subsurface ocean. Accordingly, most studies presume an extensional origin, although some features have been interpreted as evidence of compressional or strike-slip activity 15, 16. What is least clear is how these fractures formed initially, why only at the south pole, why as a subparallel set with regular spacing, and why similarly active fissures have not yet been observed on other icy bodies.
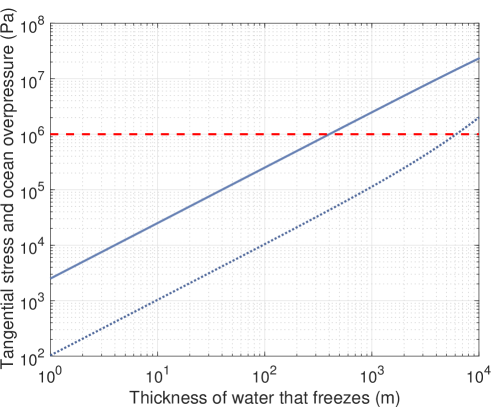
Secular cooling will result in some net freezing of the internal ocean. As long as the overlying ice shell is sufficiently intact to support tensile stresses on a global scale, the volume increase associated with the phase change from water to ice will result in ocean pressurization (5; Methods). As freezing progresses, tangential stresses build until the tensile failure limit is exceeded somewhere in the ice shell (Figure 1; Figure S1). Since tidal heating should cause the ice shell to be thinnest at the poles 17, 7, tensile stresses are maximized at the poles such that the initial failure should occur at one of the poles, with either pole being equally likely. Whereas the cold upper part of the ice shell behaves elastically, the warmer ice toward the base of the shell behaves viscously on long timescales (Methods). Provided the ductile region of the ice shell is not too thick, however, the fracture can rapidly penetrate the entire ice shell, establishing an open pathway directly to the underlying ocean (6; Figure S2). Crucially, once the first fissure forms, and provided that it remains open, the ice shell is no longer capable of supporting global scale tangential stresses and maintaining an over-pressurized ocean in this way. That is, it is no longer possible for a similar fracture to develop at the opposite pole, or anywhere else. We therefore suggest that Baghdad Sulcus, which cuts directly through the geographic south pole, was the first fracture to form and that the remaining fractures formed through a distinct, though related, process (see below). Baghdad’s orientation of from the tidal axis approximately maximizes normal tensile stresses arising due to diurnal tidal deformation 18, 19. Although these tidal stresses are relatively weaker (), when combined with the isotropic background tensile stress field resulting from secular cooling, the total could be sufficient to cause tensile failure. This may explain the orientation of the tiger stripes, provided the ice shell has not experienced non-synchronous rotation since their formation.
Once the first open fissure has formed, liquid water rises to the level of neutral buoyancy (i.e., the lower becomes filled with water) and begins to boil off at the top, where it is exposed to the vacuum. The rate of boiling may be controlled by back pressure resulting from interaction between the vapour and the conduit walls 20 and turbulent dissipation associated with tidally driven cyclic flushing and refilling of the liquid filled fissure can prevent it from freezing shut 4. Provided these (or similar) mechanisms can maintain the stability of such ocean-to-surface pathways, the eruptions may persist for extended periods. Some 91% of the erupted solids fall ballistically back to the surface of Enceladus 21, accumulating preferentially on the flanks of the open fissures 22. This effect may explain the origin of the large ridges observed along the tiger stripes (Figure 1; 23, 24).
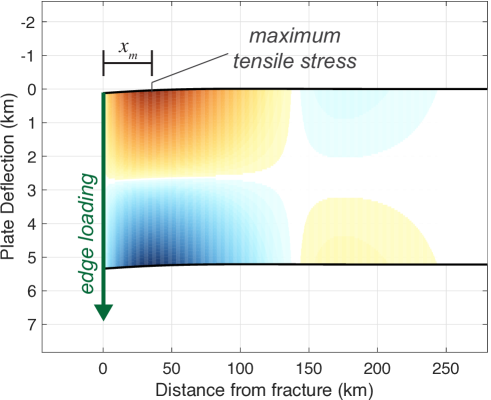
If the cold upper part of the ice shell behaves elastically, both the material accumulated on the flanks of the open fissure and the loss of buoyancy associated with any localised ice shell thinning act like downward forces applied close to the edge of the broken elastic plate. Such forces cause bending stresses to develop in the surrounding ice shell (e.g., 25, 26, 23; Figure S3). Given a load acting at the edge of the broken plate, it can be shown that the maximum bending stresses occur at a distance from the first fracture given by
| (1) |
where is the characteristic length scale for elastic flexure, given by
| (2) |
where and are the Young’s modulus and Poisson’s ratio for the icy shell, is the acceleration due to gravity, is the density of the ocean, and is the effective elastic layer thickness. If the typical tiger stripe spacing of is governed by the position where maximum bending stresses occur, then, assuming typical values of , , and , and with , we obtain an elastic thickness of (Figure S4). Given the expected temperature structure of the ice shell, such an elastic thickness corresponds to a total local shell thickness of (Methods), consistent with the value inferred from gravity, topography, and librations 7. Approximating the load as a line load, , acting at the edge of the broken elastic plate, it can be shown (Methods) that the resulting bending causes maximum tensile stresses at to reach
| (3) |
Bending stresses can thus initiate secondary fractures in bands parallel to the first fracture once the load acting at the edge of the plate is sufficient to cause to exceed the tensile failure limit for ice, . Although localised ice shell thinning could, in principle, contribute to the bending of the plate, the process may be self limiting because the locally melting ice is opposed by viscous closure and the freezing that results from reduced local turbulent dissipation, making this effect too small to produce the necessary loading (Methods; Figure S5; 4). A more effective source of edge loading may be the accumulation of erupted material onto the ridges flanking the open fissure. The eruption rate and the fraction of erupted material falling back onto the ridges determines the time required before the bending stresses cause tensile failure and the initiation of a secondary fracture (Figure S6). If, for example, the eruption rate of the solids from a single fissure is and if 91% of this material goes into the formation of the flanking ridges, then, taking the fissure length to be , the loading on each ridge reaches the critical value after million years assuming , or if the ice fails at (Methods).
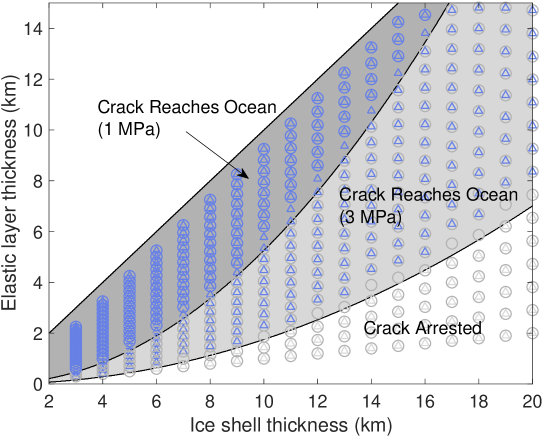
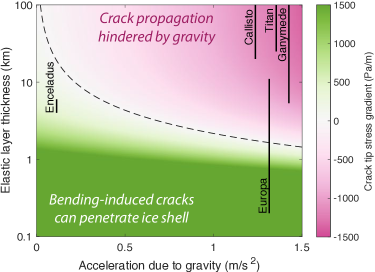
As the secondary fracture begins to propagate, the broken portion of the elastic plate can no longer contribute to supporting the bending moment and the effective elastic thickness is reduced. Assuming the load, , is not changing on the timescale of fracture propagation, the stress profile in the elastic plate becomes increasingly steep, with the crack tip stress being always tensile and increasing steadily as the fracture propagates. This effect is countered by the compressive stresses from overburden pressure, which increase with depth (Figure S7). For Enceladus, however, the gravity is so weak that such compressive stresses are not important and the crack tip stresses are always increasing as the crack propagates, meaning that the crack should penetrate rapidly through the entire elastic layer. For larger icy ocean worlds, the gravity is generally too strong to allow the crack tip stress to build in this way, potentially explaining why similarly active fissures are not observed on other bodies (Figure 2; Figure S7; Methods). Although roughly the lower 40% of the ice shell is ductile on long timescales (Methods), it may behave elastically on the timescale of fracture propagation, such that the secondary fracture can penetrate all the way through to the ocean—though future work is required to model the full viscoelastic nature of this problem. Once a through-going fracture is established in this way, it evolves in a fashion similar to the first fracture, allowing the sequence to cascade outward from the original fracture in symmetric pairs (Figure 1): after Baghdad, Cairo and Damascus, then Alexandria and the feature informally named “E” by Yin & Pappalardo 27.
There are several ways in which the cascade may be arrested. If the eruption rate becomes too slow, bending stresses may not reach the critical value on a timescale for which the ice behaves elastically. If the eruption rate through each fissure decreases as new fissures are formed, those forming later may not be loaded quickly enough for the resulting bending stresses to generate additional fractures. Fractures forming farther from the pole, where the background ice shell thickness is greater, may also have a more difficult time propagating through the thicker ductile part of the ice shell.
Finally, although our model may be able to account for the initial formation of the tiger stripes, a number of other processes, such as tidal and gravitational stresses, may continue to rework the fissures forming strike-slip features 27, 16 or the funiscular plains 15, for example. Likewise, our results are not incompatible with stratigraphically older features 28 having formed through similar or distinct processes that may have operated prior to the formation of the currently active fissures.
References
- Porco et al. 2006 Porco, C. C. et al. Cassini observes the active south pole of Enceladus. Science (New York, N.Y.) 311, 1393–1401 (2006).
- Porco et al. 2014 Porco, C., DiNino, D. & Nimmo, F. How the Geysers, Tidal Stresses, and Thermal Emission Across the South Polar Terrain of Enceladus Are Related. The Astronomical Journal 148, 45 (2014).
- Ingersoll & Nakajima 2016 Ingersoll, A. P. & Nakajima, M. Controlled boiling on Enceladus. 2. Model of the liquid-filled cracks. Icarus 272, 319–326 (2016).
- Kite & Rubin 2016 Kite, E. S. & Rubin, A. M. Sustained eruptions on Enceladus explained by turbulent dissipation in tiger stripes. Proceedings of the National Academy of Sciences 113, 201520507 (2016).
- Manga & Wang 2007 Manga, M. & Wang, C. Y. Pressurized oceans and the eruption of liquid water on Europa and Enceladus. Geophysical Research Letters 34, 1–5 (2007).
- Rudolph & Manga 2009 Rudolph, M. L. & Manga, M. Fracture penetration in planetary ice shells. Icarus 199, 536–541 (2009).
- Hemingway & Mittal 2019 Hemingway, D. J. & Mittal, T. Enceladus’s ice shell structure as a window on internal heat production. Icarus 332, 111–131 (2019).
- Thomas et al. 2016 Thomas, P. et al. Enceladus’s measured physical libration requires a global subsurface ocean. Icarus 264, 37–47 (2016).
- Iess et al. 2014 Iess, L. et al. The Gravity Field and Interior Structure of Enceladus. Science (New York, N.Y.) 344, 78–80 (2014).
- Collins & Goodman 2007 Collins, G. C. & Goodman, J. C. Enceladus’ south polar sea. Icarus 189, 72–82 (2007).
- Nimmo et al. 2011 Nimmo, F., Bills, B. G. & Thomas, P. C. Geophysical implications of the long-wavelength topography of the Saturnian satellites. Journal of Geophysical Research 116, E11001 (2011).
- Tajeddine et al. 2017 Tajeddine, R. et al. True polar wander of Enceladus from topographic data. Icarus 295, 46–60 (2017).
- Postberg et al. 2009 Postberg, F. et al. Sodium salts in E-ring ice grains from an ocean below the surface of Enceladus. Nature 459, 1098–1101 (2009).
- Postberg et al. 2011 Postberg, F., Schmidt, J., Hillier, J., Kempf, S. & Srama, R. A salt-water reservoir as the source of a compositionally stratified plume on Enceladus. Nature 474, 620–622 (2011).
- Bland et al. 2015 Bland, M. T., McKinnon, W. B. & Schenk, P. M. Constraining the heat flux between Enceladus’ tiger stripes: Numerical modeling of funiscular plains formation. Icarus 260, 232–245 (2015).
- Yin et al. 2016 Yin, A., Zuza, A. V. & Pappalardo, R. T. Mechanics of evenly spaced strike-slip faults and its implications for the formation of tiger-stripe fractures on Saturn’s moon Enceladus. Icarus 266, 204–216 (2016).
- Choblet et al. 2017 Choblet, G. et al. Powering prolonged hydrothermal activity inside Enceladus. Nature Astronomy (2017).
- Nimmo et al. 2014 Nimmo, F., Porco, C. & Mitchell, C. Tidally Modulated Eruptions on Enceladus: Cassini ISS Observations and Models. The Astronomical Journal 148, 46 (2014).
- Nimmo et al. 2007 Nimmo, F., Spencer, J. R., Pappalardo, R. T. & Mullen, M. E. Shear heating as the origin of the plumes and heat flux on Enceladus. Nature 447, 289–91 (2007).
- Nakajima & Ingersoll 2016 Nakajima, M. & Ingersoll, A. P. Controlled boiling on Enceladus. 1. Model of the vapor-driven jets. Icarus 272, 309–318 (2016).
- Ingersoll & Ewald 2011 Ingersoll, A. P. & Ewald, S. P. Total particulate mass in Enceladus plumes and mass of Saturn’s E ring inferred from Cassini ISS images. Icarus 216, 492–506 (2011).
- Degruyter & Manga 2011 Degruyter, W. & Manga, M. Cryoclastic origin of particles on the surface of Enceladus. Geophysical Research Letters 38 (2011).
- Dombard et al. 2013 Dombard, A. J., Patterson, G. W., Lederer, A. P. & Prockter, L. M. Flanking fractures and the formation of double ridges on Europa. Icarus 223, 74–81 (2013).
- Crow-Willard & Pappalardo 2015 Crow-Willard, E. N. & Pappalardo, R. T. Structural mapping of Enceladus and implications for formation of tectonized regions. Journal of Geophysical Research: Planets 120, 928–950 (2015).
- Turcotte & Schubert 1982 Turcotte, D. L. & Schubert, G. Geodynamics (Cambridge University Press, 1982).
- Billings & Kattenhorn 2005 Billings, S. E. & Kattenhorn, S. A. The great thickness debate: Ice shell thickness models for Europa and comparisons with estimates based on flexure at ridges. Icarus 177, 397–412 (2005).
- Yin & Pappalardo 2015 Yin, A. & Pappalardo, R. T. Gravitational spreading, bookshelf faulting, and tectonic evolution of the South Polar Terrain of Saturn’s moon Enceladus. Icarus 260, 409–439 (2015).
- Patthoff & Kattenhorn 2011 Patthoff, D. A. & Kattenhorn, S. A. A fracture history on Enceladus provides evidence for a global ocean. Geophysical Research Letters 38, 1–6 (2011).
- Spohn & Schubert 2003 Spohn, T. & Schubert, G. Oceans in the icy Galilean satellites of Jupiter? Icarus 161, 456–467 (2003).
- Hemingway et al. 2013 Hemingway, D. J., Nimmo, F., Zebker, H. & Iess, L. A rigid and weathered ice shell on Titan. Nature 500, 550–552 (2013).
- Vance et al. 2014 Vance, S., Bouffard, M., Choukroun, M. & Sotin, C. Ganymede’s internal structure including thermodynamics of magnesium sulfate oceans in contact with ice. Planetary and Space Science 96, 62–70 (2014).
Data availability
All required data are available in the published literature as indicated.
Code availability
The computer code required to carry out the calculations discussed herein is available upon request from the corresponding author.
Acknowledgements
This work was made possible by the NASA/ESA Cassini mission to Saturn and, in particular, the work of the Imaging Science Subsystem team. We thank Robert Citron, Jacob Jordan, Simon Kattenhorn, Edwin Kite, and Tushar Mittal for helpful discussions, and the CIDER working group for early discussions that contributed to parts of this work. D.J.H. was funded in part by the Miller Institute for Basic Research in Science at the University of California Berkeley and in part by the Carnegie Institution for Science in Washington, DC.
Author contributions
M.M. developed the analytical equations for the secular cooling-induced tangential stresses in the ice shell. M.R. developed the analytical and boundary element models for crack penetration for the first fracture and carried out the related calculations. M.R. computed the relationship between turbulent dissipation in the fissure and the crack opening angle. D.J.H. proposed the mechanism of forming subsequent parallel fractures due to bending stresses and carried out the related calculations. D.J.H. drafted the manuscript with inputs from M.M. and M.R. All authors reviewed and commented on the manuscript.
Competing interests
The authors declare no competing interests.
Methods
Temperature structure
The total ice shell thickness () and the effective elastic thickness () are related by the temperature structure of the ice shell. For a conductive ice shell, accounting for the temperature-dependent thermal conductivity, which goes as , the temperature structure is given by (e.g., 3)
| (4) |
where is the depth below the surface and where and are the surface and basal temperatures, respectively. On long timescales, the relatively warmer parts of the ice shell behave viscously while the coldest parts of the ice remain elastic. If the ductile layer corresponds to the ice that is warmer than , then from (4), and assuming and , we obtain .
Tensile stress accumulation due to secular cooling
Here, beginning with equations (2)-(4) of Manga & Wang 5, we obtain a set of closed form analytical expressions that capture the effects of ocean overpressure and ice shell tensile stress accumulation resulting from secular cooling and the corresponding ice shell thickening. Following the notation of Manga & Wang 5, we assume an ice shell of outer radius and inner radius sitting above a global liquid water ocean over a rocky core of radius . Taking the ice and water densities to be and , respectively, it can be shown that the excess pressure in the ocean resulting from freezing a thickness of water is given by
| (5) |
where is the radius corresponding to the base of the elastic layer (, if the elastic layer thickness is ). This excess ocean pressure drives tangential stresses in the ice shell that, when evaluated at the outer surface , are given by
| (6) |
Figure S1 shows that, starting with an intact ice shell that is capable of supporting global scale tangential stresses, a few hundred meters of ocean freezing is sufficient to cause tensile failure in the ice shell. This result is consistent with the findings of Manga & Wang 5 but was obtained analytically rather than numerically.
Manga & Wang 5 assumed a uniform ice shell such that there was no preferred location for the tensile failure. For purposes of the above calculation, we have made the same assumption. However, whereas a non-uniform ice shell thickness should not significantly affect the above result, it does affect the preferred location for the tensile failure as stresses will concentrate in the thinnest parts of the shell. Even prior to the initiation of significant eruptive activity, the ice shell is expected to have been thinnest at the poles due to the non-uniform distribution of tidal dissipation 7. Hence, the tangential stresses resulting from secular cooling should have been concentrated at both poles, with tensile failure being equally likely to occur at either pole.
Propagation of initial fracture
Once initiated at the surface (Figure 1a), tensile cracks will propagate rapidly downward. We develop a model based on linear elastic fracture mechanics (LEFM) to calculate the maximum depth of penetration of fractures. We assume that on long timescales, cold ice near Enceladus’s surface supports elastic stresses but warmer ice at the base of the ice shell behaves as a viscous fluid and does not support elastic stresses (see above). As the subsurface ocean is pressurised, tensile stresses are generated globally in the elastic layer, and if these stresses exceed the tensile strength of ice, a fracture will initiate at the surface and propagate downward. The model from the previous section always predicts maximum tensile stresses at the surface, rather than at intermediate depths within the ice shell. If the tip of the fracture extends below the stressed elastic layer, the upper region of the crack is under tension but the tip of the crack is under compression due to overburden pressure. We model the downward propagation of the fracture under the assumption that the entire ice shell behaves as a linear elastic solid on the timescale of crack propagation but that only the elastic layer supports tensile stresses that encourage fracture penetration. We use a boundary element code based on the displacement discontinuity method 4, extended to include a crack-tip element 6 to more accurately resolve the stress field near the crack tip. In each calculation, we initiate a short crack near the surface, extending to one-half the depth () where lithostatic compression balances the applied tensile stress ()
| (7) |
where is depth from the surface. We note that this formula is similar to the maximum depth of fracture penetration from Qin et al. 5, except that we account for the presence of a viscous ice layer. We solve for , obtaining
| (8) |
We calculate the mode-I stress intensity factor for the crack. Next, we incrementally extend the crack length, computing a new solution for displacements and for each successive crack length. The crack is arrested if , which is equivalent to assuming zero fracture toughness. Our numerical and analytical results are in good agreement with one another (Figure S2) and are consistent with the earlier work by Rudolph & Manga 6.
Bending stresses
The load acting at the edge of the broken plate (see main text and below) causes bending stresses to develop in the elastic part of the ice shell (e.g., 25, 26). We assume the ice shell is completely broken at the initial fracture and that there are no remaining horizontal loads—we assume that membrane stresses are not important since they cannot be transmitted across the open fissure. The elastic layer thickness is and the total shell thickness is . Approximating the problem in a Cartesian geometry, and assuming cylindrical bending, the bending moment at any given point is related to the curvature in the elastic plate, and is given by
| (9) |
where is the deflection, is the horizontal distance increasing away from the fracture, and where is the flexural rigidity, given by
| (10) |
where and are the Young’s modulus and Poisson’s ratio for the ice lithosphere. We assume the flexural rigidity does not vary with . The load is related to the deflection by
| (11) |
where is the acceleration due to gravity and is the density of the water (we assume only vacuum exists above the ice shell).
For a line load acting at the edge of the broken plate, it can be shown (e.g., 25) that the deflection is given by
| (12) |
where is the line load (in units of N/m) and where is the characteristic length scale for flexure, given by
| (13) |
It can be shown that the bending moment per unit length along the fracture (units of N) is then given by
| (14) |
The maximum bending moment occurs where , at
| (15) |
The fibre stresses (units of Pa) within the plate can be written
| (16) |
where is the vertical position measured downward from the top of the plate (Figure S3). The maximum fibre stresses occur at , where the stresses are tensile in the upper half (where ) and compressive in the lower half (where ) of the deflected elastic plate.
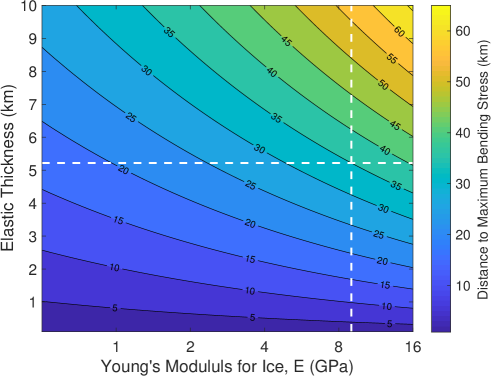
This distance, , varies as a function of the elastic properties of the shell and is a 3/4 power function of the elastic thickness () and a 1/4 power function of the Young’s modulus () (Figure S4). Assuming uniform properties across the ice shell, tensile failure will occur at this distance and parallel to the first fracture. If the typical tiger stripe spacing of is governed by the position of maximum bending stresses, then this spacing can be used to determine the elastic properties of the ice shell at the time of the fracture’s formation. Given a Young’s modulus of , for example, we find that the maximum stresses occur at a distance of from the fracture when the elastic thickness is (Figures S3 and S4). Assuming a predominantly conductive ice shell, and taking the elastic layer to correspond to the uppermost part of the ice shell where the temperature is (see above), this elastic thickness implies a total shell thickness (elastic plus ductile layers) of , consistent with the polar ice shell thickness inferred from shape, gravity, and libration observations 7. We note that, whereas may have been the relevant effective elastic layer thickness at the time of the formation of the tiger stripes, subsequent reworking of the ice shell may have introduced faults that have reduced the modern effective elastic thickness to perhaps , in line with estimates based on studies of local flexural and tectonic features (e.g., 6, 7).
The elastic properties similarly determine how the magnitude of the fibre stresses is related to the magnitude of the load. Given that the maximum tensile stress occurs at and , from equation (16), its magnitude is
| (17) |
which can also be written in terms of the required load, , as
| (18) |
Tensile failure occurs when the load is sufficient to make the bending moment at equal to the critical value of
| (19) |
where is the tensile failure limit for cold ice, which we take to be (e.g., 8) for intact ice or for previously weakened ice.
Ice shell thinning
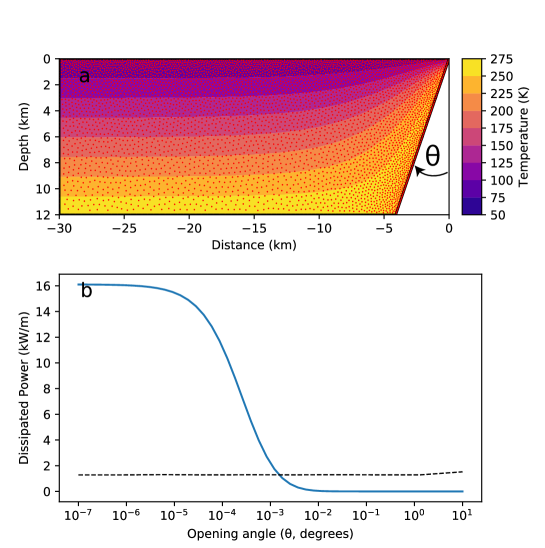
Here, we assess the possible effect of loss of buoyancy due to thinning ice in the vicinity of an open fissure. We calculate the steady-state temperature distribution around a fissure using a radial basis function finite-difference approach. We use an isothermal surface boundary condition of , and an isothermal boundary condition of on the crack wall and along the ice-ocean interface (Figure S5a). To resolve the discontinuous change in temperature where the crack meets the surface, we applied a boundary condition along the crack that varies linearly from the surface temperature to over the upper 10% of the ice shell thickness (i.e., the portion of the crack that extends above the level of neutral buoyancy). We applied a far-field insulating boundary condition at a distance from the crack. For purposes of this calculation, the thermal conductivity was taken as a constant (). For a vertical crack in an ice shell with thickness , the steady-state conductive heat flow is per side.
Once open, the tendency for the fissure to narrow due to freezing is opposed by dissipation as water is cyclically flushed in and out of the fissure (e.g., 4). Since the temperature gradient, and therefore the rate of conductive heat loss away from the fissure, is greatest near the surface and decreases towards the base of the fissure, the freezing will be most rapid at the top of the fissure and slower toward its base. We idealise the crack as a wedge shape and estimate the dissipation within the crack as well as the heat conducted away from the crack.
We estimate the steady state opening angle, , for the melt-back wedge illustrated in Figure S5a. Assuming the crack opens and closes periodically 9, we can write the width of the crack, , as a function of depth, , and time, , as
| (20) |
where is the width of the crack at the surface, is the amplitude of the oscillations, and is the angular frequency. Conservation of mass requires that the velocity of the liquid in the crack, , be related to the variations in crack width:
| (21) |
The energy dissipated by oscillatory flow in a fracture is found by relating the resolved shear stress on the wall, , to the mean flow velocity, , calculated from (21), using the Darcy-Weisbach equation
| (22) |
where is a friction factor and is the fluid density. While highly turbulent, the average properties of the flow are in quasi-steady state, and the net acceleration of the water is negligible. The wall shear stress is thus balanced by a dynamic pressure loss per unit depth as
| (23) |
In turn, the rate of energy dissipation per unit volume () is related to the rate of decrease in dynamic pressure,
| (24) |
We multiply by the crack width to obtain the energy dissipated per unit area of crack wall
| (25) |
Dissipation decreases very rapidly with increasing crack width (i.e., increasing opening angle). In Figure S5b, we show predicted values of the dissipation integrated along the wall of the crack (from the surface to the ocean-ice interface) for a crack with a surface width of and an oscillation amplitude of , assuming a friction factor (representative of fully-developed turbulent flow in a smooth channel). Owing to the large uncertainties in the crack width, amplitude of oscillation, and friction factor, the dissipation is also very uncertain, but our result nevertheless demonstrates that if the crack begins to freeze shut, dissipation in the crack becomes much larger than the conducted heat flow, causing melting. On the other hand, dissipation alone cannot produce enough melt-back to achieve opening angles larger than a few hundredths of a degree. Thus, the dissipation mechanism, while capable of preventing the fissure from freezing out (see also 4), does not produce a melt-back wedge wide enough to contribute significantly to the bending stresses discussed above.
Ridge accumulation
Erupted material can accumulate in ridges at the surface, loading the edge of the broken elastic plate from the top. Such a load, per unit length along the fracture, is
| (26) |
where is the mass of accumulated material and is the total length of the ridges. Given an accumulation rate of , the load as a function of time is given by
| (27) |
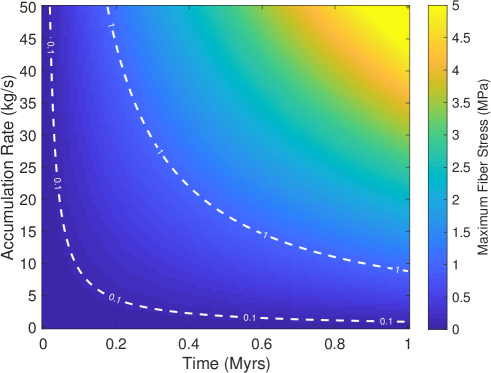
The accumulated load gives rise to tensile stresses which are maximum at and given by equation (18). Figure S6 shows this maximum tensile stress as a function of time and accumulation rate, with contours indicating two examples of tensile failure limits. Assuming a tensile failure limit of and the same elastic properties used in Figure S3, failure occurs when . Assuming an accumulation rate of per length of ridge, the accumulated load will be sufficient to initiate tensile failure after . We note, as a point of reference, that the current total rate of erupted solids has been estimated at of which 9% is estimated to escape from Enceladus while the remaining 91% falls ballistically back to the surface 21. The rate of material accumulation per ridge is of course somewhat smaller and depends on how one assumes the erupted material is distributed among the tiger stripes, whose rates of activity vary. Note that the eruption rates also vary with time over various timescales 18, 10.
The accumulated load may be related to the cross-sectional area, , of the ridge by
| (28) |
where is the assumed density of the ridge. Assuming , for example, we obtain a load sufficient to generate tensile stresses of when the cross-sectional area of the ridge is . If the effective tensile failure limit at the time of the tiger stripes’ formation is only , then the required ridge cross section is just . Given estimates of the height () and width () of the present day ridges 24 and accounting for the deflection () discussed above, the ridge cross-sections may only be at present. This suggests that our proposed mechanism requires either that the bending-induced failures occurred only after the effective tensile failure limit was reduced to , perhaps due to pervasive weakening following the formation of the first fissure, or that the ridges were initially larger and have experienced some relaxation or erosion since their formation.
Subsequent fractures
Once the bending stresses are great enough to cause tensile failure at the surface, a new fracture is initiated (Figure 1b). Whether or not the new fracture can penetrate the ice shell depends on how the stress field evolves during crack propagation. Although this is a dynamic process, we can gain some insight by considering the hypothetical static scenario in which the crack is arrested after propagating a distance from the surface. At this point, the load (), which has not changed on the timescale of crack propagation, would now have to be supported by the partially fractured plate. That is, focusing on the location of the fracture, where , the bending moment that must be supported remains fixed at , given by equation (19). The fibre stresses in the remaining unbroken part of the lithosphere would have to support the same bending moment but with a reduced effective elastic layer thickness. The bending stress at the crack tip is thus
| (29) |
where is the initial elastic layer thickness (before the fracture develops) such that the effective remaining elastic layer thickness is always . The bending stresses at the crack tip are therefore always tensile and increasing in magnitude as the crack tip propagates downward through the ice shell (dashed red lines in Figure S7).
This effect is opposed by the background compressive stresses that exist due to overburden pressure, which increases linearly with depth (dotted blue lines in Figure S7), such that the net stress at the crack tip is
| (30) |
The gradient as a function of depth is then given by
| (31) |
such that increases monotonically with as long as
| (32) |
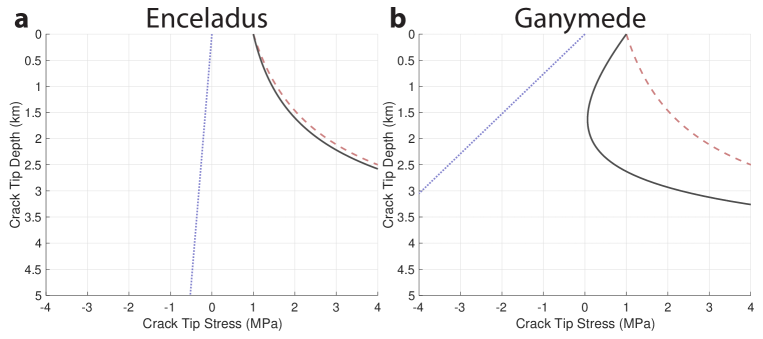
Provided that (32) is satisfied, the tensile stresses due to bending always exceed the compressive stresses due to overburden pressure, such that the net stresses at the crack tip are always tensile, and increasingly so as the crack penetrates deeper through the lithosphere (Figure S7). As a result, once initiated in this way, crack propagation cannot be arrested at any point within the lithosphere. Whereas the condition described by (32) is readily satisfied for Enceladus due to its thin ice shell and small surface gravity, it may not be satisfied for larger bodies or when a thicker elastic layer is present. For example, this condition is not satisfied for Europa unless the elastic layer thickness is at the low end of the estimated range—less than about (Figure 2; 26). For Ganymede, Callisto, and Titan, the gravity is so strong that the compressive stresses overwhelm the bending stresses for plausible shell thicknesses, precluding rapid crack propagation. Hence, because this situation is permitted only for bodies with low surface gravity, or when the ice shell is extremely thin, Enceladus may be unique among ocean worlds for its ability to develop through-going fractures due to bending stresses (positive or green region of Figure 2).
What happens when the crack tip reaches the ductile part of the ice? The relatively warmer () lower part of the ice shell is ductile on long timescales, and therefore does not participate in the gradually accumulated bending stresses that support the load at the edge of the previously broken plate. If the new fracture is propagating sufficiently rapidly, however, the entire ice shell behaves elastically (the Maxwell time is at least a few hours, even for the low viscosity ice near its melting temperature). That is, as the fracture propagates downward, stresses may build within the otherwise ductile regions of the ice shell, helping to support the load, at least transiently. Determining how this changes the evolution of the stress profile during crack propagation is not trivial and will be the subject of future work.
References
- 1
- 2
- Nimmo 2004 Nimmo, F. Non-Newtonian topographic relaxation on Europa. Icarus 168, 205–208 (2004).
- Crouch & Starfield 1983 Crouch, S. L. & Starfield, A. M. Boundary Element Methods in Solid Mechanics (George Allen and Unwin, 1983).
- Qin et al. 2007 Qin, R., Buck, W. R. & Germanovich, L. Comment on ”Mechanics of tidally driven fractures in Europa’s ice shell” by S. Lee, R.T. Pappalardo, and N.C. Makris [2005. Icarus 177, 367-379]. Icarus 189, 595–597 (2007).
- Bland et al. 2007 Bland, M. T., Beyer, R. A. & Showman, A. P. Unstable extension of Enceladus’ lithosphere. Icarus 192, 92–105 (2007).
- Giese et al. 2008 Giese, B. et al. Enceladus: An estimate of heat flux and lithospheric thickness from flexurally supported topography. Geophysical Research Letters 35, 1–5 (2008).
- Hammond et al. 2018 Hammond, N. P., Barr, A. C., Cooper, R. F., Caswell, T. E. & Hirth, G. Experimental Constraints on the Fatigue of Icy Satellite Lithospheres by Tidal Forces. Journal of Geophysical Research: Planets 123, 1–15 (2018).
- Hurford et al. 2007 Hurford, T. A., Helfenstein, P., Hoppa, G. V., Greenberg, R. & Bills, B. G. Eruptions arising from tidally controlled periodic openings of rifts on Enceladus. Nature 447, 292–294 (2007).
- Ingersoll & Ewald 2017 Ingersoll, A. P. & Ewald, S. P. Decadal timescale variability of the Enceladus plumes inferred from Cassini images. Icarus 282, 260–275 (2017).
Supplementary Information