GASTON: Galactic Star Formation with NIKA2
Abstract
Understanding where and when the mass of stars is determined is one of the fundamental, mostly unsolved, questions in astronomy. Here, we present the first results of GASTON, the Galactic Star Formation with NIKA2 large programme on the IRAM 30m telescope, that aims to identify new populations of low-brightness sources to tackle the question of stellar mass determination across all masses. In this paper, we focus on the high-mass star formation part of the project, for which we map a deg2 region of the Galactic plane around in both 1.2 mm and 2.0 mm continuum. Half-way through the project, we reach a sensitivity of 3.7 mJy/beam at 1.2mm. Even though larger than our target sensitivity of 2 mJy, the current sensitivity already allows the identification of a new population of cold, compact sources that remained undetected in any (sub-)mm Galactic plane survey so far. In fact, about 25% of the compact sources identified in the 1.2mm GASTON image are new detections. We present a preliminary analysis of the physical properties of the GASTON sources as a function of their evolutionary stage, arguing for a potential evolution of the mass distribution of these sources with time.
1 Introduction
The characteristic shape of the initial mass function (IMF) of stars has its origin rooted in the mechanisms leading to their formation. It is therefore natural to envisage the existence of different star formation regimes for every part of the IMF where the power-law slope changes. The nearly systematic association of solar-mass prestellar cores with dense, self-gravitating filaments arzoumanian2019 ; konyves2015 led to a picture where the peak of the IMF would be the result of the gravitational fragmentation of such filaments into individual cores, providing a compact and fixed mass reservoir for the formation of low-mass stars inside them andre2010 ; andre2014 . For high-mass stars, however, it is well known that thermal Jeans-type fragmentation cannot explain the formation of cores more massive than a few solar masses. Hence, the formation of massive stars requires additional physics. There are strong indications that the dynamical evolution of the parsec-scale mass reservoirs surrounding massive young stellar objects play a key role. Even though the question about how massive stars form is still very much debated, observations and simulations converge towards a picture where massive stars form at the centre of globally collapsing clouds, quickly growing in mass as a result of the large infall rates (e.g. bonnell2004, ; wang2010, ; peretto2013, ; duartecabral2013, ). In this picture, massive stars are said to be clump-fed, by opposition to low-mass star formation where stars are core-fed. To understand how the IMF is determined across all stellar masses, one now needs to focus on two additional mass intervals: Intermediate mass stars ( M M⊙) for which both core-fed and clump-fed scenarios might be at work; and brown dwarfs ( M⊙) for which additional mechanisms such as dynamical instabilities of multiple stellar systems bate2002 or disc fragmentation thies2010 might play a role in their formation process. Unfortunately, no current (sub-)mm survey is either big nor sensitive enough to detect significant populations of their corresponding progenitors.
The NIKA2 NIKA2-Adam ; NIKA2-Calvo ; NIKA2-Bourrion GASTON large programme has been designed to fill that gap, with three key objectives. In addition to tackling the question of the dominant formation mechanism of brown-dwarfs in nearby clouds and mapping out a fraction of the Galactic plane at a mass sensitivity and angular resolution never reached before in a multiple square degree region, GASTON will, as a result of the dual frequency capability of NIKA2, characterise dust properties across a wide range of environments. Here, we present the first results of the Galactic plane part of the project, roughly half-way through the observation campaign.
2 Observations
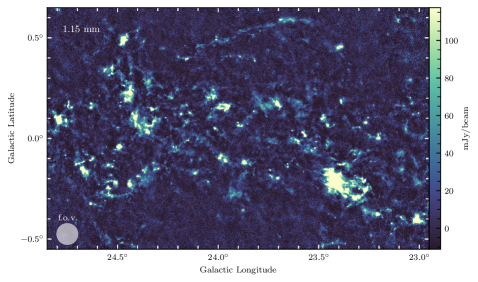
The section of the Galactic plane targeted within GASTON is and , which has been selected for the high density of far-infrared sources identified by Hi-GAL (molinari2016, ). The region is observed with a series of adjoining 0.5∘ by 1.5∘ rectangular fields that cross the mid-plane at a angle. Integrations are repeated over as many times as necessary to achieve an approximately uniform sensitivity over the target area. A total area of deg2 is covered, the inner deg2 of which will reach a uniform sensitivity. At the time of writing, about half of the observations have been done (i.e. h), and the measured sensitivities are mJy/beam at 1.2 mm and mJy/beam at 2.0 mm. The angular resolutions are 12" and 18" at 1.2 mm and 2.0 mm, respectively. Flux calibration is regularly performed on primary calibrators such as Uranus. Pointing errors are within 3". The data has been reduced with the NIKA2 consortium IDL pipeline. The resulting 1.2 mm map is shown in Fig. 1.
3 Compact source identification and cross-matching
As it can be seen in Fig. 1, structures with sizes of the order of the field-of-view are being recovered by the IDL reduction pipeline. In order to identify compact sources, we filter out all structures larger than an arcminute so that every source on the field is identified in a background-free environment. To do this, we first convolve our GASTON 1.2mm image with a Gaussian kernel to achieve an effective resolution of FWHM=60", and then subtract that convolved image from the original GASTON image, effectively filtering all sources larger than 60". We then run a dendrogram analysis rosolowsky2008 on the filtered image to identify individual sources above and compute their peak and integrated flux densities.
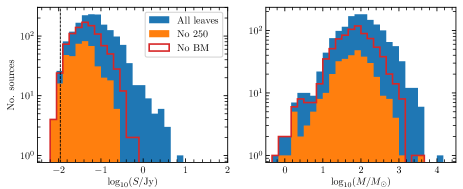
In total, we have identified slightly over 1600 1.2 mm compact sources. The integrated flux distribution of these sources is shown with the blue histogram in Fig. 2-left. We can see that the histogram peaks at about 50 mJy, goes down to mJy, and up to nearly 10 Jy for the brightest source. In order to evaluate how many of these GASTON sources are already known, we cross-matched their positions with catalogued Herschel sources, the most complete, and sensitive, Galactic plane survey of cold dust structures available. For this, we used two Herschel catalogues: the band merged catalogue (BM) from elia2017 , and the 250 m catalogue of molinari2016 . By definition, the BM catalogue is a subsample of the 250 m catalogue. The histograms of GASTON sources that do not have any counterpart in these two catalogues are also displayed in Fig. 2, in which one can see that there are about 400 GASTON sources () that do not appear in either catalogue. These sources are, as expected, low-brightness sources (nearly all having a flux Jy) that were most likely not picked up in Herschel images as a result of the lower far-infrared contrast of cold sources with cirrus noise. This sample of previously undetected sources opens up a brand new window on the characterisation of the earliest stages of star formation.
4 Source properties: Distance, dust temperature, and masses
One fundamental property of the GASTON sources is their mass. To estimate a mass from dust continuum observations, one needs three quantities: flux, distance, and dust temperature. Fluxes of GASTON sources have been already presented in the previous section. In order to get a distance estimate for each GASTON source we used the Galactic Ring Survey 13CO(1–0) data romanduval2010 along with the Galactic rotation model from reid2016 . For each source we get the corresponding 13CO(1–0) spectrum averaged over the footprint of the GASTON source and, in case of multiple 13CO(1–0) velocity components, we select the strongest one as the GASTON source velocity. We then use the Bayesian distance estimator from reid2016 to determine the distance of maximum likelihood. Finally, via a friend-of-friend algorithm, we group nearby sources with similar velocities together, and use the median distance of these sources as the single distance for that group. The idea behind this is to mitigate the effects of peculiar velocities of clumps within clusters being interpreted as differences in the distance.
Regarding the dust temperature of each GASTON source we used the same method as developed by peretto2016 , and successfully used in combination with NIKA data in rigby2018 . This method uses the ratio of the Herschel 160 m flux to the 250 m flux as a proxy for temperature. Here, we further filter both images using the same kernel as on the GASTON images to remove any large-scale contaminating background emission. From the Herschel filtered images one can get a dust temperature at 18" resolution (the resolution of the 250 m image) for every GASTON source. With distances, and dust temperatures one can now compute the mass distributions of the GASTON compact sources. For this we assumed the following specific dust opacity law , which accounts for a 1% dust-to-gas mass ratio andre2010 ; rigby2018 . The mass distributions of the three samples (see previous section) are shown in Fig. 2-right. The striking feature of this figure is the fact that sources that were not identified before in any other catalogue (orange histogram) have a very similar mass distribution to rest of the sample, despite having lower fluxes. This shows that this new sample is mostly made of cold compact and relatively massive sources that were just not picked up by any other survey. This source population could represent an important missing building block in our understanding of the stellar mass determination.
5 Evolution of mass distributions
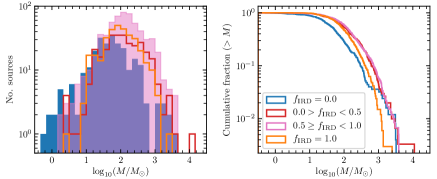
As dusty, star-forming clumps evolve, embedded young-stars heat up an increasing fraction of the clump dust mass. During that process, a cold clump that was originally dark in the mid-infrared can become infrared bright. One can therefore use the infrared darkness of a clump as a proxy for its evolutionary stage battersby2017 . Using a combination of Spitzer 8 m and Herschel data, Watkins, Peretto et al. (in prep) have developed a method to compute the fraction of a clump mass that is infrared dark. We here use that method to characterise the infrared darkness of GASTON sources. We then split our sample into four bins of infrared darkness parameters, from (totally infrared dark) to (totally infrared bright), and we plot the mass distributions for each of the four subsamples. This is shown in Fig. 3. This figure tentatively shows that there are differences in the shape of the mass distribution, with the most massive sources having intermediate values of infrared darkness parameter. If one considers infrared darkness as a valid proxy for time evolution, then this would suggest that sources gain mass as they evolve from to , and then lose mass as they evolve towards . This is what one expects in a scenario where core and protostellar mass growth occur simultaneously hatchell2008 .
6 Summary
We used NIKA2 on the IRAM 30m telescope to map over 2 square degrees of the Galactic plane at 1.2 mm and 2.0 mm. While the observing campaign is still ongoing we performed a first analysis of the 1.2 mm image. The high sensitivity of these GASTON images allowed us to identify a brand new population of low-brightness compact sources, which, being amongst the coldest sources, have a similar mass distribution as those which were already known. This new sample might well represent a missing building-block in our understanding of the stellar mass determination process. Using infrared darkness as a possible proxy of their evolutionary stage, we also suggest that there might be some evidence for a time evolution of the clump mass distribution. However, further detailed analysis of the data is required to evaluate the robustness of such interpretation. The remaining integration time of the GASTON field will allow us to increase source statistics on cold intermediate-mass sources ( M⊙), allowing the connection of our results with those obtained in well-known nearby star-forming clouds. In this context, the GASTON 2.0 mm data will be instrumental in confirming the nature of low signal-to-noise ratio sources detected at 1.2 mm.
Acknowledgements
N. P. and A. R. would like to thank STFC for support under the consolidated grant number ST/N000706/1. We thank the Royal Society for providing computing resources under Research Grant number RG150741. We would also like to thank the IRAM staff for their support during the campaigns. The NIKA dilution cryostat has been designed and built at the Institut Néel. In particular, we acknowledge the crucial contribution of the Cryogenics Group, and in particular Gregory Garde, Henri Rodenas, Jean Paul Leggeri, Philippe Camus. This work has been partially funded by the Foundation Nanoscience Grenoble and the LabEx FOCUS ANR-11-LABX-0013. This work is supported by the French National Research Agency under the contracts "MKIDS", "NIKA" and ANR-15-CE31-0017 and in the framework of the "Investissements dâavenirâ program (ANR-15-IDEX-02). This work has benefited from the support of the European Research Council Advanced Grant ORISTARS under the European Union’s Seventh Framework Programme (Grant Agreement no. 291294). We acknowledge fundings from the ENIGMASS French LabEx (R. A. and F. R.), the CNES post-doctoral fellowship program (R. A.), the CNES doctoral fellowship program (A. R.) and the FOCUS French LabEx doctoral fellowship program (A. R.). R.A. acknowledges support from Spanish Ministerio de Economía and Competitividad (MINECO) through grant number AYA2015-66211-C2-2.
References
- (1)
- (2) D. Arzoumanian et al., Astron. Astrophys.. 621, 42 (2019)
- (3) V. Könyves et al., Astron. Astrophys.. 584, A91 (2015)
- (4) P. André et al., Astron. Astrophys.. 518, 102 (2010)
- (5) P. André et al., Protostars and Planets VI. Univ. of Arizona Press, Tucson, p.27 (2014)
- (6) N. Peretto et al., Astron. Astrophys.. 555, A112 (2013)
- (7) A. Duarte-Cabral et al., Astron. Astrophys.. 558, A125 (2013)
- (8) I. A. Bonnell et al., MNRAS. 349, 735 (2004)
- (9) P. Wang et al., ApJ. 709, 27 (2010)
- (10) M. Bate et al., MNRAS. 332, 65 (2002)
- (11) I. Thies et al., ApJ. 717, 577 (2010)
- (12) R. Adam et al., Astron. Astrophys.. 609, A115 (2018)
- (13) M. Calvo et al., Journal of Low Temperature Physics, 184, 816 (2016)
- (14) O. Bourrion et al., Journal of Instrumentation. 11, P11011 (2016)
- (15) S. Molinari et al., Astron. Astrophys.. 591, A149 (2016)
- (16) E. Rosolowsky et al., ApJ. 679, 1338–1351, (2008)
- (17) D. Elia et al., MNRAS471, 100–143 (2017)
- (18) J. Roman-Duval et al., ApJ, 723, 492
- (19) M. J. Reid et al., ApJ, 823, 77 (2016)
- (20) N. Peretto et al., Astron. Astrophys., 590, A72 (2016)
- (21) A. Rigby et al., Astron. Astrophys., 615, A18 (2018)
- (22) C. Battersby et al., ApJ. 835, 263 (2017)
- (23) J. Hatchell & G. Fuller Astron. Astrophys.482, 855–863 (2008)