The cold circumgalactic environment of MAMMOTH-I: dynamically cold gas in the core of an Enormous Ly Nebula
Abstract
The MAMMOTH-I Nebula at redshift 2.3 is one of the largest known Ly nebulae in the Universe, spanning 440 kpc. Enormous Ly nebulae like MAMMOTH-I typically trace the densest and most active regions of galaxy formation. Using sensitive low-surface-brightness observations of CO(1-0) with the Very Large Array, we trace the cold molecular gas in the inner 150 kpc of the MAMMOTH-I Nebula. CO is found in four regions that are associated with either galaxies or groups of galaxies that lie inside the nebula. In three of the regions, the CO stretches up to 30 kpc into the circum-galactic medium (CGM). In the centermost region, the CO has a very low velocity dispersion (FWHMCO 85 km s-1), indicating that this gas is dynamically cold. This dynamically cold gas coincides with diffuse restframe optical light in the CGM around a central group of galaxies, as discovered with the Hubble Space Telescope. We argue that this likely represents cooling of settled and enriched gas in the center of MAMMOTH-I. This implies that the dynamically cold gas in the CGM, rather than the obscured AGN, marks the core of the potential well of this Ly nebula. In total, the CO in the MAMMOTH-I Nebula traces a molecular gas mass of MH2 1.4 (/3.6) 1011 M⊙, with roughly 50 of the CO(1-0) emission found in the CGM. Our results add to the increasing evidence that extended reservoirs of molecular gas exist in the CGM of massive high-z galaxies and proto-clusters.
1 Introduction
Massive galaxies at high redshifts are known to co-evolve with large reservoirs of warm circum-galactic medium (CGM), generally detected in Ly (T 104 K). Giant nebulae of Ly-emitting gas that extend on scales of 100 kpc were first discovered around high-redshift radio galaxies (e.g., Djorgovski et al., 1987; McCarthy et al., 1987, 1990, 1995; Heckman et al., 1991; Eales et al., 1993; van Ojik et al., 1996, 1997; Villar-Martín et al., 2002, 2003, 2006, 2007; Pentericci et al., 2001; Reuland et al., 2003, 2007; Miley et al., 2006; Swinbank et al., 2015; Vernet et al., 2017). For a long time, similar giant Ly nebulae around radio-quiet high- galaxies remained elusive (see Bergeron et al. 1999 for a rare example). However, more recent studies revealed Enormous Ly Nebulae (ELANe) stretching across 300500 kpc around a number of radio-quiet quasi-stellar objects (QSOs) (Cantalupo et al., 2014; Martin et al., 2014; Hennawi et al., 2015; Borisova et al., 2016; Cai et al., 2017b, 2018; Arrigoni Battaia et al., 2019; Cai et al., 2019). In fact, Ly emission on 10s100 kpc scale now appears to be ubiquitously associated with QSOs (Borisova et al., 2016; Arrigoni Battaia et al., 2019; Cai et al., 2019).
The most extreme nebulae of Ly-emitting gas cover regions of several 100 kpc and luminosities of 1044-45 erg s-1 (see reviews by Miley & De Breuck, 2008; Cantalupo, 2017). These ELANe often trace large galaxy overdensities, representing regions of massive galaxy and cluster formation (e.g., Hatch et al., 2009; Dannerbauer et al., 2014; Hennawi et al., 2015; Cai et al., 2017b; Arrigoni Battaia et al., 2018a).
Several mechanisms have been proposed to be responsible for creating the Ly emission in these giant nebulae, including photo-ionization by strong ultra-violet (UV) radiation (Gould & Weinberg, 1996; Cantalupo et al., 2005; Geach et al., 2009; Kollmeier et al., 2010; Overzier et al., 2013), resonant scattering of Ly emission from an embedded source (Dijkstra & Loeb, 2009a; Hayes et al., 2011; Cantalupo et al., 2014; Geach et al., 2014, 2016), shock-heating by feedback and outflows (Taniguchi & Shioya, 2000; Taniguchi et al., 2001; Wilman et al., 2005), or cooling radiation from gas that settles deep in the potential well (Fardal et al., 2001; Yang et al., 2006; Dijkstra & Loeb, 2009b; Faucher-Giguère et al., 2010; Rosdahl & Blaizot, 2012). Observational evidence for gas infall or accretion flows has been suggested for a number of giant Ly nebulae (Villar-Martín et al., 2007; Martin et al., 2015; Gullberg et al., 2016; Vernet et al., 2017; Arrigoni Battaia et al., 2018a).
A question that arises is how do these enormous gas reservoirs evolve, and ultimately drive the evolution of the massive galaxies that are forming within these nebulae? To study the direct connection between these gaseous nebulae and the stellar growth of massive galaxies, it is essential to trace gas at temperatures well beyond the limit of Ly cooling (i.e, T 104 K). Absorption-line studies revealed that the halos of massive QSOs contain cool gas with both a high covering fraction of optically thick H I absorbers (60) and metal enrichment beyond the typical virial radius (rvir 160 kpc) (e.g., Hennawi et al., 2006; Hennawi & Prochaska, 2007; Prochaska et al., 2013, 2014; Lau et al., 2016). In some of the largest ELANe (400 kpc), comparing the emission- and absorption-line properties of Ly, C IV and He II revealed that the cool gas must have a clumpy morphology that likely occupies the high-end tail of the distribution of volume densities, with n 13 cm-3 and cloud sizes 20 pc (Hennawi et al., 2006, 2015; Hennawi & Prochaska, 2007; Cantalupo et al., 2014, 2019; Arrigoni Battaia et al., 2015, 2018a).
The ultimate reservoir of halo gas that can fuel widespread star-formation is cold molecular gas (T 10100 K). Widespread reservoirs of cold molecular gas can be efficiently traced with observations of the low- transitions of carbon-monoxide, CO(,) (e.g., Papadopoulos et al., 2000; Ivison et al., 2011). Carbon emission in the form of [C i] or [C ii] (Papadopoulos et al., 2004; Carilli, & Walter, 2013; Bisbas et al., 2017) can also be a good tracer of widespread and quiescent reservoirs of cold gas, as Cicone et al. (2015) observed around a quasi-stellar object at = 6.4. These and other studies have added to the growing amount of evidence that widespread molecular gas can be present in the circum-galactic environments of massive high-z galaxies (e.g., Emonts et al., 2014, 2015, 2016; Ginolfi et al., 2017; Dannerbauer et al., 2017; Frayer et al., 2018; Fujimoto et al., 2019).
Direct evidence that cold molecular gas can be spread across many tens of kpc scales within the CGM of giant Ly nebulae came through observations of the Spiderweb Galaxy at = 2.2 (Miley et al., 2006; Emonts et al., 2016). CO(1-0) observations sensitive to low-surface-brightness emission revealed that the CGM of the Spiderweb contains 1011 M⊙ of cold molecular gas spread across 70 kpc, providing evidence for the existence of a cold, multi-phase CGM across the central parts of the Ly nebula (Emonts et al., 2016). Subsequent observations of CO(4-3) and [C i] 3P1-3P0 revealed that the molecular CGM in the Spiderweb has excitation conditions and carbon abundances similar to the interstellar medium in starforming galaxies (Emonts et al., 2018a). This cold molecular medium fuels in-situ star formation detected across the CGM with deep HST imaging (Hatch et al., 2008), providing a direct link between a giant Ly-emitting nebula and the stellar buildup of a massive forming galaxy.
In this paper, we present observations of extended molecular gas across a radio-quiet ELAN, namely the MAMMOTH-I Nebula at = 2.3. The MAMMOTH-I Nebula is one of the most extreme ELANe found to date, with Ly emission stretching across 440 kpc (Cai et al., 2017b). It is located in the extreme galaxy overdensity BOSS1441, which traces a proto-cluster (Cai et al., 2017a; Arrigoni Battaia et al., 2018b; Mukae et al., 2019). An 850m continuum source at the center of MAMMOTH-I indicates the presence of a starburst and obscured Active Galactic Nucleus (AGN), with a combined energy sufficient to power the Ly nebula either through photo-ionization or shock-heated outflows (Arrigoni Battaia et al., 2018b). With the goal of studying studying cold gas that can drive star formation in MAMMOTH-I, we used NSF’s Karl G. Jansky Very Large Array (VLA) in its most compact D-configuration to obtain sensitive low-surface-brightness observations of CO(1-0). In Sect. 2 we describe the observations, in Sect. 3 we present the results of our study, followed by a discussion in Sect. 4.
Throughout this paper, we assume the following cosmological parameters: H km s-1 Mpc-1, and , i.e., 8.3 kpc/′′ and Mpc at z = 2.31 (Wright, 2006).
2 Observations
2.1 Radio data
We observed MAMMOTH-I for 14 hrs on-source with the VLA in D-configuration from February April 2017 (ID: VLA/17A-174). We used two overlapping sets of 8 spectral windows, containing 128 channels of 1 MHz each, to cover a contiguous bandwidth of 1 GHz. We placed this band so that it includes the redshifted CO(1-0) line at 34.808 GHz ( = 115.27 GHz). The observations were done using 3C 286 for bandpass and flux calibration. The complex gains were corrected with intermittent short scans every 6.5 minutes on the secondary VLA calibrator J1419+3821, which is located at 4.5∘ distance from MAMMOTH-I.
The VLA data were reduced with the Common Astronomy Software Applications (CASA; McMullin et al. 2007; CASA team et al. in prep.). We imaged the data using natural weighting and a spectral resolution of 30 km s-1. Because of the faintness of the CO, no deconvolution was applied. The resulting root-mean-square (rms) noise level is 0.057 mJy beam-1 channel-1. The synthesized beam is 2.6′′ 2.3′′, with a position angle (PA) of . The CO emitters that we discuss in this paper lie within 10′′ of the pointing center of the observations (RA = 14h41m24.0s; dec = 40∘ 03′ 10.0′′), hence primary beam corrections are negligible. All velocities in this paper are relative to the CO(1-0) redshift, = 2.3116 0.0004 (Sect. 4.2).
2.2 Optical data
We observed MAMMOTH-I with the Hubble Space Telescope (HST) Wide Field Camera 3 (WFC3) in the F160W filter (ID: 14760; PI: Z. Cai). For our target at = 2.3116, the infra-red F160W filter covers the restframe optical wavelength range of roughly 4200 5100 Å. The observations were done on 2017 September 07 with an exposure time of 2212 sec. The data were pipeline calibrated using the data processing software system version COMMON 20172a. We then compared our HST image to data from the Gaia Data Release 2 (Gaia Collaboration et al., 2016, 2018) and found two bright stars that appear in both data sets, where they have the same coordinates to within 0.04′′. As we will show in Sect. 3.1, the galaxies in regions A and C also align perfectly with the CO(1-0) emission. We therefore did not need to correct the astrometry of the HST data. We note that trying to align the HST image with any of the galaxies in region B (Sect. 3.1) would require a shift of 0.6′′. This would result in offsets between the CO(1-0) and the galaxies in the other three regions (A, C, and D), as well as with the two bright Gaia-catalogue stars in the wider HST field. We therefore assume that the astrometry of our HST data is accurate to 0.1′′, as typically assumed for pipeline-calibrated HST data. We use these HST data as a reference to the CO(1-0) results. A full description and analysis of the HST data will be provided in a forthcoming paper (Cai et al. in prep).
We also observed MAMMOTH-I with the Keck Cosmic Web Imager (KCWI), which provides integral-field spectroscopy data in the rest-frame ultraviolet. Observations were done on 2018 May 18 with an on-source exposure time of 1 hour. We used the Blue Medium Grating with the Large Slicer, resulting in a spectral resolution of 2000 and field-of-view of 33′′ 20′′. This setup allowed us to simultaneously cover the Ly and CIV lines. A standard data reduction was performed. Details on the KCWI data will be described in an forthcoming paper (Li et al. in prep.)
3 Results
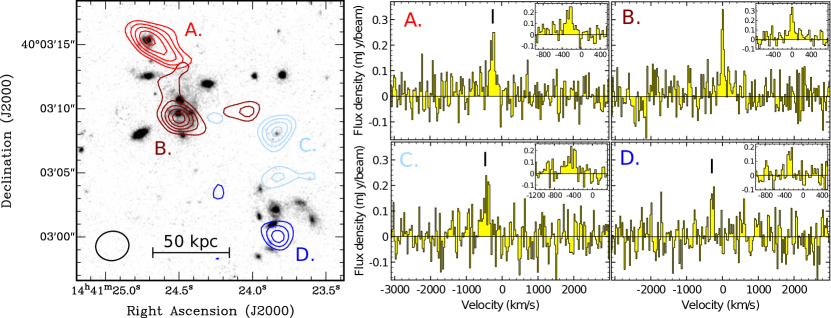
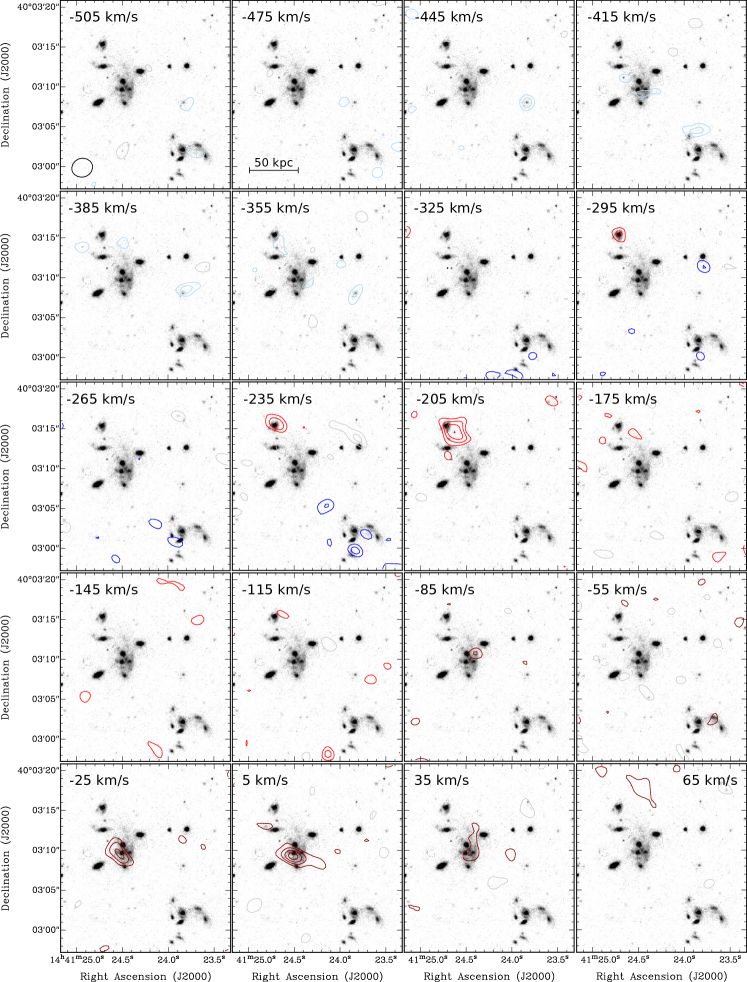
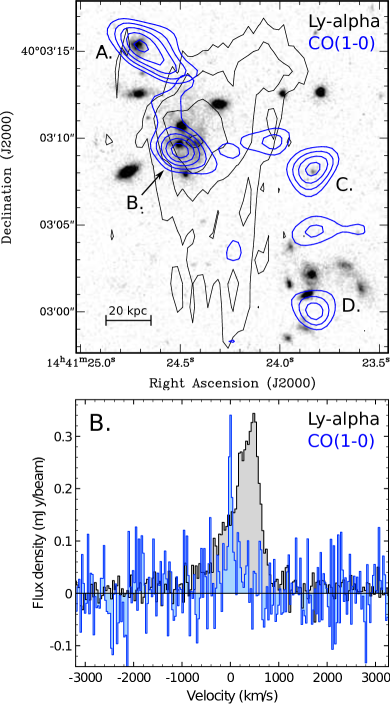
We detect CO(1-0) emission of cold molecular gas in the central 150 kpc region of the MAMMOTH-I Nebula. Figs. 1 and 2 show that the CO(1-0) emission is spatially and kinematically associated with four regions, representing galaxies or groups of galaxies. We will first present the CO(1-0) properties of the four region in Sect. 3.1 and Table 1, followed by an overview of the overall CO results for the MAMMOTH-I Nebula in Sect. 3.2.
| Region | A | B | C | D |
|---|---|---|---|---|
| vCO† (km s-1) | -245 15 | 0 | -445 25 | -280 15 |
| FWHMCO (km s-1) | 170 35 | 85 20 | 230 55 | 105 25 |
| (Jy bm-1 km s-1) | 0.044 0.010 | 0.042 0.006 | 0.039 0.014 | 0.019 0.008 |
| (K km s-1 pc2) | 1.2 0.3 1010 | 1.1 0.2 1010 | 1.0 0.4 1010 | 0.5 0.2 1010 |
Note. — The velocity of the CO peak emission, vCO, is given with respect to the CO(1-0) redshift of region B, i.e. = 2.3116. FWHMCO is the full width at half the maximum intensity of the CO(1-0) profile. Both vCO and FWHMCO were derived by fitting a Gaussian function to the CO line profile taken at the location of the peak of the CO(1-0) emission. The errors in vCO and FWHMCO reflect the errors in the fitting procedure. is the CO(1-0) total intensity, which we derived by integrating the CO(1-0) emission from Fig. 1 (left) and subsequently correcting this value to reflect the true velocity range that the CO(1-0) emission spans at zero velocity. For the latter, we derive a scaling factor by taking the integrated CO(1-0) intensity of the emission-line profile taken at the location of the peak of the CO emission and dividing this by the CO peak intensity from Fig. 1 (left). Because Fig. 1 (left) shows the integrated CO intensity across 4 channels (120 km s-1), this correction factor is larger in regions with larger FWHMCO, and ranges from 1.1 in region D to 1.9 in region C. is the CO(1-0) luminosity, derived following Solomon & Vanden Bout (2005). For and , the errors consist of three different errors added in quadrature, namely the error in determining the total intensity CO emission from Fig. 1, the error in fitting the emission-line profile against the CO peak, and a statistical error due to the noise in the spectrum (Eqn. 2 of Emonts et al. 2014, see also Sage 1990).
3.1 CO(1-0) in the individual regions
3.1.1 The central group (B)
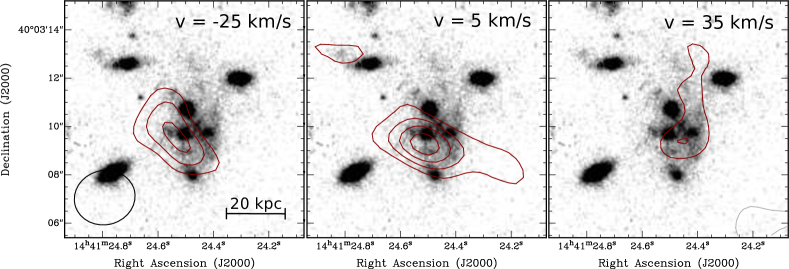
The center of the MAMMOTH-I Nebula was classified by Cai et al. (2017b) as ‘source B’.111The exact coordinates of source B have been verified as RA = 14h41m24.456s and dec = +40∘03′09.45′′ (Arrigoni Battaia et al. 2018b; see also Cai et al. 2017a). We adopt their terminology, and associate region B with the central group of galaxies, which is surrounded by diffuse light in the HST imaging. The CO emission in region B shows a full width at half the maximum intensity of only FWHMCO 85 km s-1 and is observed across 4 channels (120 km s-1) in Fig. 2. This is much narrower than the typical rotational velocity of high- galaxies (e.g., Ueda et al., 2014; Calistro Rivera et al., 2018). As can be seen in detail in Fig. 3, the peak of the CO emission associated with region B appears to be offset by 5 kpc with respect to the stellar body of the central galaxies in the HST image. Interestingly, this molecular gas is co-spatial with diffuse light seen in the HST image. Furthermore, the CO emission extends across a region of 30 kpc, and there is a hint at the 3 level that some of the emission stretches even further north (see the last panel of Fig. 2).
The unusually narrow velocity dispersion indicates that the molecular gas as traced by the CO(1-0) emission in region B is dynamically cold. The bulk of this dynamically cold gas lies just outside the galaxies in region B. It is a reasonable assumption that this dynamically cold gas has low excitation conditions, making it relatively bright in CO(1-0) compared to the warmer molecular gas that is typically found in high- galaxies using higher- lines of CO(,-). It would be interesting to study high- CO lines in search for molecular gas that is more concentrated on the stellar body of the galaxies in region B. We started an ALMA program in Cycle-6 that will address this issue.
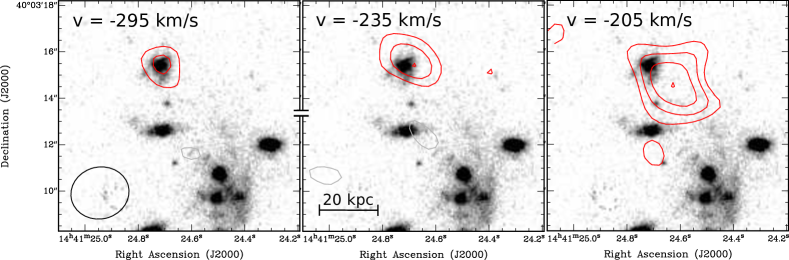
3.1.2 The northern galaxy (A)
About 50 kpc north-east of region B lies a galaxy that is clearly detected in both CO(1-0) and the HST image (Fig. 4). Roughly half of the CO(1-0) emission is associated with the stellar body of the galaxy. The remaining half of the CO emission stretches outside the galaxy in what appears to be a wide tail of gas. The velocity dispersion of the gas remains approximately the same, from FWHMCO 170 km s-1 on top of the galaxy to FWHMCO 190 km s-1 for the extended feature. The extended emission stretches across 25 kpc in the direction of region B, filling an area with very little light detected in the HST image. We argue that the extended feature in region A is likely either gaseous tidal debris, or an outflow.
3.1.3 The faint western galaxy (C)
Roughly 65 kpc west of region B we detect CO(1-0) in a galaxy that is much fainter in the rest-frame optical light than most of the other galaxies in the HST image of Fig. 1. The CO is not significantly extended, and has FWHMCO 230 km s-1.
3.1.4 The southern group (D)
Approximately 100 kpc south-west of region B, a projected group of eight galaxies is visible in the HST image of Fig. 1. Figure 2 reveals tentative indications that CO(1-0) emission is associated with this group of galaxies, and that most of this emission is found between the galaxies. The brightest blob of the CO emission in region D is shown in Fig. 1 and its properties are given in Table 1. Tapering our data does not leave sufficient sensitivity to confirm the presence of more extended CO(1-0) emission in this region. Therefore, additional observations are required to verify and properly image the CO emission in region D.
3.2 CO(1-0) in the CGM
By integrating the CO(1-0) emission across the four regions described in Sect. 3.1, we derive a total CO(1-0) luminosity of 3.8 0.8 1010 K km s-1 pc2 in the MAMMOTH-I Nebula (Solomon & Vanden Bout, 2005). Assuming a typical conversion factor for high- galaxies of MH2/ = 3.6 M⊙ (K km s-1 pc2)-1 (e.g., Daddi et al., 2010; Genzel et al., 2010), this results in a total molecular gas mass of MH2 (1.4 0.3) 1011 M⊙.
A significant fraction of the CO(1-0) emission is found in the CGM between the brightest galaxies in the HST image. We note that we define the CGM as the gaseous medium outside the main stellar body of the galaxies in the HST image. As the CGM typically extends on scales of tens of kpc and the separation between the galaxies in the center of the Ly nebula is comparable to that, we cannot make the distinction between circum-galactic and intra-group medium with the current data, in particular in regions B and D. If we take into consideration the tail-like structure in region A, all of the emission in region B, and tentatively also the faint CO blob in region D, then we estimate 2.2 1010 K km s-1 pc2 for the cold molecular gas in the CGM. This is roughly 50 60 of the total CO(1-0) luminosity of the cold gas in MAMMOTH-I.
We also tapered our CO(1-0) data to a beam-size of 6.4′′ 5.9′′ (53 49 kpc), resulting in an rms sensitivity of 0.1 mJy beam per 30 km s-1 channel. These tapered data did not recover any additional CO(1-0) emission, therefore they provide no evidence for a (diffuse) molecular gas phase that is spread across 50 kpc scales.
4 Discussion
We presented the CO(1-0) properties across the central 150 kpc of the enormous Ly nebula of MAMMOTH-I. In various regions within the nebula, the CO emission extends across several tens of kpc. In this Section, we compare the CO emission in MAMMOTH-I with the properties of the Ly nebula (Sect. 4.1), study the nature of the cold molecular CGM (Sect. 4.2), and evaluate the evolutionary state of MAMMOTH-I (Sect. 4.3).
4.1 Comparison of CO and Ly
In Fig. 5 (top) we compare the CO(1-0) emission with the Ly emission detected in MAMMOTH-I. The distribution of Ly-emitting gas is notably different from the distribution of CO(1-0). In particular, the CO-rich regions A, C, and D are devoid of strong Ly emission. Instead, the brightest patches of Ly emission stretch both NW and S of region B, in areas where we find no evidence for extended CO. Extended C IV also coincides with the brightest part of the Ly nebula (Li et al. in prep.).
In region B, the CO(1-0) emission appears to be offset from the peak of the Ly emission by 10 kpc (1.2′′). The Ly peak was aligned with the position of source B from Cai et al. (2017a) and Arrigoni Battaia et al. (2018b) (see Sect. 3.1.1). This means that there is some uncertainty in the absolute astrometry of the KCWI data.
Figure 5 (bottom) compares the kinematics of the CO(1-0) and Ly emission in region B. Ly is a resonant line, hence scattering effects, combined with geometry and absorption by neutral hydrogen, can create asymmetric and even redshifted profiles that may not reflect the true internal kinematics of the Ly-emitting gas (e.g. Villar-Martin et al., 1996; Stark et al., 2017; Smith et al., 2019). Nevertheless, the Ly emission in region B covers roughly 2000 km s-1, while the CO(1-0) profiles shows a FWHM of only 85 km s-1. This huge difference in velocity dispersion indicates that the cold molecular gas detected in CO(1-0) is not simply mixed with the warmer Ly-emitting gas into a single multi-phase medium. Instead, the CO emission in region B likely traces a region where cold molecular gas either formed in-situ or had time to settle within the Ly nebula, as we will discuss in the next Section.
4.2 Nature of the cold CGM
In regions A and C, the CO(1-0) is associated with a galaxy. However, the CO(1-0) emission in region B, which we assume is the core of the Ly nebula, has a very narrow velocity dispersion (FWHMCO = 85 km s-1). Moreover, this emission is offset from the main stellar body of the galaxies in the center of the nebula. Models show that the CGM in massive galaxies evolves through a complex interplay of different physical processes, including metal-enrichment, outflows, mixing, gas cooling, gas accretion, and mass transfer through galaxy interactions and mergers (e.g. Mori & Umemura, 2006; Narayanan et al., 2015; Faucher-Giguère et al., 2016; Anglés-Alcázar et al., 2017). In the following, we discuss that a multitude of these processes must occur in the core of MAMMOTH-I.
Enrichment
The presence of extended emission of both CO (Fig. 3) and C IV (Li et al. in prep.) in region B indicates that widespread enrichment occurs in the MAMMOTH-I Nebula. At first glance, this does not corroborate accretion models where cold streams of relatively pristine gas directly feed massive galaxies (e.g., Dekel et al., 2009). However, Cornuault et al. (2018) show that these streams become multi-phase and turbulent as the gas cools, and eventually mix with the ambient halo gas. It is likely that metals are deposited into this environment by winds from the galaxies or AGN in the center, or by stellar winds from stars that formed in-situ within the low gravitational potential of the CGM. This can lead to the gradual build-up of carbon, oxygen and dust (e.g. Narayanan et al., 2015). In region B of MAMMOTH-I, which is close to the central AGN and starburst (Arrigoni Battaia et al., 2018b), the metals and dust with which the environment is enriched serve as a catalyst for the formation of CO.
Gas cooling
With enriched ambient material present in the MAMMOTH-I Nebula, it is likely that cooling processes in the core contribute to the formation of cold molecular gas. Models show that when 10 , cold gas clouds may continuously condense out of the galaxy’s hot atmosphere, rain down on the galaxy, trigger widespread star-formation, and feed the black hole (Voit et al., 2015; Li et al., 2015). If this process occurs in MAMMOTH-I, it is likely confined to the inner region where we see the CO emission. The reason is that we do not find evidence for the presence of CO across the larger halo environment (Sect. 3.2). Moreover, the CO in region B shows velocities that are much lower than the typical velocity of clouds that form in the halo and then fall into the center, where presumably they would mix with the ambient gas to create chaotic gas motions.
Perhaps the AGN in MAMMOTH-I is an important element in cooling the CGM in the core, reminiscent of recent ALMA observations of gas cooling in brightest cluster galaxies (BCGs) at low redshifts (Russell et al., 2016, 2017; Temi et al., 2018; Olivares et al., 2019). In these low- studies, ALMA resolved filaments of cold molecular gas with a velocity gradient and dispersion well below the velocity dispersion of the stars in the region, reaching values similar to what we observe for the CO kinematics in region B. These ALMA studies of low- BCGs, when compared with X-ray observations, also showed that the molecular gas likely originates from gas cooling in the updraft behind bubbles created by a radio-loud AGN, which buoyantly rise through the cluster atmosphere (Russell et al., 2016, 2017; Temi et al., 2018). As we will discuss in Sect. 4.3, studies of the radio-loud Spiderweb Galaxy showed that such a scenario of AGN-driven cooling appears to be viable at high redhifts (Gullberg et al., 2016; Emonts et al., 2016, see also models by Li, & Bryan 2014; McNamara et al. 2016). However, while MAMMOTH-I contains an obscured powerful AGN (Arrigoni Battaia et al., 2018b), currently there is no active radio jet detected. Given that gaseous structures with the observed low velocity dispersion would be transient on the time-scales of radio-AGN activity (107 yr), additional mechanisms, such as magnetic fields, would likely be needed to prevent the cold gas from dispersing (see Russell et al., 2016). Alternatively, for low- BCGs, galaxy interactions can cause entropy fluctuations in the hot gas that induce gas cooling (Olivares et al., 2019; Vantyghem et al., 2019). This can result in narrow filaments of molecular gas, or even star formation, also in the absence of a radio-loud AGN (Bayer-Kim et al., 2002; Vantyghem et al., 2019). If similar processes occur at 2, then the dense group of galaxies that are offset from the peak of the narrow CO(1-0) emission in region B could potentially induce gas cooling in the core. The ELAN of MAMMOTH-I would be a prime candidate for this process to occur, but further investigation is needed.
Gaseous debris from galaxy interactions
The molecular gas in region B could have been stripped from one or more galaxies through gravitational effects or ram-pressure stripping. The CO(1-0) that we observe in region B amounts to a molecular gas reservoir equivalent to that associated with the galaxy and tail-like feature in region A. However, since molecular gas is typically concentrated well within the stellar disc (e.g. Ueda et al., 2014; Calistro Rivera et al., 2018), it is curious that we do not detect CO(1-0) emission that is clearly co-spatial with any of the galaxies detected with HST in region B. Of course, it is possible that the host galaxy itself was disrupted entirely, but such a violent event would result in gas kinematics that are much more extreme than what we observe in region B. It is more likely that the dynamically cold gas detected in region B has low excitation conditions, and is thus relatively bright in CO(1-0) compared to warmer molecular gas that may be associated with the galaxies (see Sect. 3.1.1).
If galaxy interactions are an important factor in depositing gas in the CGM, the tidal debris must therefore have had enough time to settle and cool down in the core of the Ly nebula. The time needed for the molecular gas to settle down after a violent disruption event and obtain the observed narrow velocity dispersion must at least be a dynamical timescale of = R/v 108 yr, assuming R 20 kpc the distance over which the molecular gas is distributed and v 200 km s-1 the initial velocity of the gas. We note that once the gas settled into the observed narrow velocity dispersion, there may no longer be clear ways to discern the gaseous remnants of such a tidal disruption event from molecular gas that formed as a result of local gas cooling.
A way to test this scenario comes from the observation that in region B the CO(1-0) appears to follow the diffuse HST light. This could be analogue to the diffuse HST light seen across the molecular CGM of the Spiderweb Galaxy, where multi-color HST imaging revealed that the light originates from young stars that formed in-situ in the CGM (Hatch et al., 2008). It would be interesting to obtain multi-filter HST observations also for MAMMOTH-I, to verify whether the diffuse light in the CGM represents young and blue stars formed in-situ after the gas settled and cooled down, rather than old and red tidal material from one or more recently disrupted galaxies.
We conclude that, while some of the CO emission in the ELAN of MAMMOTH-I is clearly associated with individual galaxies, there is also a large amount of molecular gas in the CGM that likely experienced a variety of physical processes, including local cooling. In region B, the molecular gas is dynamically cold, as shown by the narrow velocity dispersion. We therefore argue that the narrow CO(1-0) line in region B traces the systemic redshift of MAMMOTH-I at = 2.3116 0.0004, and that the location of the CO emission, rather than the AGN, represents the core of the potential well, and thus the true center of MAMMOTH-I.
4.3 Evolution: an early-stage Spiderweb?
Another enormous Ly nebula in which widespread molecular gas has been detected is the radio-loud Spiderweb Galaxy at =2.2 (Emonts et al. 2016, 2018a; see Sect. 1). MAMMOTH-I and the Spiderweb are both located in a rich proto-cluster environment at 2. The CO(1-0) in region B of MAMMOTH-I appears to follow diffuse light in the restframe optical HST image. Although we lack any color-information for the HST imaging of MAMMOTH-I, this appears very similar to the CO distribution in the Spiderweb Galaxy, which follows diffuse blue light from stars that formed in-situ within the CGM (Hatch et al., 2008).
However, there are also differences between MAMMOTH-I and the Spiderweb Galaxy. While both MAMMOTH-I and the Spiderweb Galaxy contain an obscured AGN (Carilli et al., 1997; Arrigoni Battaia et al., 2018b), the Spiderweb Galaxy host a powerful radio source, but MAMMOTH-I is radio-quiet. It is not detected in the VLA FIRST (Faint Images of the Radio Sky at Twenty-Centimeters) survey down to a 3 limit of 0.42 mJy beam-1, which corresponds to 1.4 1024 W Hz-1. In the Spiderweb Galaxy, both H2O and enhanced CO(1-0) emission are found along the radio jet, indicating that energy injected into the CGM by the propagating radio jet can cause local thermal instability that leads to gas cooling (Gullberg et al., 2016; Emonts et al., 2016, see also models by Li, & Bryan 2014). This process is currently absent in MAMMOTH-I, but given that an AGN is expected to be radio-loud 10 of the time, a phase of more rapid gas cooling could occur during subsequent episodes in the evolution of MAMMOTH-I. In addition, compared to what we observe in MAMMOTH-I, in the Spiderweb nebula the diffuse light appears to be more widespread (Hatch et al., 2008) and the concentration of galaxies is denser (Miley et al., 2006). Also, the CO within the ELAN of MAMMOTH-I is partially associated with individual galaxies (regions A and C), while in the Spiderweb Galaxy the cold molecular gas is more settled into a single large gas reservoir in the CGM, which has a significantly lower velocity dispersion than the galaxies (Emonts et al., 2016).
The above similarities and differences raise the intriguing possibility that MAMMOTH-I is a system much like the Spiderweb Galaxy, but in an earlier stage of evolution.
5 Conclusions
We used the VLA in its most compact D-configuration to trace CO(1-0) emission of cold molecular gas in the Enormous Ly Nebula of MAMMOTH-I ( = 2.3). We detected CO in four regions that are associated with either galaxies or groups of galaxies that occupy the inner 150 kpc of the nebula. We derive the following main conclusions:
The total mass of molecular gas that we detect in MAMMOTH-I is MH2 = 1.4 (/3.6) 1011 M⊙.
Roughly 50 of the CO emission is found at various places in the CGM, stretching across scales of up to 30 kpc. The other 50 of the CO is associated with the main stellar body of two galaxies, one which shows a wide gaseous tidal-tail or outflow, the other one is very faint in the optical rest-frame.
In the center, the CO(1-0) in the CGM has an unusually narrow velocity dispersion (FWHM 85 km s-1) and follows diffuse light seen in HST imaging. This is dynamically cold gas that likely originated from the cooling of an enriched multi-phase medium in the core of the potential well of MAMMOTH-I.
In Sect. 4.3 we speculated that the CO-rich Ly Nebula of MAMMOTH-I bears a resemblance to the enigmatic Spiderweb Galaxy, but perhaps represents an earlier stage in evolution. To trace the molecular CGM on large scales around high- massive galaxies and proto-clusters requires sensitive low-surface-brightness observations using very compact millimeter interferometers (Emonts et al., 2018b). The number of observations that have reached the surface-brightness levels needed to detect very extended CO emission is still limited. Dedicated millimeter observations in search for widespread molecular gas in the CGM of other Enormous Ly Nebulae may better reveal how these massive structures evolve into the most massive cluster galaxies in the Universe.
References
- Anglés-Alcázar et al. (2017) Anglés-Alcázar D., et al., 2017, MNRAS, 470, 4698
- Arrigoni Battaia et al. (2015) Arrigoni Battaia, F., Hennawi, J. F., Prochaska, J. X., & Cantalupo, S. 2015, ApJ, 809, 163
- Arrigoni Battaia et al. (2018a) Arrigoni Battaia, F., Prochaska, J. X., Hennawi, J. F., et al. 2018a, MNRAS, 473, 3907
- Arrigoni Battaia et al. (2018b) Arrigoni Battaia, F., Chen, C.-C., Fumagalli, M., et al. 2018b, AA, 620, A202
- Arrigoni Battaia et al. (2019) Arrigoni Battaia, F., Hennawi, J. F., Prochaska, J. X., et al. 2019, MNRAS, 482, 3162
- Bayer-Kim et al. (2002) Bayer-Kim, C. M., Crawford, C. S., Allen, S. W., Edge, A. C., & Fabian, A. C. 2002, MNRAS, 337, 938
- Bergeron et al. (1999) Bergeron, J., Petitjean, P., Cristiani, S., et al. 1999, AA, 343, L40
- Bisbas et al. (2017) Bisbas, T. G., van Dishoeck, E. F., Papadopoulos, P. P., et al. 2017, ApJ, 839, 90
- Borisova et al. (2016) Borisova, E., Cantalupo, S., Lilly, S. J., et al. 2016, ApJ, 831, 39
- Cai et al. (2019) Cai, Z., Cantalupo, S., Prochaska, J. X., et al. 2019, ApJS in press. (arXiv:1909.11098)
- Cai et al. (2017a) Cai, Z., Fan, X., Bian, F., et al. 2017a, ApJ, 839, 131
- Cai et al. (2017b) Cai, Z., Fan, X., Yang, Y., et al. 2017b, ApJ, 837, 71
- Cai et al. (2018) Cai, Z., Hamden, E., Matuszewski, M., et al. 2018, ApJL, 861, L3
- Calistro Rivera et al. (2018) Calistro Rivera, G., Hodge, J. A., Smail, I., et al. 2018, ApJ, 863, 56
- Cantalupo et al. (2005) Cantalupo, S., Porciani, C., Lilly, S. J., & Miniati, F. 2005, ApJ, 628, 61
- Cantalupo et al. (2014) Cantalupo, S., Arrigoni-Battaia, F., Prochaska, J. X., Hennawi, J. F., & Madau, P. 2014, Nature, 506, 63
- Cantalupo (2017) Cantalupo, S. 2017, Gas Accretion onto Galaxies, Astrophysics and Space Science Library, 430, 195
- Cantalupo et al. (2019) Cantalupo, S., Pezzulli, G., Lilly, S. J., et al. 2019, MNRAS, 483, 5188
- Carilli et al. (1997) Carilli, C. L., Röttgering, H. J. A., van Ojik, R., Miley, G. K., & van Breugel, W. J. M. 1997, ApJS, 109, 1
- Carilli, & Walter (2013) Carilli, C. L., & Walter, F. 2013, ARAA, 51, 105
- Cicone et al. (2015) Cicone, C., Maiolino, R., Gallerani, S., et al. 2015, AA, 574, A14
- Cornuault et al. (2018) Cornuault, N., Lehnert, M. D., Boulanger, F., & Guillard, P. 2018, AA, 610, A75
- Daddi et al. (2010) Daddi, E., Bournaud, F., Walter, F., et al. 2010, ApJ, 713, 686
- Dannerbauer et al. (2014) Dannerbauer, H., Kurk, J. D., De Breuck, C., et al. 2014, AA, 570, A55
- Dannerbauer et al. (2017) Dannerbauer, H., Lehnert, M. D., Emonts, B., et al. 2017, AA, 608, A48
- Dekel et al. (2009) Dekel, A., Birnboim, Y., Engel, G., et al. 2009, Nature, 457, 451
- Dijkstra & Loeb (2009a) Dijkstra, M., & Loeb, A. 2009a, MNRAS, 396, 377
- Dijkstra & Loeb (2009b) Dijkstra, M., & Loeb, A. 2009b, MNRAS, 400, 1109
- Djorgovski et al. (1987) Djorgovski, S., Strauss, M. A., Perley, R. A., Spinrad, H., & McCarthy, P. 1987, AJ, 93, 1318
- Eales et al. (1993) Eales, S. A., Rawlings, S., Dickinson, M., et al. 1993, ApJ, 409, 578
- Emonts et al. (2014) Emonts, B. H. C., Norris, R. P., Feain, I., et al. 2014, MNRAS, 438, 2898
- Emonts et al. (2015) Emonts, B. H. C., Mao, M. Y., Stroe, A., et al. 2015, MNRAS, 451, 1025
- Emonts et al. (2016) Emonts, B. H. C., Lehnert, M. D., Villar-Martín, M., et al. 2016, Science, 354, 1128
- Emonts et al. (2018a) Emonts, B. H. C., Lehnert, M. D., Dannerbauer, H., et al. 2018a, MNRAS, 477, L60
- Emonts et al. (2018b) Emonts, B., Carilli, C., Narayanan, D., Lehnert, M., & Nyland, K. 2018b, Science with a Next Generation Very Large Array , ASP Conference Series 517, 587
- Fardal et al. (2001) Fardal, M. A., Katz, N., Gardner, J. P., et al. 2001, ApJ, 562, 605
- Faucher-Giguère et al. (2010) Faucher-Giguère, C.-A., Kereš, D., Dijkstra, M., Hernquist, L., & Zaldarriaga, M. 2010, ApJ, 725, 633
- Faucher-Giguère et al. (2016) Faucher-Giguère, C.-A., Feldmann, R., Quataert, E., et al. 2016, MNRAS, 461, L32
- Frayer et al. (2018) Frayer, D. T., Maddalena, R. J., Ivison, R. J., et al. 2018, ApJ, 860, 87
- Fujimoto et al. (2019) Fujimoto, S., Ouchi, M., Ferrara, A., et al. 2019, ApJ in press. (arXiv:1902.06760)
- Gaia Collaboration et al. (2016) Gaia Collaboration, Prusti, T., de Bruijne, J. H. J., et al. 2016, AA, 595, A1
- Gaia Collaboration et al. (2018) Gaia Collaboration, Brown, A. G. A., Vallenari, A., et al. 2018, AA, 616, A1
- Geach et al. (2009) Geach, J. E., Alexander, D. M., Lehmer, B. D., et al. 2009, ApJ, 700, 1
- Geach et al. (2014) Geach, J. E., Bower, R. G., Alexander, D. M., et al. 2014, ApJ, 793, 22
- Geach et al. (2016) Geach, J. E., Narayanan, D., Matsuda, Y., et al. 2016, ApJ, 832, 37
- Genzel et al. (2010) Genzel, R., Tacconi, L. J., Gracia-Carpio, J., et al. 2010, MNRAS, 407, 2091
- Ginolfi et al. (2017) Ginolfi, M., Maiolino, R., Nagao, T., et al. 2017, MNRAS, 468, 3468
- Gould & Weinberg (1996) Gould, A., & Weinberg, D. H. 1996, ApJ, 468, 462
- Guillard et al. (2012) Guillard, P., Boulanger, F., Pineau des Forêts, G., et al. 2012, ApJ, 749, 158
- Gullberg et al. (2016) Gullberg, B., De Breuck, C., Lehnert, M. D., et al. 2016, AA, 586, A124
- Hatch et al. (2008) Hatch, N. A., Overzier, R. A., Röttgering, H. J. A., Kurk, J. D., & Miley, G. K. 2008, MNRAS, 383, 931
- Hatch et al. (2009) Hatch, N. A., Overzier, R. A., Kurk, J. D., et al. 2009, MNRAS, 395, 114
- Hayes et al. (2011) Hayes, M., Scarlata, C., & Siana, B. 2011, Nature, 476, 304
- Heckman et al. (1991) Heckman, T. M., Lehnert, M. D., Miley, G. K., & van Breugel, W. 1991, ApJ, 381, 373
- Hennawi et al. (2006) Hennawi, J. F., Prochaska, J. X., Burles, S., et al. 2006, ApJ, 651, 61
- Hennawi & Prochaska (2007) Hennawi, J. F., & Prochaska, J. X. 2007, ApJ, 655, 735
- Hennawi & Prochaska (2013) Hennawi, J. F., & Prochaska, J. X. 2013, ApJ, 766, 58
- Hennawi et al. (2015) Hennawi, J. F., Prochaska, J. X., Cantalupo, S., & Arrigoni-Battaia, F. 2015, Science, 348, 779
- Ivison et al. (2011) Ivison, R. J., Papadopoulos, P. P., Smail, I., et al. 2011, MNRAS, 412, 1913
- Kodama et al. (2007) Kodama, T., Tanaka, I., Kajisawa, M., et al. 2007, MNRAS, 377, 1717
- Kollmeier et al. (2010) Kollmeier, J. A., Zheng, Z., Davé, R., et al. 2010, ApJ, 708, 1048
- Kuiper et al. (2011) Kuiper, E., Hatch, N. A., Miley, G. K., et al. 2011, MNRAS, 415, 2245
- Kurk et al. (2004) Kurk, J. D., Pentericci, L., Overzier, R. A., Röttgering, H. J. A., & Miley, G. K. 2004, AA, 428, 817
- Lau et al. (2016) Lau, M. W., Prochaska, J. X., & Hennawi, J. F. 2016, ApJS, 226, 25
- Li, & Bryan (2014) Li, Y., & Bryan, G. L. 2014, ApJ, 789, 54
- Li et al. (2015) Li, Y., Bryan, G. L., Ruszkowski, M., et al. 2015, ApJ, 811, 73
- Martin et al. (2014) Martin, D. C., Chang, D., Matuszewski, M., et al. 2014, ApJ, 786, 106
- Martin et al. (2015) Martin, D. C., Matuszewski, M., Morrissey, P., et al. 2015, Nature, 524, 192
- McCarthy et al. (1995) McCarthy, P. J., Spinrad, H., & van Breugel, W. 1995, ApJS, 99, 27
- McCarthy et al. (1990) McCarthy, P. J., Spinrad, H., van Breugel, W., et al. 1990, ApJ, 365, 487
- McCarthy et al. (1987) McCarthy, P. J., Spinrad, H., Djorgovski, S., et al. 1987, ApJL, 319, L39
- McMullin et al. (2007) McMullin, J. P., Waters, B., Schiebel, D., et al. 2007, ASP Conference Series, 376, 127
- McNamara et al. (2016) McNamara, B. R., Russell, H. R., Nulsen, P. E. J., et al. 2016, ApJ, 830, 79
- Miley et al. (2006) Miley, G. K., Overzier, R. A., Zirm, A. W., et al. 2006, ApJL, 650, L29
- Miley & De Breuck (2008) Miley, G., & De Breuck, C. 2008, AARv, 15, 67
- Mori & Umemura (2006) Mori, M., Umemura, M. 2006, Nature, 440, 644
- Mukae et al. (2019) Mukae, S., Ouchi, M., Cai, Z., et al. 2019, arXiv e-prints, arXiv:1910.02962
- Narayanan et al. (2015) Narayanan, D., Turk, M., Feldmann, R., et al. 2015, Nature, 525, 496
- Olivares et al. (2019) Olivares, V., Salome, P., Combes, F., et al. 2019, A&A, 631, A22
- Overzier et al. (2013) Overzier, R. A., Nesvadba, N. P. H., Dijkstra, M., et al. 2013, ApJ, 771, 89
- Papadopoulos et al. (2000) Papadopoulos, P. P., Röttgering, H. J. A., van der Werf, P. P., et al. 2000, ApJ, 528, 626
- Papadopoulos et al. (2004) Papadopoulos, P. P., Thi, W.-F., & Viti, S. 2004, MNRAS, 351, 147
- Pentericci et al. (1997) Pentericci, L., Roettgering, H. J. A., Miley, G. K., Carilli, C. L., & McCarthy, P. 1997, AA, 326, 580
- Pentericci et al. (2001) Pentericci, L., McCarthy, P. J., Röttgering, H. J. A., et al. 2001, ApJS, 135, 63
- Prochaska et al. (2014) Prochaska, J. X., Lau, M. W., & Hennawi, J. F. 2014, ApJ, 796, 140
- Prochaska et al. (2013) Prochaska, J. X., Hennawi, J. F., Lee, K.-G., et al. 2013, ApJ, 776, 136
- Reuland et al. (2007) Reuland, M., van Breugel, W., de Vries, W., et al. 2007, AJ, 133, 2607
- Reuland et al. (2003) Reuland, M., van Breugel, W., Röttgering, H., et al. 2003, ApJ, 592, 755
- Rosdahl & Blaizot (2012) Rosdahl, J., & Blaizot, J. 2012, MNRAS, 423, 344
- Stark et al. (2017) Stark, D. P., Ellis, R. S., Charlot, S., et al. 2017, MNRAS, 464, 469
- Russell et al. (2016) Russell, H. R., McNamara, B. R., Fabian, A. C., et al. 2016, MNRAS, 458, 3134
- Russell et al. (2017) Russell, H. R., McDonald, M., McNamara, B. R., et al. 2017, ApJ, 836, 130
- Sage (1990) Sage L. J., 1990, AA, 239, 125
- Smith et al. (2019) Smith, A., Ma, X., Bromm, V., et al. 2019, MNRAS, 484, 39
- Solomon & Vanden Bout (2005) Solomon, P. M., & Vanden Bout, P. A. 2005, ARAA, 43, 677
- Swinbank et al. (2015) Swinbank, A. M., Vernet, J. D. R., Smail, I., et al. 2015, MNRAS, 449, 1298
- Taniguchi & Shioya (2000) Taniguchi, Y., & Shioya, Y. 2000, ApJL, 532, L13
- Taniguchi et al. (2001) Taniguchi, Y., Shioya, Y., & Kakazu, Y. 2001, ApJL, 562, L15
- Temi et al. (2018) Temi, P., Amblard, A., Gitti, M., et al. 2018, ApJ, 858, 17
- Ueda et al. (2014) Ueda, J., Iono, D., Yun, M. S., et al. 2014, ApJS, 214, 1
- van Ojik et al. (1996) van Ojik, R., Roettgering, H. J. A., Carilli, C. L., et al. 1996, AA, 313, 25
- van Ojik et al. (1997) van Ojik, R., Roettgering, H. J. A., Miley, G. K., & Hunstead, R. W. 1997, AA, 317, 358
- Vantyghem et al. (2019) Vantyghem, A. N., McNamara, B. R., Russell, H. R., et al. 2019, ApJ, 870, 57
- Vernet et al. (2017) Vernet, J., Lehnert, M. D., De Breuck, C., et al. 2017, AA, 602, L6
- Villar-Martin et al. (1996) Villar-Martin, M., Binette, L., & Fosbury, R. A. E. 1996, AA, 312, 751
- Villar-Martín et al. (2002) Villar-Martín, M., Vernet, J., di Serego Alighieri, S., et al. 2002, MNRAS, 336, 436
- Villar-Martín et al. (2003) Villar-Martín, M., Vernet, J., di Serego Alighieri, S., et al. 2003, MNRAS, 346, 273
- Villar-Martín et al. (2006) Villar-Martín, M., Sánchez, S. F., De Breuck, C., et al. 2006, MNRAS, 366, L1
- Villar-Martín et al. (2007) Villar-Martín, M., Sánchez, S. F., Humphrey, A., et al. 2007, MNRAS, 378, 416
- Voit et al. (2015) Voit G. M., Donahue M., Bryan G. L., McDonald M., 2015, Nature, 519, 203
- Wilman et al. (2005) Wilman, R. J., Gerssen, J., Bower, R. G., et al. 2005, Nature, 436, 227
- Wright (2006) Wright, E. L. 2006, PASP, 118, 1711
- Yang et al. (2006) Yang, Y., Zabludoff, A. I., Davé, R., et al. 2006, ApJ, 640, 539