Achieving high figure-of-merit in Nb-doped Na0.74CoO2 compound at high temperature region
Abstract
We report the thermoelectric (TE) properties of Na0.74Co0.95Nb0.05O2 in the temperature range K, as a potential candidate for p-type thermoelectric material. The experimental values of Seebeck coefficient (S) are V/K measured in the temperature range K. The positive values of S in the entire temperature range indicates p-type behaviour of the compound. At 300 K the experimental value of thermal conductivity () is 1.88 W/m-K that increases up to 420 K, then decreases till 620 K with corresponding value 1.86 W/m-K. To understand the experimentally observed transport properties, we have calculated S and of this compound. Then, based on theoretical understanding, we have estimated figure-of-merit (ZT) up to 1200 K by using calculated S and values with extrapolated experimental . The value of ZT is found to be 0.03 at 300 K, whereas, the highest value is observed as 1.7 at 1200 K. Finally, we have calculated the efficiency () by keeping the cold end temperature (Tc) fixed at 500 K and varying hot end temperature (Th) from 500 to 1200 K, respectively. The maximum value of is found to be 8 , when Tc and Th are fixed at 500 and 1200 K, respectively. This result suggests that Na0.74Co0.95Nb0.05O2 compound can be used as a p-leg for making high temperature TE generator (TEG).
Key words: Seebeck coefficient, themal conductivity, resistivity, figure-of-merit.
Recently clean energy technologies become the world demand because they are pollution free and also participate in energy problem solution. Today’s world runs on a series of electrical reactions. Various sources of energy such as solar, wind, hydro-power, biomass and thermal energy are used to generate electricity. But due to the poor conversion efficiency of engines, more than 60 of the energy expenditure from different energy sources is directly released to the atmosphere in the form of waste heat.PE ; nF The amount of waste heat is increasing day by day that changes global climate and becoming alarming for environment. Therefore, to fulfill the requirement of electricity without affecting environmental conditions necessitate the discovery of new clean energy sources. The thermoelectric (TE) materials are one of the most promising candidates in clean energy technology and are also expected to play a vital role in future energy systems. TE materials have the capability to convert waste heat into useful electrical energyWE2 through thermoelectric power. But all TE materials are not suitable for commercial applications. The efficiency can express the applicability of any device for commercial applications. For TE materials the efficiency is measured by a dimensionless parameter called the figure-of-merit (ZT)zt1
| (1) |
where, S is Seebeck coefficient, is electrical resistivity, T is absolute temperature and () is thermal conductivity in which electronic () and phononic () parts are involved. For good TE materials the magnitude of ZT should be large. The above expression suggests that to get large magnitude of ZT the value of S should be high and the value of as well as should be low. But the optimization of S, and to get a high value of ZT is a challenging task because they are interrelated with each other.in1 ; in2 However, researchers are working hard to overcome this difficulty for improving the magnitude of ZT.
Till now, the excellent examples of commercially available TE materials are bismuth (and lead) telluride and their alloys having highest ZT of about 1 near room temperature.Be1 ; Be2 But, difficulty arises in high temperature region because they are easily decomposed and oxidised at higher temperature that makes them inapplicable for high temperature applications. Oxides are good candidates for thermoelectric applications due to their comparatively lower cost, non-toxic, simple synthesis procedure and the anti-oxidization in oxidized atmosphere for long time even at elevated temperature.lt2 ; lt3 Relatively, metal oxides such as ZnOzn2 , Ca-Co-Oca2 and NaxCoO2na2 systems have been revealed as an incentive TE materials.
The scientific community is showing considerable interest on NaxCoO2 because of its peculiar properties. NaxCoO2 has attracted much attention due to its remarkable TE power, high ZTrp and the discovery of superconductivity at 5 K in the hydrate sodium cobaltate.sc Further, Na content has a crucial role in TE properties of NaxCoO2. The larger amount of Na doping (x0.7) in NaxCoO2 system gives high thermopower above 75 V/K.19 ; 20 ; 21 ; 22 In the past two decades, many researchers have studied the TE properties of NaxCoO2 in low temperature region (0-300 K).19 ; 23 ; 21 ; 25 ; 26 A combined experimental and theoretical study on TE properties of Na0.74CoO2 compound has been reported by Sk et al.27 in K. They have calculated S values at chemical potential, = 220 meV. Their result suggests the possibility of enhancing the value of S along with electrical conductivity () by doping. Moreover, it has been often observed that doping also decreases the value of .28 Thus, it is expected that through appropriate doping the value of ZT can be increased for Na0.74CoO2 compound. To look for this possibility we have doped 5 of the Niobium (Nb) at Co site.
In this work, we have experimentally studied the TE properties (S, ) of Na0.74Co0.95Nb0.05O2 compound in the temperature range 300 to 620 K. At 300 K the measured value of S is 82 V/K, whereas, the highest value of S is obtained as 121 V/K at 620 K. The observed value of is 1.88 W/m-K at 300 K then increases up to 420 K. After that the values of decrease slowly till 620 K and the lowest value is found to be 1.86 W/m-K at 620 K. In order to understand the experimentally observed transport properties, we have calculated S and of this compound and compared with experiment. Then, we have calculated ZT using experimental S and values with calculated value. At room temperature the observed value of ZT is found to be 0.03, which reaches 0.16 at 620 K. Based on the computational understanding, we have estimated the ZT values up to 1200 K by using calculated S and values with extrapolated experimental values. The highest value of ZT is found to be 1.7 at 1200 K. Finally, we have calculated the temperature dependent efficiency () of Na0.74Co0.95Nb0.05O2 compound. The maximum is observed as 8 , when cold end temperature (Tc) and hot end temperature (Th) are fixed at 500 and 1200 K, respectively. The observed value of indicates that Na0.74Co0.95Nb0.05O2 can be used as a p-type material for making high temperature TEG.
Na0.74Co0.95Nb0.05O2 compound was prepared by the conventional solid state reaction. The more details of synthesis procedure and characterization can be found in Ref.[25]. The measurements of temperature dependent S and were carried out by using home-made experimental setup.30 ; 31 ; 32 The measurements were conducted in the temperature range 300 to 620 K. The sample with pellet form of 8 (0.1) mm diameter and 1 (0.02) mm thickness was used for performing the measurements.
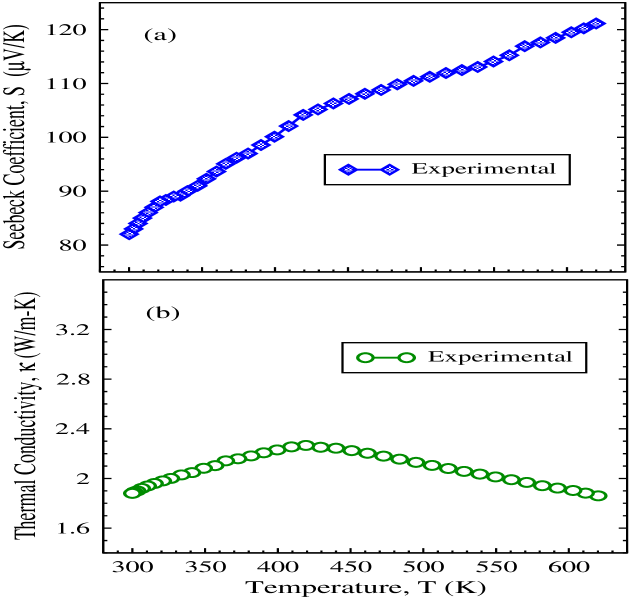
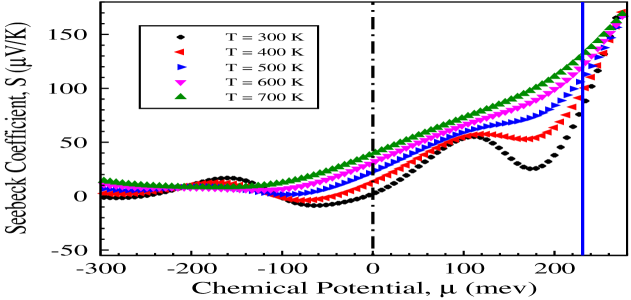
Fig. 1(a) presents the results of experimentally measured temperature dependent S of Na0.74Co0.95Nb0.05O2 compound. The measurement of S was carried out in the temperature range 300 to 620 K. The observed S values are positive throughout the temperature range that indicates p-type conductive transport properties of the compound. At room temperature the measured value of S is 82 V/K, which is greater than the reported S of 64 V/K for parent compound.27 The S vs T plot shows that S increases monotonically with increasing temperature. The highest value of S is obtained as 121 V/K at 620 K and found to be larger than the reported value of S ( 118 V/K) for parent compound. The overall values of S in the entire temperature range are greater than the parent, Na0.74CoO2 compound. ZT of the TE material is dependent on square of S values, therefore observation of increment in the magnitude of S with increasing temperature suggests that this compound can be used for high temperature TE applications.
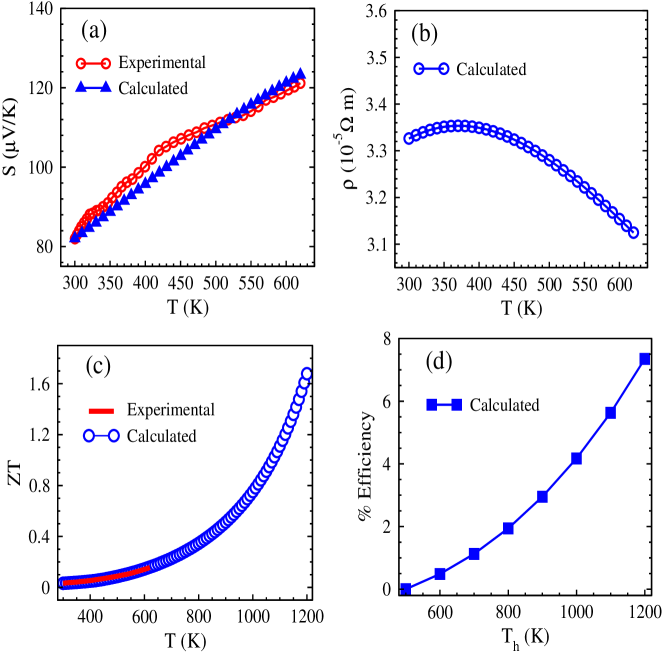
Fig. 1(b) shows the of Na0.74Co0.95Nb0.05O2 compound as a function of temperature. The measurement was conducted from room temperature to 620 K. At 300 K the observed value of is 1.88 W/m-K. This value of is small in comparison to the value ( 2.2 W/m-K) reported for parent compound.27 With increasing temperature the value increases up to 420 K then decreases till the highest temperature studied. At 620 K the observed value of is found to be 1.86 W/m-K, which is smaller than the reported value of ( 2.4 W/m-K) measured for parent compound. In comparison with parent compound the values are lower in the entire temperature range. The lower values of under the temperature range is a good signature for efficient TE materials. The lower value of helps in getting higher value of ZT and for good TE materials that is one of the most crucial requirement.
In order to understand the experimentally observed transport properties, we have calculated S and with the help of calculations for parent compound Na0.74CoO2 reported earlier. 27 In that work S was calculated by varying at different temperatures. Here, we have shown S vs plot in Fig. 2, where, is taken in the range -300 to 280 meV and the temperatures are varying from 300 to 700 K. We found that at = 231 meV, the calculated value of S is 82 V/K at 300 K, which gives good match with our experimentally observed value of 82 V/K for Na0.74Co0.95Nb0.05O2. At = 231 meV, we have calculated S using two current model33 ; 35 ; 36 in the temperature range K as shown in Fig. 3(a). From the figure it is clearly seen that calculated values of S are giving good match with experiment in the entire temperature region. The same value of is used for rest of the calculations in this work.
Temperature dependent is also calculated using two current modelRho for Na0.74Co0.95Nb0.05O2 compound. Fig. 3(b) presents the calculated as a function of temperature. To calculate the value of , we have used the same value of relaxation time, = 0.710-14 s as used for parent compound.27 At room temperature the value of is 3.3310-5 m. As the temperature increases the value of increases up to 370 K then decreases till the highest studied temperature. The value of is obtained as 3.1210-5 m at 620 K.
To see the applicability of Na0.74Co0.95Nb0.05O2 compound for TE applications, we have calculated the ZT values in temperature region K as shown in Fig. 3(c). To calculate the ZT values, experimental S and values with calculated value were used. The ZT vs T plot shows that ZT values increase with increasing temperature. At 300 K the observed value of ZT is found to be 0.03 that is larger than the ZT value ( 0.02) of parent compound.27 With increasing temperature the ZT value reaches 0.16 at 620 K. At 620 K the observed value is greater than the reported value ( 0.13) of parent compound. The overall values of ZT in the entire temperature range is greater than the parent compound. This increasing nature of ZT with temperature suggests to see the ZT value at higher temperature region where performing the experiment is not accessible in the present study.
On the basis of computational understanding, we have estimated the ZT values up to 1200 K for Na0.74Co0.95Nb0.05O2 as displayed in Fig. 3(c). Here, ZT is calculated by taking calculated values of S and with extrapolated experimental values. The value of ZT at 300 is found to be 0.03, whereas, it reaches 1.7 at 1200 K. From the figure it is clear that ZT values are increasing with increasing temperature. The values of ZT at higher temperature region are larger than the ZT value of commercially used materials at low temperature.Be1 ; Be2 It is important to note that the values of ZT at higher temperature region are calculated by using extrapolated experimental values and constant value which is caculated at 300 K. But, is temperature dependent37 quantity. Therefore, by considering the proper values of temperature dependent and at high temperature region, we believe that one may still get ZT value 1 at 1200 K. This result suggests that Na0.74Co0.95Nb0.05O2 compound can be used for high temperature TE applications.
Finally, we have calculated of Na0.74Co0.95Nb0.05O2 compound as shown in Fig. 3(d). As we know, for making TEG both p and n-type materials are required. Our compound is p-type that is indicated by the positive values of S throughout the temperature range. In order to check the efficacy of this compound, we have calculated at higher temperature region by using the segmentation method.27 ; 38 If we observe Fig. 3(c), ZT values are less in low temperature region. Therefore, we have chosen the cold end temperature as 500 K to calculate by varying hot end temperature from 500 to 1200 K. The maximum is observed as 8 when Tc and Th are fixed at 500 and 1200 K, respectively. The calculated value of suggests that this compound can be used as a p-type material for making high temperature TEG.
In conclusion, we have experimentally measured temperature dependent TE properties (S and ) of Na0.74Co0.95Nb0.05O2 compound in the temperature range 300 to 620 K. The observed value of S at 300 K is 82 V/K and at 620 K the value is found to be 121 V/K . The values of S in the entire temperature range are positive that indicates p-type conductive transport properties of the compound. At room temperature the observed value of is 1.88 W/m-K that increases up to 420 K then decreases till highest temperature studied. The lowest value of is found to be 1.86 W/m-K at 620 K. The low values of under the temperature range help in getting higher value of ZT. To understand the experimentally observed transport properties, we have calculated S and of this compound. By taking experimental S and values with calculated value we have calculated ZT. The highest value of ZT is found to be 0.16 at 620 K. Then, we have estimated the ZT values up to 1200 K on the basis of theoretical understanding. For this we have used calculated S and values with extrapolated experimental values. At 300 K the value of ZT is 0.03, which reaches 1.7 at 1200 K. Finally, we have calculated of Na0.74Co0.95Nb0.05O2 by fixing Tc at 500 K and varying Th from 500 to 1200 K. The maximum value of is observed as 8 , when Tc and Th are fixed at 500 and 1200 K, respectively. The value of indicates that Na0.74Co0.95Nb0.05O2 compound can be used as a p-leg for making TEG at high temperature region.
References
- (1) T. Schepetina, Energy: Econ., Eng. Ecol. 12, 21 (2010).
- (2) L. E. Doman and V. Arora, 2016 International Energy Outlook 2016 DOE/EIA-0484(2016) US Energy Information Administration
- (3) Y. Pei, H. Wang and G.J. Snyder, Adv. Mater. 24, 6125 (2012).
- (4) Y. Pei, X. Shi, A. LaLonde, H. Wang, L. Chen and G. J. Snyder, Nature 473, 66 (2011).
- (5) S. Sk, P. Devi, S. Singh, and S. K. Pandey, Mater. Res. Express 6, 026302 (2018).
- (6) N. W. Ashcroft and N. D. Mermin, Solid State Physics, vol. 239, ed. D.G. Crane, Saunders College Publishing, New York, (1976).
- (7) O. Yamashita, S. Tomiyoshi and K. Makita, J. Appl. Phys. 93, 368 (2003).
- (8) K. Biswas, J. Q. He, I. D. Blum, C. I. Wu, T. P. Hogan, D. N. Seidman, V. P. Dravid and M. G. Kanatzidis, Nature 489, 414 (2012).
- (9) K. Koumoto, I. Terasaki and R. Funahashi, MRS Bull 31, 206 (2006).
- (10) J. W. Fergus, J. Eur. Ceram. Soc. 32, 525 (2012).
- (11) K. Park and K. Y. Ko, J. Alloys Compd. 430, 200 (2007).
- (12) Y. Wang, Y. Sui, J. Cheng, X. Wang, J. Miao, Z. Liu, Z. Qian and W. Su, J. Alloys Compd. 448, 1 (2008).
- (13) M. Ito, T. Nagira, Y. Oda, S. Katsuyama, K. Majima and H. Nagi, Mater. Trans. 46 , 601 (2002).
- (14) K. Fujita, T. Mochida and K. Nakamura, Jpn. J. Appl. Phys. 40 , 4644 (2001).
- (15) K. Takada, H. Sakurai, E. Takayama-Muromachi, F. Izumi, R. A. Dilanian and T. Sasaki, Nature 422, 53 (2003).
- (16) I. Terasaki, Y. Sasago and K. Uchinokura, Phys. Rev. B 56, R12685 (1997).
- (17) M. M. Mallick and S. Vitta, J. Electron. Mater. 47(6), 3230 (2018).
- (18) N. Kaurav, K. K. Wu, Y. K. Kuo, G. J. Shu and F. C. Chou, Phys. Rev. B 79, 075105 (2009).
- (19) M. Lee, L. Viciu, L. Li, Y. Wang, M. L. FOO, S. Watauchi, R. A. Pascal JR, R. J. Cava and N. P. Ong, Nat. Mater. 5 , 537 (2006).
- (20) T. Kawata, Y. Iguchi, T. Itoh, K. Takahata, and I. Terasaki, Phys. Rev. B 60, 10584 (1999).
- (21) D. J. Singh, Phys. Rev. B 61, 13397 (2000).
- (22) F. Rivadulla, J. S. Zhou, and J. B. Goodenough, Phys. Rev. B 68, 075108 (2003).
- (23) S. Sk, J. Pati, R. S. Dhaka and S. K. Pandey, arXiv:1910.10191
- (24) L. Wang, M. Wang and D. Zhao, J. Alloys Compd. 471, 519 (2009).
- (25) J. Pati, M. Chandra and R. S. Dhaka, arXiv:1910.08788
- (26) A. Patel and S. K. Pandey, Instrum. Sci. Technol. 45(4), 366 (2017).
- (27) A. Patel and S. K. Pandey, Rev. Sci. Instrum. 88, 015107 (2017).
- (28) A. Patel and S. K. Pandey, Instrum. Sci. Technol. 46(6), 600 (2018).
- (29) H. J. Xiang and D. J. Singh, Phys. Rev. B 76, 195–111 (2007).
- (30) S. Sharma and S. K. Pandey, Phys. Lett. A 379, 2357 (2015).
- (31) S. Singh, D. Kumar and S. K. Pandey, J. Phys. Condens. Matter 29, 105601 (2017).
- (32) J. W. F. Dorleijn, Philips Res. Rep. 31, 287 (1976).
- (33) S. Ahmad and S. D. Mahanti, Energy and temperature dependence of relaxation time and Wiedemann-Franz law on PbTe, Phys. Rev. B 81, 165203 (2010).
- (34) K. Gaurav and S. K. Pandey, J. Renew. Sustain. Energy 9, 014701 (2017).