AT 2018cow VLBI: No Long-Lived Relativistic Outflow
Abstract
We report on VLBI observations of the fast and blue optical transient (FBOT), AT 2018cow. At 62 Mpc, AT 2018cow is the first relatively nearby FBOT. The nature of AT 2018cow is not clear, although various hypotheses from a tidal disruption event to different kinds of supernovae have been suggested. It had a very fast rise time (3.5 d) and an almost featureless blue spectrum although high photospheric velocities (40,000 km s-1) were suggested early on. The X-ray luminosity was very high, erg s-1, larger than those of ordinary SNe, and more consistent with those of SNe associated with gamma-ray bursts. Variable hard X-ray emission hints at a long-lived “central engine.” It was also fairly radio luminous, with a peak 8.4-GHz spectral luminosity of erg s-1 Hz-1, allowing us to make VLBI observations at ages between 22 and 287 d. We do not resolve AT 2018cow. Assuming a circularly symmetric source, our observations constrain the average apparent expansion velocity to be by d ( limit). We also constrain the proper motion of AT 2018cow to be . Since the radio emission generally traces the fastest ejecta, our observations make the presence of a long-lived relativistic jet with a lifetime of more than one month very unlikely.
keywords:
Supernovae: individual (AT 2018cow) — radio continuum: general1 Introduction
With the increasing cadence of optical surveys, an increasing number of rapidly-evolving transients are being detected (e.g. Drout et al., 2014; Tanaka et al., 2016; Pursiainen et al., 2018). These rapid transients form a diverse population, spanning a wide range of luminosity, composition and environment, and both broaden and challenge our current ideas of core-collapse stellar death.
AT 2018cow (also known as ATLAS18qqn, SN 2018cow) is in the star-forming dwarf spiral galaxy CGCG 13768 (also known as CGCG 1613.8+2224 and SDSS J161600.57+221608.2) at (Prentice et al., 2018; Smartt et al., 2018a), which corresponds to a luminosity distance, Mpc and an angular size distance Mpc111We use the values from the Planck Collaboration et al. (2018), which are km s-1 Mpc-1, and .. AT 2018cow is one of a new class of fast and blue optical transients (FBOTs222Some authors use the term Fast-Evolving Luminous Transient, or FELT instead of FBOT.; e.g. Drout et al., 2014), and is the first example of a FBOT seen in the local universe.
AT 2018cow was initially optically detected by the Asteroid Terrestrial-impact Last Alert System (ATLAS) survey on MJD 58285.44 (Smartt et al., 2018a). It was not detected by the All Sky Automated Survey for SuperNovae (ASAS-SN) on MJD 58284.13 (Prentice et al., 2018), therefore the explosion date is tightly constrained, and we take a rounded value of MJD 58285 (2018 June 16) as our explosion time, (also adopted by Ho et al., 2019b; Perley et al., 2019)
AT 2018cow was also detected in the radio, first at mm-wavelengths (de Ugarte Postigo et al., 2018; Ho et al., 2019b), then with the Arcminute Microkelvin Imager Large Array at 15 GHz (Bright et al., 2018), and subsequently with the Australia Telescope Compact Array and the Jansky Very Large Array (VLA) at various frequencies between 1.3 and 34 GHz (Dobie et al., 2018a, b, c; Margutti et al., 2019). Horesh et al. (2018) reported a 5-GHz detection with e-Merlin which provided a position accurate to a few mas. We detected it at 22 GHz with Very Long Baseline Interferometry (VLBI) on 2018 Jul. 7 with the National Radio Astronomy Observatory (NRAO) High Sensitivity Array (Bietenholz et al., 2018), refined the position to the sub-mas level, and found a total flux density of 5 mJy at 22 GHz (Margutti et al., 2019). It was subsequently also detected with the European VLBI Network at 1.6 GHz (An, 2018).
AT 2018cow has extremely peculiar properties, which make the identification of its intrinsic nature a challenge. It had:
-
(1) A very rapid rise in the optical lightcurve, brightening by 5 mag in a few days (Smartt et al., 2018b), to a large peak bolometric luminosity of erg s-1, followed by a relatively quick decay with luminosity declining approximately as (Perley et al., 2019). The high luminosity, quick rise and rapid decay rule out optical emission powered by the decay of 56Ni such as that in most SNe (Margutti et al., 2019).
-
(3) Emission lines of H and He of intermediate width (a few thousand km s-1) appeared after about 10 days, which were initially quite asymmetric and shifted towards the red, but which became more symmetric and moved blueward at later times (Perley et al., 2019).
-
(4) An X-ray luminosity with a high peak of erg s-1, which subsequently decayed rapidly (Rivera Sandoval & Maccarone, 2018; Margutti et al., 2019). The peak X-ray luminosity is comparable to those of supernovae (SNe) connected to gamma-ray bursts (GRBs, see e.g. Dwarkadas & Gruszko, 2012), but larger than that of most ordinary SNe. The decay rate of the X-ray flux increased after d. In addition to the overall rise and decay, the X-ray emission showed variability with timescales as short as 1 day (Kuin et al., 2019; Margutti et al., 2019).
-
(5) A relatively high radio luminosity, with a peak of erg s-1 Hz-1, higher than most Ibc SNe, but comparable to GRBs in the local universe. In the radio, the rise was relatively slow, with the peak time at 8.5 GHz not occurring till d (Margutti et al., 2019). The radio spectral energy distribution (SED) showed a spectral peak at 120 GHz at d (Ho et al., 2019b), which moved downwards in frequency to 5 GHz by d (Margutti et al., 2019).
Multi-wavelength observations have shown evidence for strong asymmetries in the ejecta of AT2018cow (Margutti et al., 2019). Various different ejecta velocity regimes have been observed in AT 2018cow. The early broad spectral features suggested some velocities of . The radio spectral energy distribution suggests velocities of . Finally the H and He spectral features which emerged later suggest velocities of .
Spectropolarimetry at d showed significant time- and frequency-dependent linear polarization, which is usually interpreted as indicating significant departures from symmetry (Smith et al., 2018), and suggesting the possibility of a segmented, anisotropic outflow of some kind.
In fact, various authors have already suggested that there might be a jet in AT 2018cow (Margutti et al., 2019; Kuin et al., 2019; Perley et al., 2019; Soker et al., 2019). Due to the similarities with GRB-SNe, an off-axis GRB event, with a relativistic jet not directed along the line of sight, is a possibility. No gamma-ray emission was seen to limits of erg cm-2 for a 10-s bin (Margutti et al., 2019; Kuin et al., 2019, and references therein). The X-ray data, however, suggest some form of energy input (Margutti et al., 2019; Fang et al., 2019).
As shown in Margutti et al. (2019), GRB-like relativistic jets with isotropic-equivalent energies erg and expanding in a wind-stratified medium () are excluded by the observations for all viewing angles for progenitor mass-loss rates, yr km s-1. Jets with lower or lower are possible for a range of viewing angles.
Alternatively, Soker et al. (2019) interpret AT 2018cow as the result of a binary star where a neutron-star inspirals into its red giant companion, accreting rapidly when it reaches the dense core. Jets are produced, which clear the polar regions of the supergiant, which then form the observed high-velocity material.
Finally, Perley et al. (2019), Michałowski et al. (2019) and Kuin et al. (2019) all suggest the possibility that AT 2018cow might not be a core-collapse SN, but rather a tidal disruption event (TDE), where a star is disrupted by an intermediate-mass black hole which resides in the outskirts of CGCG 13768. Some tidal disruption events (TDEs) can produce radio-bright relativistic jets, for example Swift 164449.3+573451 (Berger et al., 2012; Zauderer et al., 2011), although Swift 164449.3+573451 was much more radio luminous than AT 2018cow. Recently, Mattila et al. (2018) reported on a TDE with a resolved relativistic jet, Arp 299-B AT1, which had a peak radio luminosity erg s1 (Mattila et al., 2018) comparable to that of AT 2018cow ( erg s-1; Margutti et al., 2019). In VLBI observations of Arp 299-B AT1 carried out between 2005 and 2015, Mattila et al. (2018) found clear proper motions corresponding to a projected speed of , but surmise speeds nearer to for the first year. The jet initially moved with a speed of near , but slowed down to after 2 yr (Mattila et al., 2018).
Regardless of the nature of the outflow, a direct measurement of the size of the emitting region and the expansion speed represents a key constraint to the physics. It is generally thought that the radio emission in both SNe and GRB jets is produced mostly from the external shock, that is where the ejecta impact the circumstellar or interstellar mediums (CSM or ISM). This means that the radio emission is produced by the fastest ejecta. (In the case of GRB jets, shocks internal to the jet are thought to be responsible for the short-lived high energy emission, but the longer-lived “afterglow” emission at lower photon energies, including radio, is thought to be largely due to the external shock where the ejecta interact with the surrounding material, e.g. Granot & van der Horst 2014; Gehrels & Mészáros 2012.) VLBI radio observations have the unique capability of resolving the source, and therefore represent the most direct way of observationally constraining the size, and therefore the speed of the outflow. Thus motivated we undertook VLBI observations of AT 2018cow, and we present and discuss our results in this paper.
2 Observations and Data Reduction
We obtained four VLBI observing sessions on AT 2018cow with the National Radio Astronomy Observatory (NRAO) High Sensitivity Array (HSA), which includes the Very Long Baseline Array (VLBA) as well as the 100-m diameter Effelsberg telescope in Germany and the 105 m diameter Robert C. Byrd telescope at Green Bank. The observing runs occurred between 2018 July and 2019 March, and we give the particulars in Table 1.
| Dateb | Proposal | Telescopesc | Freq. | MJDd | Agee | Total timef |
|---|---|---|---|---|---|---|
| (GHz) | (d) | (h) | ||||
| 2018 Jul 7 | BB399 | VLBA except NL & EB | 22.3 | 58307.1 | 21.6 | 6.0 |
| 2018 Aug 2 | BB401A | VLBA except PT, LA & EB | 22.3 | 58333.0 | 47.6 | 6.0 |
| 2018 Sep 23 | BB401B | VLBA & EB | 22.3 | 58383.8 | 98.4 | 6.0 |
| 2019 Mar 30 | BB408 | VLBA, EB, GB, & VLA | 8.4 | 58572.3 | 287.3 | 8.0 |
a NRAO observing code
b The starting date of the observations
c VLBA = NRAO Very Long Baseline Array, m diameter; GB = Robert C. Byrd telescope at Green Bank,
105 m diameter; VLA = the Jansky Very Large Array in
phased-array mode, equivalent diameter 94 m; EB = the Effelsberg
antenna, 100 m diameter
d Modified Julian Date of midpoint of observation
e The age of AT 2018cow since 2018 June 16 (Smartt
et al., 2018a)
f The total length of the observing run
We observed at 22.3 GHz, for the first three sessions, and then switched to 8.4 GHz for the last one, recording both senses of circular polarization over a bandwidth of 256 MHz. As usual, a hydrogen maser was used as a time and frequency standard at each telescope, and we recorded with the RDBE/Mark5C wide-band system at a sample-rate of 2 Gbps, and correlated the data with NRAO’s VLBA DiFX correlator (Deller et al., 2011).
The data reduction was carried out with NRAO’s Astronomical Image Processing System (AIPS). The initial flux density calibration was done through measurements of the system temperature at each telescope, and improved through self-calibration of the phase-reference source, which is an ICRF2 defining source, ICRF J161914.8+224747 (Fey et al., 2015), or QSO J1619+2247 (just J1619+2247 hereafter; we will discuss J1619+2247, which turned out to be significantly resolved, in more detail in section 4.1 below).
3 VLBI images
In Figure 1, we show one of our VLBI images of AT 2018cow, at 22.3 GHz and observed on 2018 September 23, at d. Since AT 2018cow is unresolved in all our observing sessions, we do not reproduce the other images.
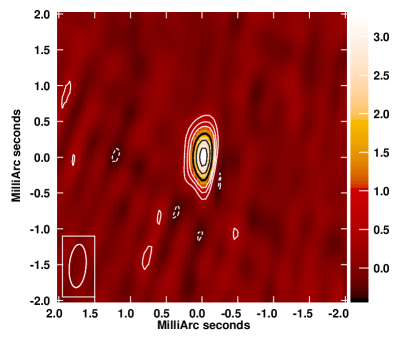
As we will show later, d is also the epoch for which we obtain the most stringent quantitative constraint on the size of the radio source. The image appears to be largely if not completely unresolved with the 50% contour being very similar to that of the restoring beam.
Other than the central peak of AT 2018cow, no emission was seen that was brighter than , or % of AT 2018cow’s peak brightness (note that only a portion of the imaged area is reproduced in Fig. 1). We can therefore say that, between the radii of 0.6 mas (our beamwidth) and 50 mas, we can see no emission which could be the result of a highly relativistic jet to those limits. The range of radii correspond to projected speeds of to .
AT 2018cow is also largely or completely unresolved in our images at other epochs, and in no case is any significant emission displaced from the central peak seen. We chose not to reproduce the other images in this paper since the source is unresolved.
Of our four images, AT 2018cow’s flux density was highest at d and 22.3 GHz, and this image also has the highest dynamic range. In this image, any emission at separations between 0.6 mas to 50 mas from the brightness peak, which would correspond to apparent speeds of to , must be mJy beam-1, or % of AT 2018cow’s peak brightness. On the d, 22.3 GHz image, there is no emission displaced from the peak of AT 2018cow mJy beam-1, and on the d image, none Jy beam-1.
4 Size, Expansion Speed and Proper Motion
AT 2018cow is unresolved in all our VLBI observations. In all cases a point source is compatible with our measurements. However, we would like to place some upper limits on its angular size. This can be done most accurately by fitting models directly to the visibility (Fourier-transform plane) data, which generally permits higher accuracies than fitting the image data (see Bietenholz et al., 2009; Bartel et al., 2002, for more detailed discussions of this process). To do so, however, requires the assumption of some sort of model geometry.
In a normal SN, an approximately spherical outflow produces a forward and reverse shock structure, with the radio emission arising in the region in between, which is expected therefore to have an approximately spherical-shell geometry. In the earlier stages when the emission is optically thick, the radio emission region would therefore be approximately disk-like on the sky, while a more “doughnut-like” pattern is produced after it becomes optically thin. Indeed, the relatively few SNe that have been resolved show structures at least approximately like this (see, e.g. Bietenholz, 2014).
In the case of a directed outflow like a jet, the situation is more complicated, and a wide variety of emission geometries is possible depending on the outflow speed, opening angle and the angle between the jet axis and line of sight. Although one might naively expect the radio emission to be elongated along the projected jet axis, Granot et al. (2018) calculated model radio images for various GRB jets, and depending on the time and other parameters, a wide variety of radio morphologies were produced. For example, the radio emission could be elongated perpendicular to the jet direction, but displaced from the explosion center (bow shock), or elongated along the jet direction when both jet and counterjet are visible. Granot et al. (2018) found significant proper motion of the radio emission centroid in many cases. Similar results are seen by Wu & MacFadyen (2018, 2019) who calculated models for an off-axis jet in the binary neutron-star merger event GW 170817, and found that even an initially highly-directed outflow rapidly becomes extended in the direction perpendicular to the jet axis, although the emission region may be displaced from the explosion center along the jet axis. We therefore expect that by the time the radio emission becomes bright, the shock structure is already significantly sphericized, and in projection is more likely to be more circular, or possibly bow-shock shaped, rather than highly elongated along the jet direction. (We discuss the proper motion in the case of AT 2018cow in § 4.1 below).
Given the range of possible geometries for AT 2018cow, and our lack of resolution, we restrict ourselves to the one simple model which can give some representative results for the various possible real geometries. We choose a circular disk model, which is bounded and therefore provides a convenient estimate of the outer radius of the emission region. As mentioned above, such a disk resembles the expected emission in the case of a young, optically-thick SN, and should fairly representative results in other cases. We discuss the effect of our choice of model on our estimates of the expansion speed below.
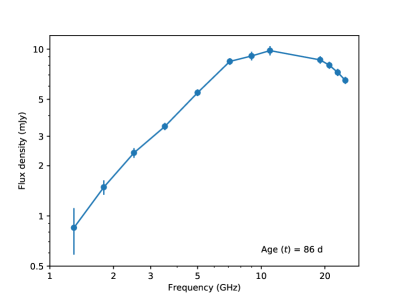
We show an example of AT 2018cow’s SED, at d in Figure 2. At this time the spectral peak was near 12 GHz, implying that our 22 GHz observations at d, while nominally optically thin, were still in the transition region between the optically thick and thin regimes. Our observations at 8.4 GHz and , were well in the optically-thin regime. If the emission region is in fact a spherical shell as expected for a normal supernova, a spherical shell model (such as we used in e.g., Bietenholz et al. 2003 and Bietenholz et al. 2012) would be more appropriate than the disk. However, the effect using a disk model on our upper limits on the expansion size is small: the fitted outer radius, or limit thereon, for the shell model would be only 3% smaller than the value we give.
The fits were done with the AIPS task OMFIT. When the signal-to-noise ratio permitted, we fitted also the antenna-gain phases, in other words simultaneously model-fitting and self-calibrating.
We give the fitted total flux densities in Table 2. Given the rapid variability of AT 2018cow, these are reasonably consistent with those seen with the VLA and other telescopes. A future paper, Coppejans et al., will discuss the multi-frequency lightcurve in more detail.
As to the outer angular radius, in all cases, only upper limits could be determined. In Table 2 we give the upper limits on the outer angular radius for each of our four epochs, along with the implied limits on the expansion speed (calculated for Mpc). The upper limit on the expansion speed for our last epoch at d was . The most constraining upper limit on the angular size was that from our third epoch, d, which was 128 as, corresponding to a limit on the average expansion speed over the first 98.4 d of . We note that these limits were derived based on a model with circular symmetry in the sky plane. If the expansion were one-sided, or the source elongated along the N-S direction where our resolution is poorer, then expansion speeds up to factor of 2 higher than the values given in Table 2 could be compatible with our measurements.
| Date | MJD | Age | Flux | Outer Angular | Expansion Velocityc | Relative positiond | |
|---|---|---|---|---|---|---|---|
| Densitya | Radiusb | ||||||
| (d) | Jy | ( limits; as) | ( limits; | RA (as) | decl. (as) | ||
| 2018 Jul 7 | 58307.1 | 21.6 | 5870 | ||||
| 2018 Aug 2 | 58333.0 | 47.6 | 20100 | ||||
| 2018 Sep 23 | 58383.8 | 98.4 | 4050 | ||||
| 2019 Mar 30 | 58572.3 | 287.3 | 69 |
a The total flux density of a uniform circular disk
model fitted to the calibrated visibility data by least squares
b The angular outer radius of the fitted circular disk
model. Angular sizes larger by a factor of 2 are compatible
with our measurements if the source is elongated primarily in the
N-S direction where our resolution is poorer.
c The average expansion speed assuming two-sided
expansion, radius / time, taking a distance of 62 Mpc
d See text, § 4.1. The positions given
relative to the mean centre position of AT 2018cow over our four epochs,
which was RA = , decl. =
(J2000), and was determined relative to
that of J1619+2247, with a correction for the average shift of the peak
brightness position with frequency expected due to opacity effect
between 22 and 8.4 GHz for the last epoch (“core
shift”; Plavin et al., 2019). The uncertainties include the statistical
contribution, the contribution due to the uncertainty in position of
the reference source, as well as a contribution due to the
phase-referencing calculated according to Pradel
et al. (2006)
4.1 Proper Motion
We determined the proper motion of AT 2018cow using our phase-referenced VLBI observations to obtain differential astrometry between AT 2018cow and our phase reference source, J1619+2247. All our astrometric measurements were made without any phase-selfcalibration, and used data that was strictly phase-referenced to J1619+2247.
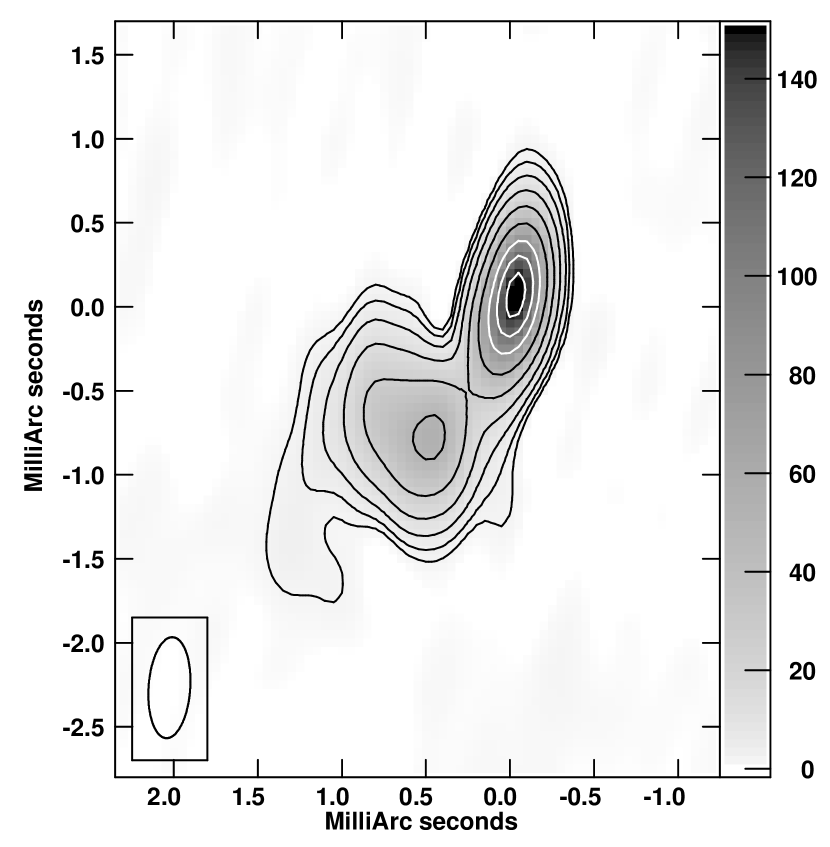
Our reference source, J1619+2247, is a “defining” source in the International Celestial Reference Frame (ICRF), which is +0.75° and +0.53° away in RA and decl., respectively, from AT 2018cow, and whose position is uncertain by 56 as in RA and 42 as in decl333ICRF3: http://hpiers.obspm.fr/webiers/newwww/icrf. J1619+2247 is at redshift, (Sowards-Emmerd et al., 2005), and so is not expected to have any discernible proper motion. Unfortunately, J1619+2247 is not an ideal reference source as it is significantly resolved at both of our observing frequencies. We show the 22.3-GHz VLBI image of J1619+2247 from our 2018 September 23 epoch in Figure 3. The structure is likely that of one-sided jet, with a core component and a jet or lobe component 1 mas to the SE of core. An elliptical Gaussian fit to the core suggests an intrinsic (de-convolved) major axis FWHM of 350 as, at p.a. 152°. The core component has 60% of the total flux density.
As a reference position, we use the position of the brightness peak of J1619+2247. Since J1619+2247 is significantly resolved, the position of the brightness peak could be resolution-dependent. We therefore use as a reference position that of the brightness peak on an image convolved to our lowest resolution, that of our last epoch, observed at 8.4 GHz, which is mas at p.a. °. Due to absorption effects there is still the possibility that the position of the peak-brightness point at 22 GHz is different from that at 8.4 GHz (the “core-shift” phenomenon; see, e.g. Kovalev et al., 2008), and therefore that our reference positions for the fourth epoch (at 8.4 GHz) is different from that used for the first three epochs (at 22.3 GHz). Plavin et al. (2019) found an average shift of the peak-brightness position of 0.4 mas between 2.3 and 8.4 GHz for 40 sources, generally along the jet direction. Assuming the magnitude of the shift is , and that the jet direction is p.a. 152°, we would expect an average shift of 80 as at p.a. 152° in the peak-brightness position when going from 22.3 and 8.4 GHz. However, Plavin et al. (2019) found that the amount of shift varies considerably between sources, and can vary with time for any given source, and given the complex morphology (Fig. 3), our value for the jet direction could also be significantly in error. So, while a shift between 8.4 to 22 GHz of 80 as at p.a. ° represents a “best guess”, the true value must be regarded as quite uncertain.
We obtained the centre position of AT 2018cow from similar modelfits to those just discussed in § 4 using either a circular disk, or the projection of a spherical shell for the model. In all cases the position was determined without any self-calibration in phase. The mean position over our four epochs was RA = , decl. = (J2000), with an estimated uncertainty of as, which is consistent with, but more accurate than the preliminary value we published from only the first epoch in Bietenholz et al. (2018).
We give measured offsets from the mean position in Table 2, with estimated standard errors. The standard errors include three terms, all added in quadrature. (1) the statistical uncertainties, (2) an uncertainty in the phase-referencing, due to errors in modelling the atmospheric delay and in the antenna positions and other components, estimated following Pradel et al. (2006) to be 35, 50 as in RA and decl. respectively for source separation of 0.92°, and our source declination of +22°, and finally, (3) the uncertainty in position of the reference source itself from ICRF3.
To obtain the proper motion of AT 2018cow, we fit a linear function to the RA and decl. position offsets given in Table 2 by weighted least-squares. We find proper motions of as d-1 in RA and as d-1 in decl., or as d-1 total. Nominally, the proper motion in decl. is marginally significant. However, it depends strongly on the correction for the “core shift’, which is poorly known. We therefore do not consider the proper motion significant. The formal limit on the proper motion is 1.43 as d-1, corresponding to 154,000 km s-1, or .
5 Discussion
AT 2018cow was a very unusual object, and as discussed in our introduction, the observations in different wavelength regimes and times have suggested an anisotropic source, with some more massive, slow ejecta with , and a less massive portion with higher speeds . The similarities to GRBs and the SNe associated with them (very fast rise time and high X-ray luminosity) suggest that there may be a relativistic component to the outflow, likely in the form of a jet. While jets with erg are disfavoured by the observations (Margutti et al., 2019), even such energetic jets are possible at large angles to the line of sight or for low progenitor mass-loss rates. An off-axis GRB jet is therefore certainly possible in AT 2018cow. Chandra & Frail (2012) show that although the majority of gamma-ray detected GRBs have erg, 15% of GRBs have erg, so a relatively low-energy GRB is not improbable. The late peak in the 8.5-GHz lightcurve, at d, suggests an orientation not near the line of sight.
The radio SED, if due only to synchrotron self-absorption (SSA), would suggest only non-relativistic expansion speeds of . There are, however, various indications of a relatively dense CSM, so some free-free absorption (FFA) seems likely, which would make higher expansion speeds compatible with the observed SED. The spectral index below the peak frequency is flatter (, see Fig. 2) than expected either from SSA or FFA for a single optical depth, suggesting a range of different optical depths is present, which is consistent with the inferred non-spherical geometry.
The radio emission traces the fastest outflow, as it is generated in the shocks formed where the outflow hits the CSM of ISM. Our VLBI observations placed a limit on the apparent two-sided expansion velocity during the first 47 d of . Our later observations similarly rule out average expansion velocities of at d (with the same caveats given for the measurement at d above).
Our upper limits on the angular expansion were based on a circular model. If the source were elongated along an approximately N-S direction, or were undergoing one-sided expansion, apparent expansion speeds of would be compatible with our measurements.
Our upper limit on the proper motion, by contrast, is largely independent on the choice of a circular model. Our measurements put a upper limit corresponding to on the proper motion of the centroid of the radio emission over the first 9 months. The simulations of off-axis GRB jets of (Granot et al. 2018, see also Gill & Granot 2018) show that in most cases, the centroid of radio emission shows substantial proper motion, often with superluminal apparent velocities. Indeed, for bulk motion with , the majority of jet orientations would produce apparent motions . For GW170817, a double neutron star merger with an off-axis GRB-like jet, Mooley et al. (2018) measured a proper motion using VLBI, which corresponded to an apparent speed of over the first 230 d after the event using VLBI observations.
Our upper limits for both expansion speed and proper motion are on the apparent, not the physical, speeds. In the case of a relativistic jet, unless it was near the plane of the sky, the simulations just mentioned show that it would likely exhibit superluminal apparent speeds, in which case our measured limits would overestimate the physical speeds.
We therefore think that in light of our measurements, it is unlikely that there is any sustained jet with bulk motion , although we cannot conclusively rule it out. A jet such as those seen in GRBs, which typically only decelerate to non-relativistic speed after times () of 1 yr, is therefore unlikely. Jets with a lifetime of 1 month or less were outside the time range of our observations and are therefore still compatible with our measurements.
As mentioned above, some authors have suggested that AT 2018cow is a tidal disruption event. Mattila et al. (2018) saw a resolved jet in a different TDE, Arp-B AT1, for which they inferred proper motions and expansion of the jet at projected speeds of for the first year. Our observations of AT 2018cow clearly rule out such a long-lived and fast jet.
One possibility for AT 2018cow is a choked jet formed in the stellar collapse, where a relativistic jet is formed in the interior of the collapsing star, but is choked before it emerges from the star’s surface. Such a scenario has been invoked to explain the observations of numerous powerful core-collapse SNe (Piran et al., 2019), in particular those of SN 2009bb (Soderberg et al., 2010), SN 2012ap (Margutti et al., 2014), SN 2017iuk (Izzo et al., 2019) and SN 2018gep (Ho et al., 2019a). In this scenario, a relativistic jet is formed inside the collapsing star, and expands outwards through the (non-relativistic) SN ejecta. The bulk of the kinetic energy is in the SN ejecta but a significant fraction is in the jet. The jet is choked inside the star and transfers most of its energy to a “cocoon,” which can emerge from the surface of the star. This cocoon has a small fraction of the ejected mass, and typical velocities of order (Piran et al., 2019). The cocoon spreads laterally after it emerges, and eventually becomes relatively spherical and blends with the remaining ejecta. The cocoon is expected to produce highly transient blue or UV continuum cooling emission and broad absorption features which last typically a few days. Such a picture is broadly consistent with AT 2018cow, where indeed the emission was very blue particularly early on, where the cocoon emission may have contributed to the very rapid rise, where transient high-velocity absorption features were seen (Izzo et al., 2018; Xu et al., 2018; Perley et al., 2019), and where various lines of evidence suggest significant asphericity (see e.g. Margutti et al., 2019; Smith et al., 2018). Indeed, this scenario is similar to the one suggested by Margutti et al. (2019). Although the shock fronts associated with the cocoon would likely produce an initially aspherical radio emission region, the velocities expected of the cocoon () are less than our observational limits on the expansion velocity ( at d). The radio emission from such a cocoon would be resolvable, but only in a relatively nearby SN such as SN 1993J where the morphology of the forward shock was discernible in VLBI images as early as d (see e.g. Bietenholz et al., 2003).
6 Summary and conclusions
1. We have made four epochs of VLBI observations of the unusual fast blue transient source AT 2018cow. 2. The source was unresolved in all of our observations. We place upper limits on the angular size of as, which correspond to limits on the average apparent expansion velocities of and at and 98 d, respectively, assuming a circularly symmetric source. 3. We also measured the proper motion of AT 2018cow, and found that it a upper limit of between and 287 d. 4. Our upper limits on the expansion velocity and the proper motion make a long-lived relativistic jet, such as those seen in GRBs, quite unlikely.
Acknowledgements
This research was supported by both the National Sciences and Engineering Research Council of Canada and the National Research Foundation of South Africa. The Margutti group at Northwestern acknowledges support by the National Science Foundation under Award No. AST-1909796 and by NASA through contract 80NSSC19K0384. R. Margutti is a CIFAR Azrieli Global Scholar in the Gravity & the Extreme Universe Program, 2019. K. D. Alexander acknowledges support provided by NASA through the NASA Hubble Fellowship grant HST-HF2-51403.001 awarded by the Space Telescope Science Institute, which is operated by the Association of Universities for Research in Astronomy, Inc., for NASA, under contract NAS5-26555. The National Radio Astronomy Observatory is a facility of the National Science Foundation operated under cooperative agreement by Associated Universities, Inc. This work is partly based on observations with the 100-m telescope of the MPIfR (Max-Planck-Institut für Radioastronomie) at Effelsberg, Germany. This work made use of the Swinburne University of Technology software correlator, DiFX, developed as part of the Australian Major National Research Facilities Programme and operated under licence.
References
- An (2018) An T., 2018, The Astronomer’s Telegram, 12067
- Bartel et al. (2002) Bartel N., et al., 2002, ApJ, 581, 404
- Berger et al. (2012) Berger E., Zauderer A., Pooley G. G., Soderberg A. M., Sari R., Brunthaler A., Bietenholz M. F., 2012, ApJ, 748, 36
- Bietenholz (2014) Bietenholz M., 2014, in Tarchi A., Giroletti M., Feretti L., eds, 12th European VLBI Network Symposium and Users Meeting (2014), published by SISSA, Trieste. p. 51
- Bietenholz et al. (2003) Bietenholz M. F., Bartel N., Rupen M. P., 2003, ApJ, 597, 374
- Bietenholz et al. (2009) Bietenholz M. F., Soderberg A. M., Bartel N., 2009, ApJL, 694, L6
- Bietenholz et al. (2012) Bietenholz M. F., Brunthaler A., Soderberg A. M., Krauss M., Zauderer B., Bartel N., Chomiuk L., Rupen M. P., 2012, ApJ, 751, 125
- Bietenholz et al. (2018) Bietenholz M., et al., 2018, The Astronomer’s Telegram, 11900, 1
- Bright et al. (2018) Bright J., Horesh A., Fender R., Motta S., Sfaradi I., Titterington D., Perrott Y., Ho A., 2018, The Astronomer’s Telegram, 11774
- Chandra & Frail (2012) Chandra P., Frail D. A., 2012, ApJ, 746, 156
- Deller et al. (2011) Deller A. T., et al., 2011, PASP, 123, 275
- Dobie et al. (2018a) Dobie D., Ravi V., Ho A., Kasliwal M., Murphy T., 2018a, The Astronomer’s Telegram, 11795
- Dobie et al. (2018b) Dobie D., Ravi V., Ho A., Kasliwal M., Murphy T., 2018b, The Astronomer’s Telegram, 11818
- Dobie et al. (2018c) Dobie D., Ravi V., Ho A., Kasliwal M., Murphy T., 2018c, The Astronomer’s Telegram, 11862
- Drout et al. (2014) Drout M. R., et al., 2014, ApJ, 794, 23
- Dwarkadas & Gruszko (2012) Dwarkadas V. V., Gruszko J., 2012, MNRAS, 419, 1515
- Fang et al. (2019) Fang K., Metzger B. D., Murase K., Bartos I., Kotera K., 2019, ApJ, 878, 34
- Fey et al. (2015) Fey A. L., et al., 2015, AJ, 150, 58
- Gehrels & Mészáros (2012) Gehrels N., Mészáros P., 2012, Science, 337, 932
- Gill & Granot (2018) Gill R., Granot J., 2018, MNRAS, 478, 4128
- Granot & van der Horst (2014) Granot J., van der Horst A. J., 2014, PASA, 31, e008
- Granot et al. (2018) Granot J., De Colle F., Ramirez-Ruiz E., 2018, MNRAS, 481, 2711
- Ho et al. (2019a) Ho A. Y. Q., et al., 2019a, arXiv e-prints, p. arXiv:1904.11009
- Ho et al. (2019b) Ho A. Y. Q., et al., 2019b, ApJ, 871, 73
- Horesh et al. (2018) Horesh A., Moldon J., Beswick R., Bright J., Fender R., Sfaradi I., 2018, The Astronomer’s Telegram, 11819
- Izzo et al. (2018) Izzo L., et al., 2018, The Astronomer’s Telegram, 11753
- Izzo et al. (2019) Izzo L., et al., 2019, Nat, 565, 324
- Kovalev et al. (2008) Kovalev Y. Y., Lobanov A. P., Pushkarev A. B., Zensus J. A., 2008, Astron. Astrophys., 483, 759
- Kuin et al. (2019) Kuin N. P. M., et al., 2019, MNRAS,
- Margutti et al. (2014) Margutti R., et al., 2014, ApJ, 797, 107
- Margutti et al. (2019) Margutti R., et al., 2019, ApJ, 872, 18
- Mattila et al. (2018) Mattila S., et al., 2018, Science, 361, 482
- Michałowski et al. (2019) Michałowski M. J., et al., 2019, Astron. Astrophys., 627, A106
- Mooley et al. (2018) Mooley K. P., et al., 2018, Nat, 561, 355
- Perley et al. (2019) Perley D. A., et al., 2019, MNRAS, 484, 1031
- Piran et al. (2019) Piran T., Nakar E., Mazzali P., Pian E., 2019, ApJL, 871, L25
- Planck Collaboration et al. (2018) Planck Collaboration et al., 2018, arXiv e-prints, p. arXiv:1807.06209
- Plavin et al. (2019) Plavin A. V., Kovalev Y. Y., Pushkarev A. B., Lobanov A. P., 2019, MNRAS, 485, 1822
- Pradel et al. (2006) Pradel N., Charlot P., Lestrade J.-F., 2006, Astron. Astrophys., 452, 1099
- Prentice et al. (2018) Prentice S. J., et al., 2018, ApJ, 865, L3
- Pursiainen et al. (2018) Pursiainen M., et al., 2018, MNRAS, 481, 894
- Rivera Sandoval & Maccarone (2018) Rivera Sandoval L. E., Maccarone T., 2018, The Astronomer’s Telegram, 11737
- Smartt et al. (2018a) Smartt S. J., et al., 2018a, The Astronomer’s Telegram, 11727
- Smartt et al. (2018b) Smartt S. J., et al., 2018b, The Astronomer’s Telegram, 11742
- Smith et al. (2018) Smith P. S., Leonard D. C., Bilinski C., Hoffman J. L., Dessart L., Smith N., Milne P., Williams G. G., 2018, The Astronomer’s Telegram, 11789
- Soderberg et al. (2010) Soderberg A. M., et al., 2010, Nat, 463, 513
- Soker et al. (2019) Soker N., Grichener A., Gilkis A., 2019, MNRAS, 484, 4972
- Sowards-Emmerd et al. (2005) Sowards-Emmerd D., Romani R. W., Michelson P. F., Healey S. E., Nolan P. L., 2005, ApJ, 626, 95
- Tanaka et al. (2016) Tanaka M., et al., 2016, ApJ, 819, 5
- Wu & MacFadyen (2018) Wu Y., MacFadyen A., 2018, ApJ, 869, 55
- Wu & MacFadyen (2019) Wu Y., MacFadyen A., 2019, ApJL, 880, L23
- Xu et al. (2018) Xu D., et al., 2018, The Astronomer’s Telegram, 11740
- Zauderer et al. (2011) Zauderer B. A., et al., 2011, Nat, 476, 425
- de Ugarte Postigo et al. (2018) de Ugarte Postigo A., et al., 2018, The Astronomer’s Telegram, 11749