6.7 GHZ CH3OH ABSORPTION TOWARDS THE N3 GALACTIC CENTER POINT-SOURCE
Abstract
We present evidence of 6.7 GHz methanol (CH3OH) and 4.8 GHz formaldehyde (H2CO) absorption towards the Galactic Center (GC) point-source ‘N3’. Both absorption features are unresolved and spatially aligned with N3. The 6.7 GHz CH3OH contains a single velocity component (centered at 10 km s-1) while the 4.8 GHz H2CO shows two velocity components (centered at 3 and +8 km s-1). We find that the velocity of these absorption components are similar to that of emission lines from other molecules (e.g., SiO and HC3N) detected toward this compact-source (13 to +25 km s-1; ‘N3 cloud’). The detection of these absorption features is a firm indication that some of the molecular gas in the N3 molecular cloud is on the near-side of the continuum source. Analysis of the CH3OH absorption kinematics shows a relatively large velocity dispersion (3.8 km s-1) for the size scale of this feature (01, 0.01 pc at the GC; Ludovici et al., 2016), when compared with other similar size GC clouds in the Larson linewidth-size relationship. Further, this linewidth is closer to velocity dispersion measurements for size scales of 1.3 pc, which is roughly the width of the N3 cloud (25″; 1.0 pc). We argue that this relatively broad linewidth, over a small cross-sectional area, is due to turbulence through the depth of the cloud, where the cloud has a presumed line-of-sight thickness of 1 pc.
1 Introduction
The 6.7 GHz CH3OH (5–6) line is typically observed as a class II maser. Class II masers are radiatively pumped and are therefore frequently associated with star-forming regions (e.g., Menten, 1991). While detections of the 6.7 GHz CH3OH line in emission are common (e.g., Menten, 1991; Caswell et al., 2010; Rickert et al., 2019; Lu et al., 2019), detections in absorption are not. As of this paper, only a few studies have reported the 6.7 GHz CH3OH line in absorption (e.g., Menten, 1991; Impellizzeri et al., 2008; Pandian et al., 2008). Only a few of the sources in the Menten (1991) survey contained absorption features towards extended sources, all of which are located in the central region of our Galaxy, including: Sgr A-A, Sgr A-F, and the Sgr B2 complex.
The center of our Galaxy (Galactic Center; GC) is typically defined as the inner 500 pc of the Milky Way galaxy. The environment of molecular gas in the GC is more extreme than in the Galactic disk, with higher gas temperatures ranging from 50300 K (in comparison to 1020 K in the disk; e.g., Mills & Morris, 2013; Ginsburg et al., 2016). Molecular clouds in the GC are also observed to have broader linewidths (230 km s-1 on 540 pc size-scales) than clouds in the Galactic disk (0.55 km s-1; e.g., Oka et al., 2001; Heyer et al., 2009; Shetty et al., 2012). The relationship of cloud size to velocity dispersion (also known as the ‘Larson linewidth-size () relationship’) holds across a wide range of physical size scales from molecular cloud complexes to compact cloud cores (e.g., Larson, 1981). Most of the recent measurements of GC cloud kinematics, across multiple size scales, use dendrogram analysis to fit the velocity dispersion and angular size of the gas components (e.g., Shetty et al., 2012; Kauffmann et al., 2017). We employ an alternative method of investigating GC gas kinematics at sub-parsec (0.01 pc) size scales by using a 6.7 GHz CH3OH absorption measurement towards the compact source N3.
1.1 N3 point-source
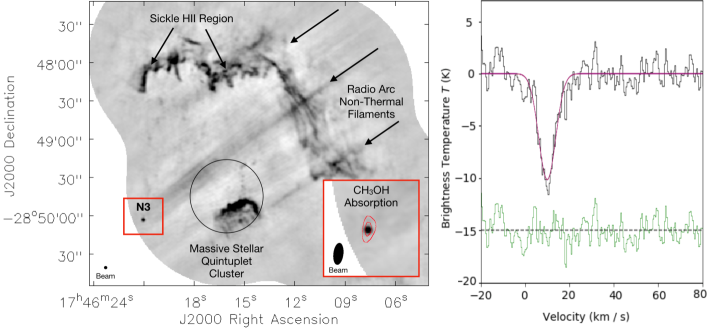
The ‘N3’ point-source is located 14′ (33 pc) in projection from Sgr A∗ in a region known as the ‘Radio Arc’ (see Figure 1, left). The N3 point source is spatially projected onto one of the Radio Arc Non-Thermal Filaments (e.g., Yusef-Zadeh & Morris, 1987), but appears to be a distinct object (Figure 1, left). The nature of the N3 compact source has been a mystery for several decades (e.g., Yusef-Zadeh & Morris, 1987; Ludovici et al., 2016; Staguhn et al., 2019). A recent study of this compact source determined N3 has a broken power-law spectrum, consistent with synchrotron self-absorption, and is shown to be time-variable over decade-long timescales (Ludovici et al., 2016). N3 is unresolved at 44 GHz (i.e., with a 026011 beam), the highest spatial resolution in Ludovici et al. (2016), indicating a maximum size of 1000 AU at a distance of 8.18 kpc (Abuter et al., 2019). Based on the arguments presented in Ludovici et al. (2016), possibilities that N3 is a young supernova, foreground active star, ultracompact H II region, or a micro-quasar are all ruled out.111Ludovici et al. (2016) also disfavor N3 being an active galactic nucleus (AGN), but as we discuss in Section 3.2, that possibility should remain viable.
The N3 source has associated molecular emission (the ‘N3 molecular cloud’) that appears to wrap around the compact source (Ludovici et al., 2016; Butterfield et al., 2018). The molecular emission is extended, with a diameter of only 25″ (1.0 pc). The high gas temperatures observed in this cloud (80100 K, Ludovici et al., 2016) suggest this cloud is located in the GC. Thermal 48 GHz CH3OH (1000) emission is detected in the N3 molecular cloud along with sixteen 36 GHz CH3OH (4-130) masers and twelve 44 GHz CH3OH (7061) masers distributed throughout the cloud (Ludovici et al., 2016). Both of these CH3OH maser transitions are class I masers,222Class I masers are excited and therefore trace shocks. however, only the 36 GHz maser is spatially co-located with the radio continuum of N3.
2 Observations and Data Reduction
This paper focuses on the 6.7 GHz CH3OH transition towards the point source N3. These observations are part of a larger ‘Karl G. Jansky Very Large Array’, hereafter ‘VLA’, survey of the GC (Project ID: 17A-321).333The VLA radio telescope is operated by the National Radio Astronomy Observatory (NRAO). The National Radio Astronomy Observatory is a facility of the National Science Foundation operated under cooperative agreement by Associated Universities, Inc. These observations were taken in C band with the C array, resulting in a spatial resolution of 5″. We used the Common Astronomy Software Application (CASA)444http://casa.nrao.edu/ pipeline, provided by NRAO, to calibrate the data. The spectral line was continuum-subtracted in the UV plane using the CASA task UVCONTSUB before any cleaning was done. The imaging parameters of the CH3OH (5–6) data cube are presented in Table 1.
| Parameter | Value |
|---|---|
| Image Parameters | |
| CH3OH Rest Frequency | 6.66852 GHz |
| Spatial Resolution | 11″ 5″ (0.40.2 pc) |
| Spectral Resolution | 0.47 km s-1 |
| Channel Noise | 1.5 mJy beam-1 |
| Fit Parameters | |
| Central Velocity | 9.94 0.17 km s-1 |
| Velocity Dispersion | 3.84 0.17 km s-1 |
| Depth | -10.15 0.38 K |
We also present the detection of 4.8 GHz H2CO 1(1,0)–1(1,1) absorption towards N3. 4.8 GHz H2CO absorption is known to be quite common in the GC (e.g., Whiteoak & Gardner, 1979). The H2CO data presented in this paper were taken using the VLA in C band with the A array (0408 resolution) with a sensitivity of 1.0 mJy beam-1 and velocity resolution of 3.88 km s-1 (Project ID: 18A-303). Due to the narrow velocity range, and courser spectral resolution, of the H2CO observations, fitting the spectrum is challenging. Therefore, we will be focusing on the 6.7 GHz CH3OH transition for the majority of the paper.
3 Results and Discussion
3.1 6.7 GHz CH3OH Absorption Feature
The inset in Figure 1 left shows the 6.7 GHz CH3OH absorption in the 9.97 km s-1 channel. The feature is shown to be spatially aligned with the point-source N3 (red contour in inset), suggesting the absorbed continuum emission is likely from N3. We extracted the CH3OH absorption using a region size comparable to the point spread function of the observations (11″ 5″ aperture), with the resulting spectrum presented in Figure 1, right. We fit the spectrum in Figure 1, right, with a single Gaussian component, using the python program pyspeckit (Ginsburg & Mirocha, 2011), and report the central velocity, velocity dispersion, and depth of the fit profile in Table 1.
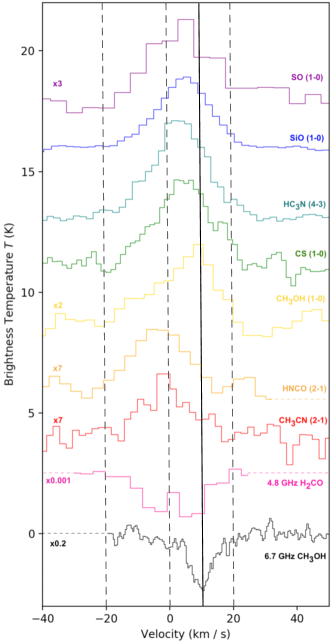
The measured central velocity of the 6.7 GHz CH3OH absorption (9.94 km s-1; vertical dashed line in Figure 2) is comparable to molecular emission velocities detected in the N3 Molecular Cloud (13 to + 25 km s-1; Ludovici et al., 2016). Figure 2 shows a comparison of the CH3OH absorption profile (from Figure 1, right) to molecular gas emission from seven transitions in Ludovici et al. (2016) and the H2CO absorption line presented in Section 2. The velocity range of the 6.7 GHz CH3OH absorption feature, to km s-1, overlaps with emission from all seven transitions (see Figure 2). However, only the CH3OH (1000) line (yellow spectrum) peaks at the same velocity (9 km s-1). All other emission lines have peak emission velocities lower than the 6.7 GHz CH3OH absorption line, with central velocities ranging from to km s-1.
Similar to the CH3OH absorption feature, the 4.8 GHz H2CO absorption is also point-like and centered on N3. However, unlike the CH3OH absorption feature, the H2CO absorption contains two velocity components centered roughly at 3 and +8 km s-1 (Figure 2). Further, the large brightness temperatures in both absorption components (1500 K; the brightness temperature of the H2CO spectrum in Figure 2 was divided by 103 for comparison purposes), and spatial overlap with N3, suggests the absorbed continuum is likely from N3 and not the Cosmic Microwave Background.
3.2 Line-of-sight Arrangement
The detection of both CH3OH and H2CO absorption features indicates some of the molecular gas is located on the near-side of the continuum-emitting source N3. This absorption detection opens back up a possibility ruled out in Ludovici et al. (2016). Ludovici et al. (2016) did not detect any absorption features in their spectral line study and therefore concluded the cloud is located behind N3. Further, their conclusion places N3 in the GC and therefore they ruled out the possibility that N3 is a background AGN. However, the detection of absorption features in our data indicates some of the gas is located on the near-side of N3 and therefore there are no physical arguments that exclude an AGN. Further, the broken power-law spectrum of N3 is also consistent with SEDs of other AGN (Ludovici et al., 2016). Therefore, the possibility that N3 is a background AGN should remain viable.
3.3 CMZ Kinematics on Small Size Scales
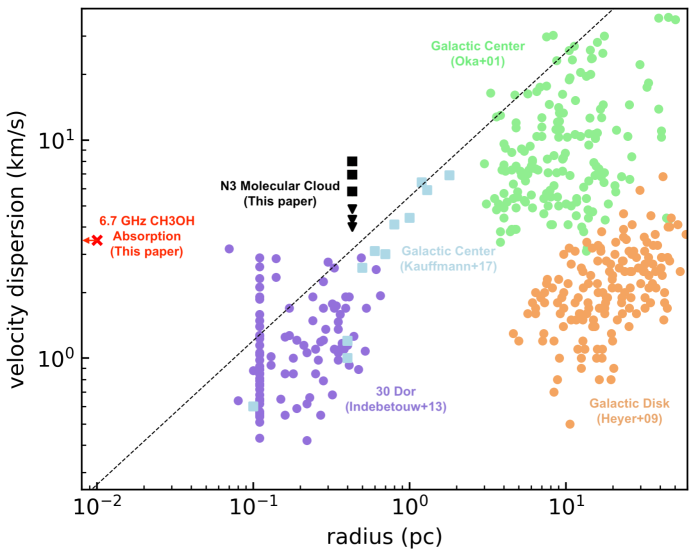
The 6.7 GHz CH3OH absorption feature has an unusually large velocity dispersion, 3.8 km s-1, for the size-scale of the continuum source N3. The Q-band observations in Ludovici et al. (2016) suggest an upper limit to its angular size of 026, implying a maximum size-scale of 2000 AU, or 0.01 pc, at a GC distance of 8 kpc. Figure 4, shows the linewidth-size relationship of clouds from multiple studies compared to the measured linewidth-size of the CH3OH absorption feature (red X).
We can compare our measured velocity dispersion to the predicted velocity dispersion, for a 0.01 pc cross-section size scale, using the following equation from Kauffmann et al. (2017):
| (1) |
where is the effective radius of the region and is the velocity dispersion. This relationship is shown as the dashed line in Figure 3. For a 0.01 pc size scale the predicted velocity dispersion is 0.26 km s-1, roughly an order of magnitude lower than our measurements. Additionally, the measured velocity dispersion is also larger then the estimated sound speed of the gas, 0.6 km s-1, using a gas temperature of 100 K (Ludovici et al., 2016) and equation 1 from Kauffmann et al. (2017). This estimated sound speed value suggests the N3 molecular cloud has a Mach number of 6, indicating the large linewidth is produced by thermal broadening. This Mach number for the N3 cloud is comparable to other clouds in the GC which have a wide range of Mach numbers from 1.5 to 50 (e.g., Mills, 2017; Kauffmann et al., 2017). The detection of a broad spectral line across such a small size scale could indicate that: 1) we are measuring turbulence along the depth of the cloud, 2) we are observing a coherently rotating cloud off-axis, or 3) N3 is a localized source that is producing the broader linewidth. We examine all three scenarios in the following sections.
3.3.1 Scenario 1: Turbulence along the depth of the N3 cloud
| Parameter555Where is the central velocity of the component, is the velocity dispersion and is the peak brightness temperature. | Component 1 | Component 2 |
|---|---|---|
| SiO (10) | ||
| 1.3 0.7 km s-1 | 14.1 1.2 km s-1 | |
| 7.0 0.6 km s-1 | 4.0 1.0 km s-1 | |
| 0.98 0.03 K | 0.30 0.08 K | |
| HC3N (43) | ||
| 0.3 0.5 km s-1 | 12.7 1.2 km s-1 | |
| 5.8 0.4 km s-1 | 4.8 0.8 km s-1 | |
| 1.80 0.06 K | 0.62 0.09 K | |
| CH3OH (10) | ||
| -0.1 1.2 km s-1 | 13.9 0.8 km s-1 | |
| 8.0 1.0 km s-1 | 4.3 0.8 km s-1 | |
| 0.60 0.03 K | 0.38 0.09 K | |
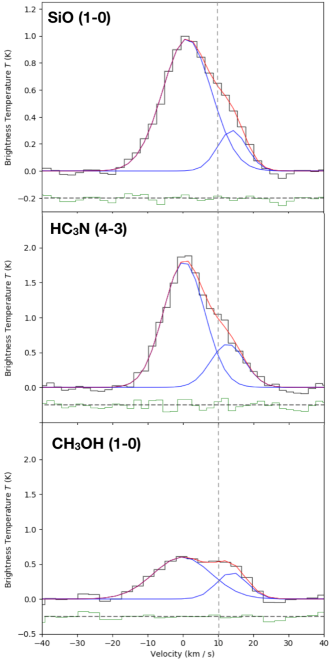
One possible scenario for the difference between the measured and predicted velocity dispersion values of the CH3OH absorption feature is that we are measuring the velocity dispersion across the depth of the cloud, where the thickness of the cloud is larger than the observed cross-section of the point source. If the velocity dispersion is caused by turbulence across the thickness of the cloud, then the velocity dispersion of the pencil beam through the cloud is a 1-D profile. Therefore, the 3-D velocity dispersion would be times larger than the measured 1-D velocity profile, assuming the turbulence is isotropic. In this scenario, the 3-D velocity dispersion, for a 3.84 km s-1 1-D velocity profile, is 6.58 km s-1. Using Equation 1, this velocity dispersion corresponds to a size scale of 1.3 pc. The observed diameter of the N3 molecular cloud is 1025″ (0.41.0 pc; Ludovici et al., 2016), indicating the detected velocity dispersion is roughly comparable for the size-scale of the whole N3 molecular cloud. To test this idea we investigate the kinematics of the entire N3 molecular cloud.
Figure 4 shows the spatially averaged SiO (10), HC3N (43), and CH3OH (10) (data from Ludovici et al., 2016, see their Figure 6) emission spectrum integrated over the whole cloud ( = 112 = 0.43 pc). These spectra were also fit using the python program . The properties of the best-fit Gaussian components are listed in Table 2. All three spectra show two velocity components in the N3 cloud; a low velocity component around 0 km s-1 (Component 1) and a high velocity component around 13 km s-1 (Component 2). The central velocity of Component 2 is comparable to that of the CH3OH absorption feature, indicating the absorption could be associated with this gas component. The velocity dispersion of both components, for all 3 transitions, are plotted on Figure 3. In general, the N3 cloud appears to have a higher velocity dispersion then other GC clouds on similar 0.5-1.0 pc size scales. Our measured velocity dispersion of the CH3OH absorption feature is comparable to the velocity dispersion across the entire cloud. Therefore, the broad linewidth could be produced by turbulence along the depth of the cloud, where the N3 cloud has a thickness of roughly 1 pc at this location.
3.3.2 Scenario 2: Large-scale cloud rotation
Another scenario that could cause the large velocity dispersion detected along a pencil beam through the cloud is a large scale cloud rotation. Observing a coherently rotating cloud off-axis could produce broad lines by blending multiple velocity components through the rotating cloud. To investigate this idea we consider the intensity-weighted velocity distribution (moment 1) across the cloud. If the cloud were rotating we would expect to see a velocity gradient across the cloud as a signature of rotation.
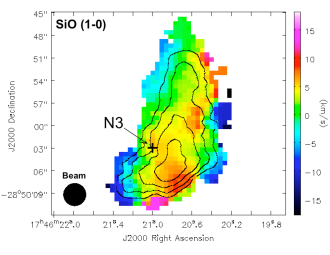
Figure 5 shows the intensity-weighted velocity distribution (moment 1) across the cloud in the SiO (10) transition from Ludovici et al. (2016). Most of the lower velocity emission (below 0 km s-1) is located towards the edge of the cloud, with the higher velocity emission (above 0 km s-1) located towards the center of the cloud. There does not appear to be a large-scale velocity gradient across the entire cloud but rather a gradient from the ‘outside’ inwards. The absence of a large scale velocity gradient across the cloud suggests that the large velocity dispersion is not due to cloud rotation.
3.3.3 Scenario 3: N3 embedded in the molecular cloud
Lastly, a broad absorption feature could be produced if N3 is in the molecular cloud, assuming N3 is located in the GC. In this case the compact-source would be enveloped in molecular material and surrounded by the two velocity components, discussed in Section 3.3.1, which could represent the near and far sides of the cloud. If N3 was a massive compact object the broad linewidth on the 0.01 pc size scale could be caused by the gravitational interaction between the gas and N3. Additionally, the morphology of the cloud, which appears to wrap around N3 (e.g., see Figure 5), may support this claim.
However, this described scenario disagrees with our H2CO observations presented in Section 2. The two H2CO absorption components are comparable to the two velocity components averaged over the entire cloud (see discussion in Section 3.3.1, Figure 4, and Table 2). The detection of absorption in both velocity components is consistent with the cloud being located in front of the N3 point source. The lack of a distinct secondary component in the CH3OH transition could be due to differences in the gas properties between the two velocity components (e.g., temperature). The residuals of the CH3OH fitted spectrum are consistently negative between 10 and 0 km s-1, hinting there could be a secondary component at this velocity range. However, the depth of this feature is at the 1 level (2 K). Higher sensitivity 6.7 GHz CH3OH observations are needed to determine if this feature is a secondary absorption component. Additional follow up observations at high spectral resolution in multiple transitions are also necessary to investigate possible causes for the variation in the gas properties in the two components of the cloud.
4 Summary
We present the detection of 6.7 GHz CH3OH and 4.8 GHz H2CO absorption towards the ‘N3’ point-source (see Section 3.1). The N3 point-source is located towards the Galactic Center Radio Arc and is unresolved at an angular size of 026 ( 0.01 pc for a source in the Galactic Center, Ludovici et al., 2016). The detection of the absorption features indicates that some of the gas in the N3 molecular cloud is located in front of the point source N3 (Section 3.2). We also compare the kinematics of this absorption feature to the Larson size-linewidth relationship (Section 3.3). The Larson size-linewidth relationship suggests a velocity dispersion of 0.26 km s-1 for a size scale of 0.01 pc. However, fitting the kinematics of the CH3OH absorption feature indicates a velocity dispersion of 3.8 km s-1, an order of magnitude higher then predicted. We argue this relatively broad velocity dispersion is caused by turbulence along the depth of the cloud, where the thickness of the cloud is larger then the cross-section of the absorption feature. Analysis presented in Section 3.3.1 suggests the N3 cloud has a thickness of roughly 1 pc. Further, the detection of 4.8 GHz H2CO absorption towards both velocity components of the N3 cloud is consistent with N3 being located behind the entire cloud. Therefore, N3 could be a background AGN.
5 Acknowledgements
ATB would like to acknowledge the funding provided from the European Union’s Horizon 2020 research and innovation programme (grant agreement No 726384). DL would like to thank Katana Colledge for her assistance in setting up the VLA observations used to make the H2CO data cube. We would also like to thank Dr. Alexei Kritsuk and Dr. Juergen Ott for their helpful insight on these results. NB would also like to thank Dr. Drew Medlin at NRAO for assisting with pipeline calibration. We would also like to thank the anonymous reviewer for their helpful comments on this work.
References
- Abuter et al. (2019) Abuter, R., Amorim, A., Anugu, N., et al. 2019, in Highlights on Spanish Astrophysics X, 609–610. https://arxiv.org/abs/1904.05721
- Butterfield et al. (2018) Butterfield, N., Lang, C. C., Morris, M., Mills, E. A. C., & Ott, J. 2018, ApJ, 852, 11, doi: 10.3847/1538-4357/aa886e
- Caswell et al. (2010) Caswell, J. L., Fuller, G. A., Green, J. A., et al. 2010, MNRAS, 404, 1029, doi: 10.1111/j.1365-2966.2010.16339.x
- Ginsburg & Mirocha (2011) Ginsburg, A., & Mirocha, J. 2011, PySpecKit: Python Spectroscopic Toolkit, Astrophysics Source Code Library. http://ascl.net/1109.001
- Ginsburg et al. (2016) Ginsburg, A., Henkel, C., Ao, Y., et al. 2016, A&A, 586, A50, doi: 10.1051/0004-6361/201526100
- Heyer et al. (2009) Heyer, M., Krawczyk, C., Duval, J., & Jackson, J. M. 2009, ApJ, 699, 1092, doi: 10.1088/0004-637X/699/2/1092
- Impellizzeri et al. (2008) Impellizzeri, C. M. V., Henkel, C., Roy, A. L., & Menten, K. M. 2008, A&A, 484, L43, doi: 10.1051/0004-6361:200809985
- Indebetouw et al. (2013) Indebetouw, R., Brogan, C., Chen, C.-H. R., et al. 2013, ApJ, 774, 73, doi: 10.1088/0004-637X/774/1/73
- International Consortium Of Scientists (2011) International Consortium Of Scientists. 2011, CASA: Common Astronomy Software Applications, Astrophysics Source Code Library. http://ascl.net/1107.013
- Kauffmann et al. (2017) Kauffmann, J., Pillai, T., Zhang, Q., et al. 2017, A&A, 603, A89, doi: 10.1051/0004-6361/201628088
- Larson (1981) Larson, R. B. 1981, MNRAS, 194, 809, doi: 10.1093/mnras/194.4.809
- Lu et al. (2019) Lu, X., Mills, E. A. C., Ginsburg, A., et al. 2019, ApJS, 244, 35, doi: 10.3847/1538-4365/ab4258
- Ludovici et al. (2016) Ludovici, D. A., Lang, C. C., Morris, M. R., et al. 2016, ApJ, 826, 218, doi: 10.3847/0004-637X/826/2/218
- Menten (1991) Menten, K. M. 1991, ApJ, 380, L75, doi: 10.1086/186177
- Mills (2017) Mills, E. A. C. 2017, arXiv e-prints, arXiv:1705.05332. https://arxiv.org/abs/1705.05332
- Mills & Morris (2013) Mills, E. A. C., & Morris, M. R. 2013, ApJ, 772, 105, doi: 10.1088/0004-637X/772/2/105
- Oka et al. (2001) Oka, T., Hasegawa, T., Sato, F., et al. 2001, ApJ, 562, 348, doi: 10.1086/322976
- Pandian et al. (2008) Pandian, J. D., Leurini, S., Menten, K. M., Belloche, A., & Goldsmith, P. F. 2008, A&A, 489, 1175, doi: 10.1051/0004-6361:200810556
- Rickert et al. (2019) Rickert, M., Yusef-Zadeh, F., & Ott, J. 2019, MNRAS, 482, 5349, doi: 10.1093/mnras/sty2901
- Shetty et al. (2012) Shetty, R., Beaumont, C. N., Burton, M. G., Kelly, B. C., & Klessen, R. S. 2012, MNRAS, 425, 720, doi: 10.1111/j.1365-2966.2012.21588.x
- Staguhn et al. (2019) Staguhn, J., Arendt, R. G., Dwek, E., et al. 2019, ApJ, 885, 72, doi: 10.3847/1538-4357/ab451b
- Whiteoak & Gardner (1979) Whiteoak, J. B., & Gardner, F. F. 1979, MNRAS, 188, 445, doi: 10.1093/mnras/188.3.445
- Yusef-Zadeh & Morris (1987) Yusef-Zadeh, F., & Morris, M. 1987, AJ, 94, 1178, doi: 10.1086/114555