BETA: A Large Benchmark Database Toward SSVEP-BCI Application
Abstract
1
Brain-computer interface (BCI) provides an alternative means to communicate and it has sparked growing interest in the past two decades. Specifically, for Steady-State Visual Evoked Potential (SSVEP) based BCI, marked improvement has been made in the frequency recognition method and data sharing. However, the number of pubic database is still limited in this field. Therefore, we present a BEnchmark database Towards BCI Application (BETA) in the study. The BETA database is composed of 64-channel Electroencephalogram (EEG) data from 70 subjects performing a 40-target cued-spelling task. The design and acquisition of BETA is in pursuit of meeting the demand from real-world applications and it can be used as a test-bed for these scenarios. We validate the database by a series of analysis and conduct the classification analysis of eleven frequency recognition methods on BETA. We recommend to use the metric of wide-band Signal-to-noise ratio (SNR) and BCI quotient to characterize the SSVEP at the single-trial and population level, respectively. The BETA database can be downloaded from the website http://bci.med.tsinghua.edu.cn/download.html.
2 Keywords:
Brain-computer interface (BCI), Steady-state visual evoked potential (SSVEP), Electroencephalogram (EEG), Public database, Frequency recognition, Classification algorithms, Signal-to-noise ratio (SNR)
3 Introduction
Brain-Computer Interface (BCI) provides a new way of brain interaction with the outside world by measuring and converting brain signals to external commands without the involvement of peripheral nervous system (Wolpaw et al. (2002)). The technology of BCI has considerable scientific significance and application prospect, especially on rehabilitation (Ang and Guan (2013); Lebedev and Nicolelis (2017)) and as an alternative access method for the physically disabled (Pandarinath et al. (2017); Gao et al. (2003)). Steady-State Visual Evoked Potential (SSVEP) is a stable neural response elicited by periodic visual stimuli and the frequency tagging attribute can be leveraged in BCI (Norcia et al. (2015); Cheng et al. (2002)). Among a variety of BCI paradigms, SSVEP based BCI (SSVEP-BCI) has gained widespread attention due to its non-invasiveness, high signal-to-noise ratio (SNR) and high information transfer rate (ITR) (Bin et al. (2009); Chen et al. (2015a)). Generally, the high-speed performance of BCI is accomplished by a multi-target visual speller, which achieves a reportedly average online ITR of 5.42 bit per second (bps) (Nakanishi et al. (2018)). Besides, the ease of use and significantly lower rate of BCI illiteracy (Lee et al. (2019)) make it a promising candidate for real-world applications.
To push the boundary of BCI toward the goal, rapid progress has been made to facilitate frequency recognition of SSVEP (see review (Zerafa et al. (2018))). Based on whether a calibration or training phase is required for the extraction of spatial filters, the signal detection methods can be categorized into supervised methods and training-free methods. The supervised methods exploit an optimal spatial filter by a training procedure and achieve the state-of-the-art classification performance in SSVEP-based BCI (Nakanishi et al. (2018); Wong et al. (2019)). These spatial filters or projection direction can be learned by exploiting individual training template (Bin et al. (2011)), reference signal optimization (Zhang et al. (2013)), inter-frequency variation (Yin et al. (2015)), ensemble reference signals (Nakanishi et al. (2014); Chen et al. (2015a)) in the framework of canonical correlation analysis (CCA). Recently, task-related components (Nakanishi et al. (2018)) and multiple neighboring stimuli (Wong et al. (2019)) are utilized to derive spatial filters to further boost the discriminative power of the learned model. On the other hand, training-free methods perform feature extraction and classification in one shot without the training session in online BCI. This line of work usually use a sinusoidal reference signal and the detection statistics can be derived from canonical correlation (Bin et al. (2009)) and its filter-bank form (Chen et al. (2015b)), noise energy minimization (Friman et al. (2007)), synchronization index maximization (Zhang et al. (2014)), and additional spectral noise estimation (Abu-Alqumsan and Peer (2016)), etc.
Along with the flourish of frequency recognition methods, continuous efforts have been devoted to share SSVEP database (Bakardjian et al. (2010); Kołodziej et al. (2015); Kalunga et al. (2016); Kwak et al. (2017); İşcan and Nikulin (2018)) and contribute to public SSVEP database (Wang et al. (2017); Lee et al. (2019); Choi et al. (2019)). Wang et al. (2017) benchmarked a 40-target database comprising 64-channel 5-s SSVEP trial for 35 subjects, each of which performed an offline cue-spelling task in 6 blocks. Recently, Lee et al. (2019) released a larger database of 54 subjects performing a 4-target offline and online task and 62-channel 4-s SSVEP data were obtained with 50 trials per class. Choi et al. (2019) also provided a 4-target database and 6-s SSVEP data with physiological data are collected from 30 subjects at 3 different frequency bands (low: 1–12 Hz; middle: 12–30 Hz; high: 30–60 Hz) across two days. Up to date, the number of public databases in the SSVEP-BCI community is still limited compared to other domains, e.g. computer vision, where a growing number of databases play a critical role on the development of the disciplinary (Russakovsky et al. (2015)). Compared to other BCI paradigms, e.g. motor imagery BCI, the databases for SSVEP-BCI are also scarce (Choi et al. (2019)). Therefore, more databases are necessitated in the realm of SSVEP-BCI for the design and evaluation of methods.
To this end, we present a large BEnchmark database Towards SSVEP-BCI Application (BETA) in this study. The BETA database is composed of 70 subjects in a cued-spelling task. As an extension of the benchmark database (Wang et al. (2017)), the number of targets is 40 and the frequency range is also from 8 to 15.8 Hz. A key feature of the BETA database is that it’s tailored for real-world applications. Different from the benchmark database, the BETA is collected outside the laboratory setting of the electromagnetic shielding room. Since it is imperative to reduce the calibration time from a practical perspective, the number of blocks decreases to 4 instead of 6 in the benchmark. A QWERT virtual keyboard is presented in flicker to better approximate the conventional input device and enhance user experience. To the best of our knowledge, the BETA database has the largest number of subjects for SSVEP-BCI to date. Since a larger database captures the inter-subject variability, the BETA database makes it possible to reflect a more realistic EEG distribution and potentially meet the demands of real-world BCI applications.
The remaining of the paper is organized as follows. First, we detail the procedure of data acquisition and curation in Section 2. Then we describe the data record and availability in Section 3. Third, we perform data validation and then evaluate algorithms by comparing eleven frequency recognition methods on BETA. Finally, Section 4 concludes and we discuss additional findings from the database.
4 Materials and Methods
4.1 Participants
Seventy healthy volunteers (42 males and 28 females) with a mean age of (mean std, ranging from 9 to 64 years) participated in the study. All participants had normal or corrected to normal vision and gave written informed consent before the experiment (for participants under 16 years old the consent was signed by their parents). The study was carried out in accordance with the Declaration of Helsinki and the protocol was approved by the ethics committee of Tsinghua University (No. 20190002).
4.2 Recruitment and Inclusion Criteria
Participants were recruited on a national scale to take part in the Brain-Computer Interface 2018 Olympics in China. The competition was hold to contest and award individuals with high performance of BCI (SSVEP, P300 and Motor Imagery). The seventy participants are those who participated in the second round of the contest (SSVEP-BCI track) and all are not naive to SSVEP-BCI. Before enrollment, participants were informed that the data would be used for non-commercial scientific research. Participants who conformed to the experimental rules in the first round and were available to the schedule of the contest were included for the second round. All the participants met the following criteria: (1) no history of epileptic seizures or other neuropsychiatric disorders (2) no attention-deficit or hyperactivity disorder (3) no history of brain injury or intracranial implantation.
4.3 Visual Speller
This study designed a 40-target BCI speller for visual stimulation. To facilitate the user experience, the graphical interface was designed to resemble the traditional QWERT keyboard. The keyboard was presented on a 27-inch LED monitor (ASUS MG279Q Gaming Monitor, 19201080 pixels) at a fresh rate of 60 Hz. As illustrated in Figure1A, 40 targets including 10 numbers, 26 alphabets and 4 non-alphanumeric keys (dot, comma, backspace < and space _) were aligned in 5 rows, with a spacing of 30 pixels. The stimuli had the dimension of 136136 pixels (3.1°3.1°) for the square and 966136 pixels (21°3.1°) for the space rectangle. The topmost blank rectangle was for result feedback.
A sampled sinusoidal stimulation method (Manyakov et al. (2013); Chen et al. (2014)) was adopted to present visual flicker on the screen. In general, the stimulus sequence of each flicker can be generated by the following equation
| (1) |
where indicates the frame index in the stimulus sequence, and and indicate the frequency and phase values of the encoded flicker using a joint frequency and phase modulation (JFPM) (Chen et al. (2015a)). The grayscale value of stimulus sequence ranges from 0 to 1, where 0 indicates dark and 1 indicates the highest luminance of the screen. For the 40 targets, the tagged frequency and phase values can be obtained by
| (2) |
where the frequency interval is 0.2 Hz and phase interval is 0.5 . denotes the index from dot, comma and backspace, followed by a to z and 0 to 9, and space. In the study, and is set 8 Hz and 0, respectively. The parameters for each target are illustrated in Figure1B. The stimulus was presented by MATLAB (MathWorks, Inc.) using Psychophysics Toolbox Version 3 (Brainard (1997)).
4.4 Procedure
This study consisted of 4 blocks of online BCI experiment using a cued-spelling task. Each block was composed of 40 trials corresponding to 1 trial for each stimulus target in a randomized order. Trials began with a 0.5-s cue (a red square covering the target) for gaze shift, followed by flickering on all the targets, and ended with 0.5 s for rest. Participants are asked to avoid eye blink during the flickering. During the 0.5-s rest, result feedback (one of the recognized characters) was presented in the topmost rectangle after online processing by a modified version of the FBCCA method (Chen et al. (2015b)). The flickering lasted at least 2 s for the first 15 participants (S1 - S15) and at least 3 s (S16 - S70) for the remaining 55 participants. To avoid visual fatigue, there was a short break between two consecutive blocks.
4.5 Data Acquisition
64-channel EEG data were recorded by SynAmps2 (Neuroscan Inc.) according to the international 10-10 system. The sampling rate was set 1000 Hz and the passband of hardware filter was 0.15-200Hz. A built-in notch filter was applied to remove 50-Hz power-line noise. Event triggers were sent from the stimulus computer to the EEG amplifier and synchronized to the EEG data by a parallel port as an event channel. All impedance of the electrodes was kept below 10 k. The vertex electrode Cz was used as a reference. During the online experiment, nine parietal and occipital channels (Pz, PO3, PO5, PO4, PO6, POz, O1, Oz and O2) were selected for online analysis to provide feedback result. To record EEG data in real-world scenarios, the data were recorded outside the electromagnetic shielding room.
4.6 Data Preprocessing
The previous study demonstrates that SSVEP harmonics in this paradigm have the frequency range up to around 90 Hz (Chen et al. (2015a),Chen et al. (2015b)). Based on the finding, a band-pass filtering (zero-phase forward and reverse filtering using eegfilt in EEGLAB (Delorme and Makeig (2004)) between 3 Hz and 100 Hz was conducted to remove environmental noise. Epochs were then extracted from each block, comprising 0.5 s before the stimulus onset, 2 s (for S1 - S15) or 3 s (for S16 - S70) of stimulation, and a subsequent 0.5 s. The subsequent 0.5 s may contain SSVEP data if the duration of the trial is greater than 2 s (for S1 - S15) or 3 s (for S16 - S70). Since frequency resolution does not affect the classification result of SSVEP (Nakanishi et al. (2017)), all the epochs were then down-sampled to 250 Hz.
4.7 Metrics
The quality of SSVEP data can be evaluated quantitatively by signal-to-noise ratio (SNR) analysis and classification analysis. In the SNR analysis, most of the previous studies (Chen et al. (2015b, a); Xing et al. (2018)) adopted the narrow-band SNR metric. The narrow-band SNR (in decibels, dB) is defined as the ratio of spectral amplitude at stimulus frequency to the mean value of the ten neighboring frequencies (Chen et al. (2015b))
| (3) |
where is the amplitude spectrum at frequency calculated by Fast Fourier Transform (FFT), and is the frequency resolution.
Based on the narrow-band SNR, we use the wide-band SNR as a primary metric to better characterize wide-band noise and the contribution of harmonics to the signals. The wide-band SNR (in decibels, dB) is defined as follows
| (4) |
where is the number of harmonics, is the power spectrum at frequency and is the Nyquist frequency. In the wide-band SNR, the sum of power spectrum of multiple harmonics () is regarded as signals and the energy of full spectral band subtracted from the signals is taken as noise.
Classification accuracy and information transfer rate (ITR) are widely used in the BCI community to assess the performance of different subjects as well as algorithms. The ITR (in bits per min, bpm) can be obtained by (Wolpaw et al. (2002))
| (5) |
where is the number of classes, is the classification accuracy and (in seconds) is the average time for a target selection. The in the equation comprises gaze time and overall gaze shift time (e.g. 0.55 s in line with the previous studies (Wang et al. (2017); Chen et al. (2015b))).
5 Record Description
The database is freely available at http://bci.med.tsinghua.edu.cn/download.html for scientific research and it is stored as MATLAB mat format. The database contains 70 subjects and each subject corresponds to a mat file. The name of subjects are mapped to indices from S1 to S70 for de-identification. Each file consists of a MATLAB structure array, with 4-block EEG data and its counterpart supplementary information as its fields.
5.1 EEG Data
EEG data after preprocessing are store as a 4-way tensor, with a dimension of channel time point block condition. Each trial comprises 0.5-s data before the event onset and 0.5-s data after the time window of 2 s or 3 s. For S1-S15, the time window is 2 s and the trial length is 3 s, whereas for S16-S70 the time window is 3 s and the trial length is 4 s. Additional details about the channel and condition information can be found in the following supplementary information.
5.2 Supplementary Information
Eight supplementary information is comprised of personal information, channel information, frequency and initial phase associated to each condition, SNR and sampling rate. The personal information contains age and gender of the subject. For the channel information, a location matrix (64 4) is provided, with the first column indicating channel index, the second column and third column indicating the degree and radius in polar coordinates, and the last column indicating channel name. The SNR information contains the mean narrow-band SNR and wide-band SNR matrix for each subject, calculated in (3) and (4), respectively. The initial phase is in radius.
6 Data Evaluation
6.1 Temporal, Spectral and Spatial Analysis
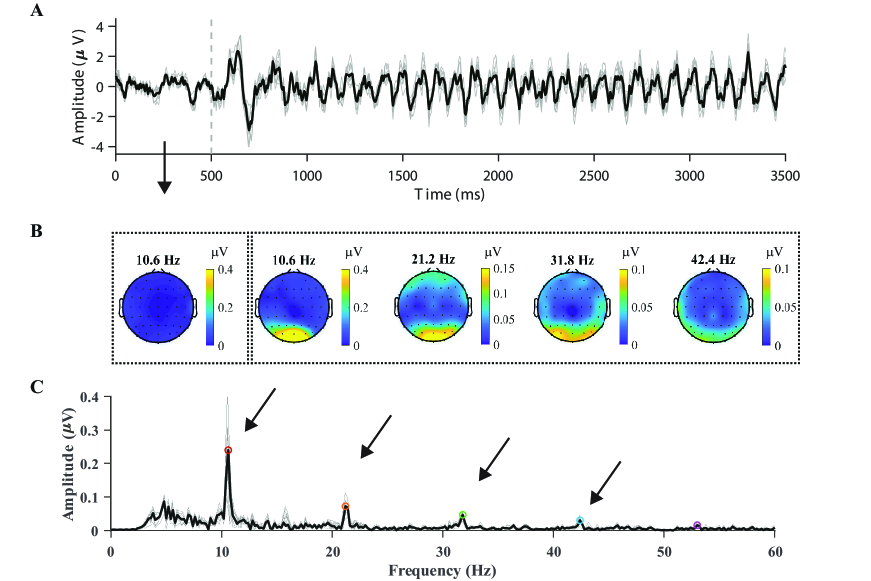
To validate the data quality by visual inspection, nine parietal and occipital channels (Pz, PO3, PO5, PO4, PO6, POz, O1, Oz and O2) are selected and epochs are averaged with respect to the channels, blocks, and subjects. For consistency in data format, the subjects from S16 to S70 are chosen. Figure 2A illustrates the averaged temporal amplitude for one stimulus frequency (10.6 Hz). After a delay (within 100-200 ms) at the stimulus onset, a steady-state and time-locked characteristic can be observed in the temporal sequence (Figure 2A). Data between 500 ms and 3500 ms are extracted and padded with 2000-ms zeros to yield a 0.2-Hz spectral resolution in Figure 2C. From the amplitude spectrum, the fundamental frequency (10.6 Hz: 0.266 ) and three harmonics (21.2 Hz: 0.077 , 31.8 Hz: 0.054 , 42.4 Hz: 0.033 ) are distinguishable from background EEG. Note that for high frequencies (60Hz), both the harmonic signals and noise are small in amplitude due to the volume conduct effect (Broek et al. (1998)) and are not shown here.
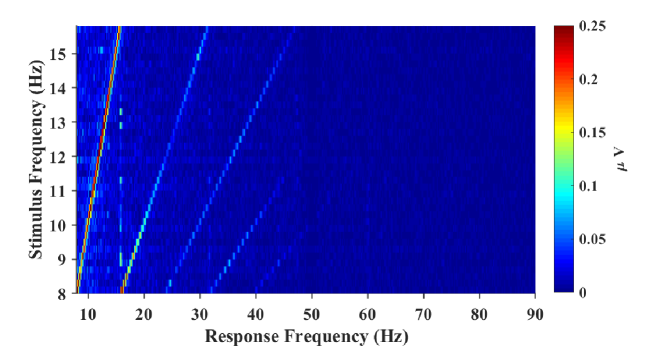
Figure 2B illustrates topographic mappings of the spectrum at frequencies from fundamental signal to fourth harmonic. This indicates that fundamental and harmonic signals of SSVEP are distributed predominantly in the parietal and occipital regions. Frontal and temporal regions of the topographic maps also show an increase in the spectrum, which may represent noise or propagation of SSVEP oscillation from the occipital region (Thorpe et al. (2007); Liu et al. (2017)). To characterize response property of SSVEP, the amplitude spectrum as a function of stimulus frequency is plotted and illustrated in Figure 3. From the amplitude spectrum, the spectral response of SSVEP decreases rapidly as the number of harmonics increases (up to 5 harmonics are visible). A dark line at 50-Hz response frequency results from notch filtering. A bright line at 15.8-Hz response frequency may be distractor stimulus from the SPACE target with a larger size.
6.2 SNR Analysis
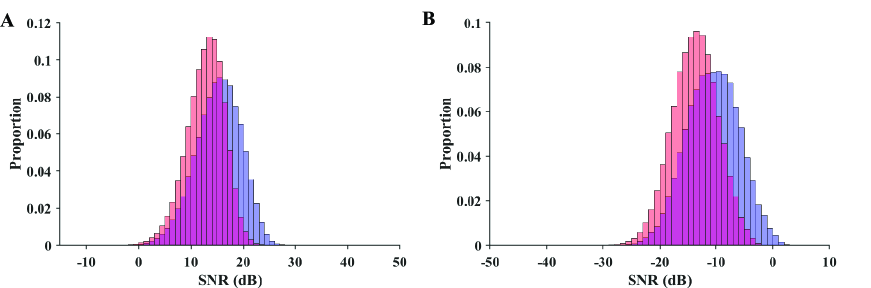
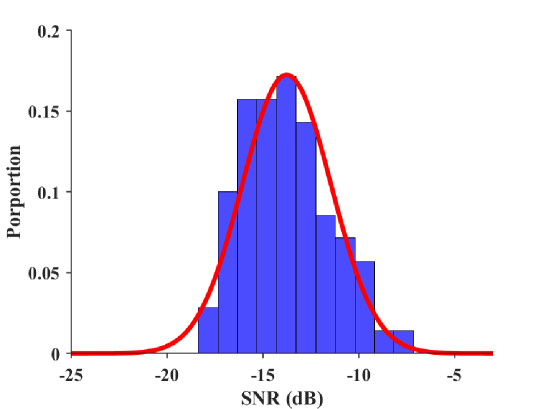
As a metric independent of different classification algorithms, SNR measures available stimulus-evoked components in SSVEP spectrum. For SNR analysis, we compare the BETA database with the benchmark database for SSVEP-based BCI (Wang et al. (2017)). Narrow-band SNR and wide-band SNR are calculated by (3) and (4) respectively for each trial. For a valid comparison, EEG in the benchmark database are band-pass filtered between 3 Hz and 100 Hz (eegfilt in EEGLAB) before epoching. Trials in this database are padded with zeros (3s for S1-S15, 2s for S16-S70) to yield a spectral resolution of 0.2 Hz. Figure 4 illustrates the normalized histogram of narrow-band SNR (A) and wide-band SNR (B) for trials in the two databases. For narrow-band SNR, the BETA database has a significantly lower SNR (4.0190.018 dB) than that of benchmark database (8.1850.024 dB), with a p-value (two-sample unpaired t-test). Similarly, the wide-band SNR in the BETA database (-13.7580.013 dB) is significantly lower than that of benchmark database (-10.62870.017 dB), with a p-value (two-sample unpaired t-test). This is due in part to individual differences in SNR for the two studies and EEG is recorded outside the electromagnetic shielding room in the BETA database. The comparable results of the two SNRs also demonstrate the validity of the wide-band SNR metric that takes additional information of wide-band noise and harmonics into account.
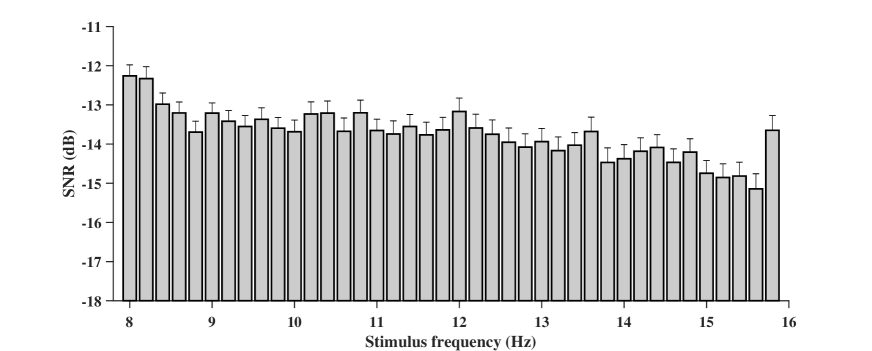
In addition, we analyze the characteristics of SNR with respect to each stimulus frequency. For the BETA database, the wide-band SNR is calculated by each zero-padded trial and the SNR associated with each condition is obtained by average per block and per person. Figure 5 illustrates the wide-band SNR corresponding to the 40 stimulus frequencies. In general, a tendency of decline in SNR can be observed as the stimulus frequency increases. For some stimulus frequencies, e.g. 11.6 Hz, 10.8 Hz, 12 Hz and 9.6 Hz, the SNR bumps up compared to their adjacent frequencies. Specifically, the SNR at 15.8 Hz is elevated by an average of 1.49 dB compared to 15.6 Hz, presumably due in part to the larger shape of the region for visual stimulation.
6.3 Phase and Visual Latency Estimation
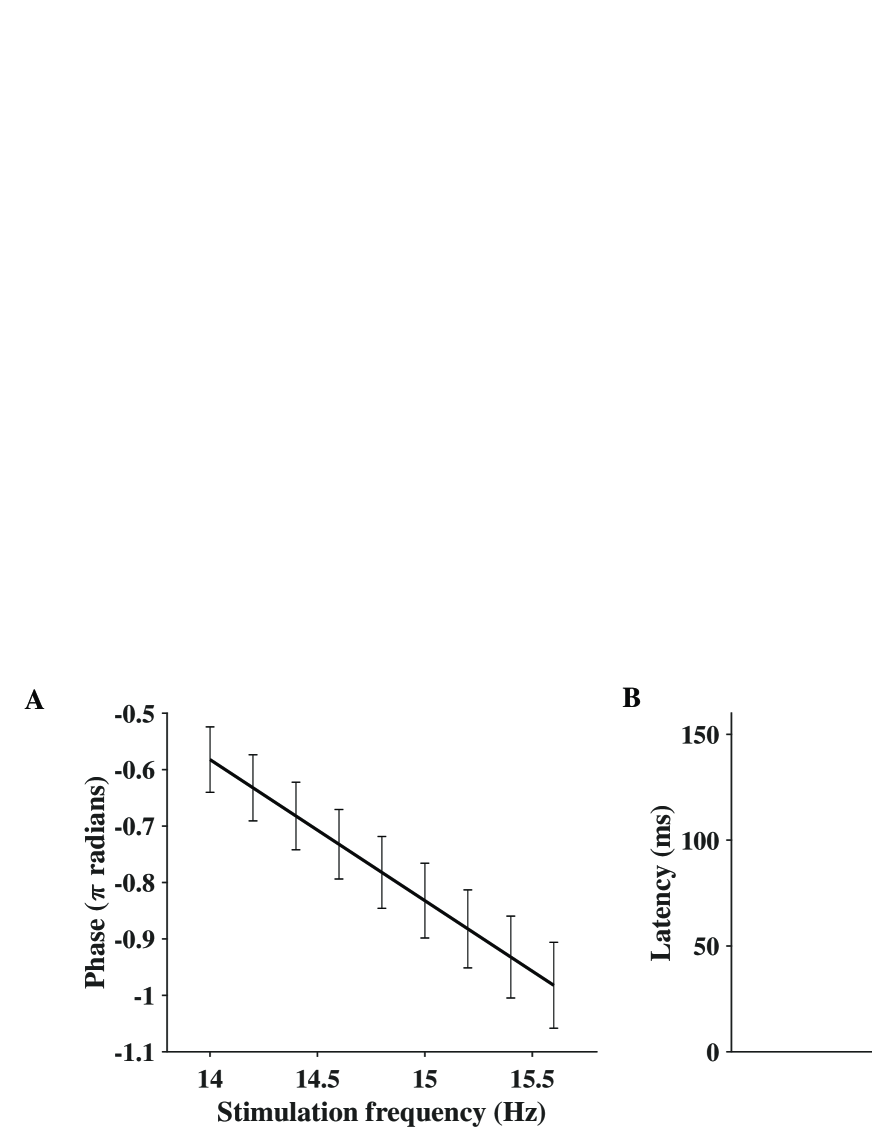
To further make a comparison with the benchmark database in the previous study (Wang et al. (2017)), we conduct an estimation of phase and visual latency in the BETA database. Nine consecutive stimulus frequencies in row 1 of the keyboard are selected and the SSVEP from Oz channel (70 subjects) is extracted for analysis. The procedure is performed according to the previous study (Wang et al. (2017)) using a linear regression between the estimated phase and stimulus frequency (Di Russo and Spinelli (1999)). The visual latency for each subject can be estimated by the slope of the linear regression in the form
| (6) |
Figure 6 illustrates the phase as a function of stimulus frequency and the bar plot of estimated latencies from (6). The mean estimated visual latency in this study is 124.96 14.81 ms, which is close to 136.91 18.4 ms in the benchmark database (Wang et al. (2017)) and approximates to 130 ms. Therefore, a 130-ms latency is added to SSVEP epochs for the following classification analysis.
6.4 Accuracy and ITR on Various Algorithms
In this study, eleven frequency recognition methods, including six supervised methods and five training-free methods, are adopted to evaluate the BETA database. For S1-S15, 2-s length of epochs is used for analysis and for S16-S70 the epoch length is 3 s. A sliding window from the stimulus onset (latency corrected) with an interval of 0.2 s is applied to epochs for offline analysis.
6.4.1 Supervised methods
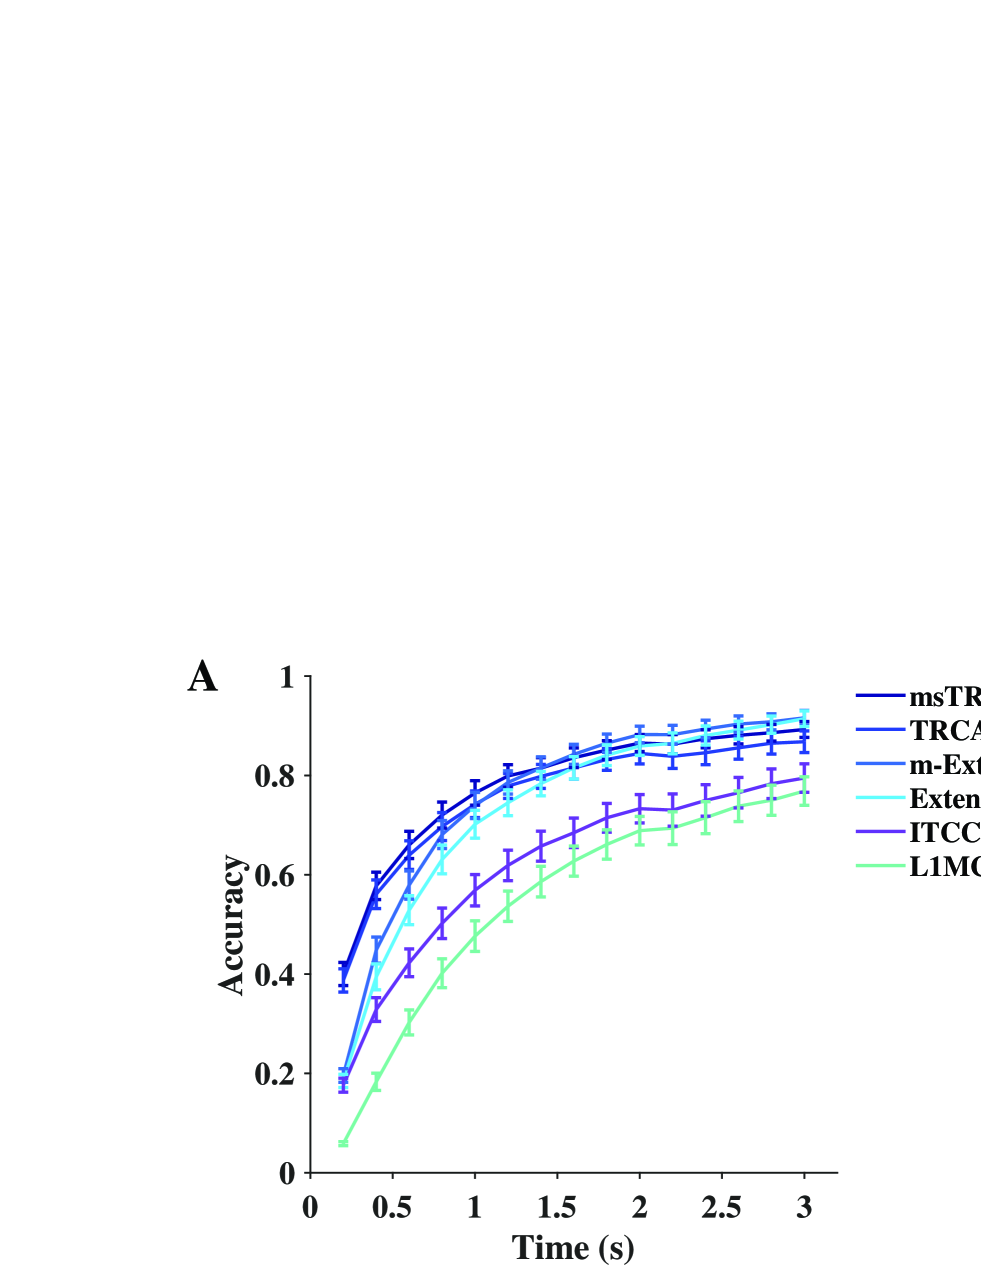
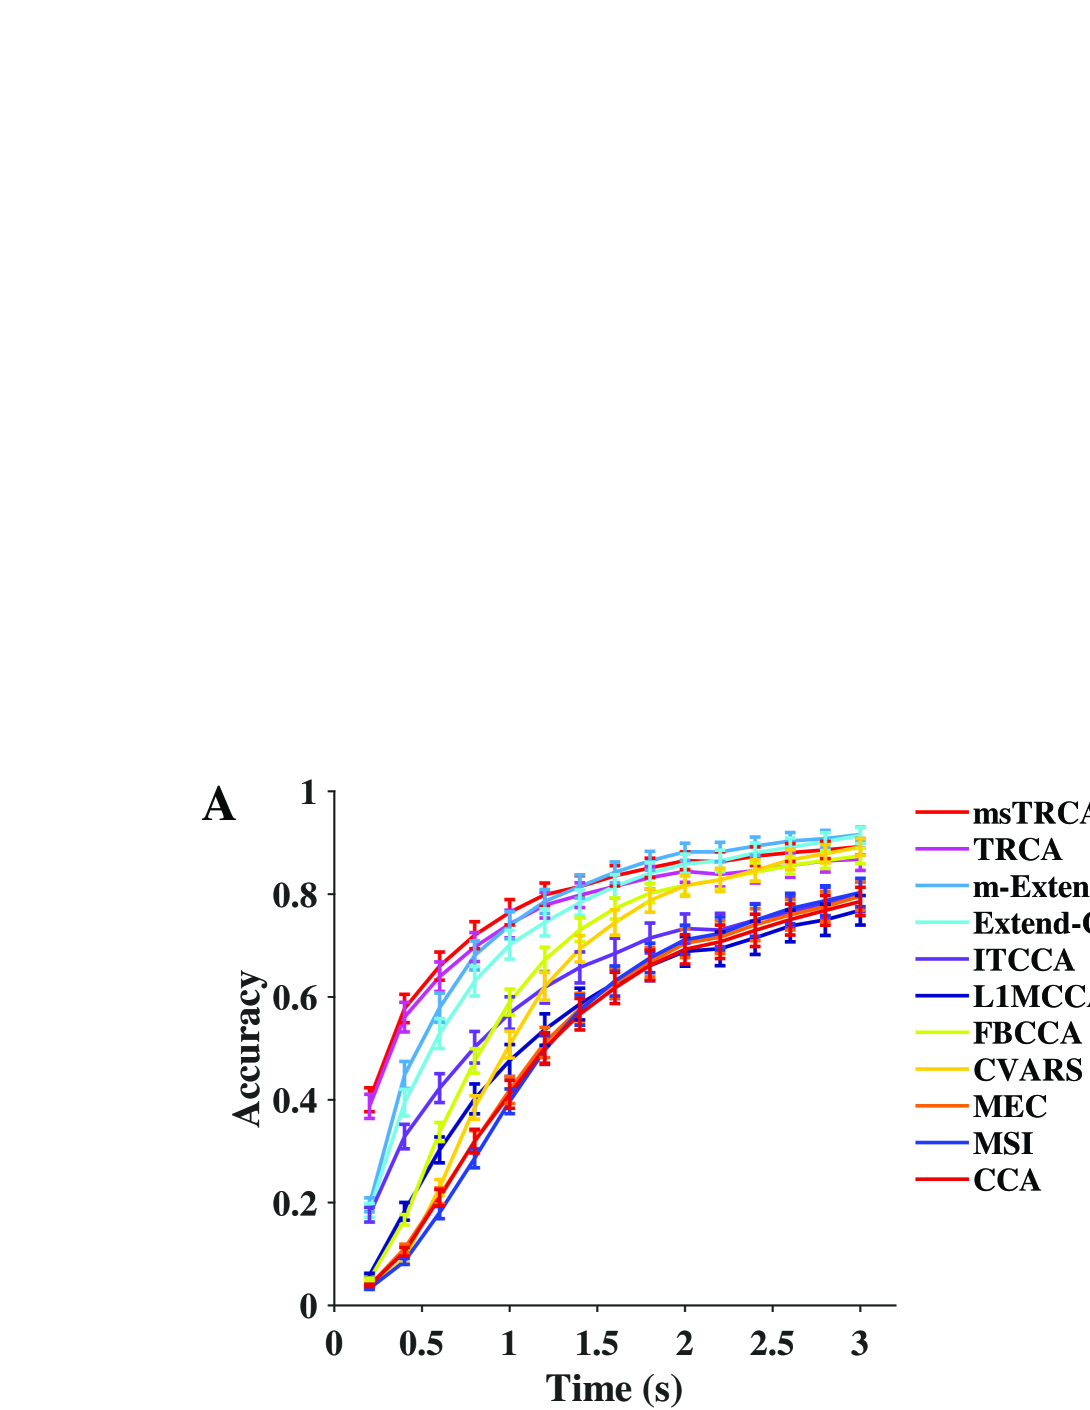
We choose six supervised methods including task-related component analysis (TRCA, Nakanishi et al. (2018)), multi-stimulus task-related component analysis (msTRCA, Wong et al. (2019)), Extended CCA (Nakanishi et al. (2014)), modified Extended CCA (m-Extended CCA, Chen et al. (2015a)), L1-regularized multiway CCA (L1MCCA, Zhang et al. (2013)) and individual template-based CCA (IT-CCA, Bin et al. (2011)) for comparison. To calculate accuracy and ITR, a leave-one-out procedure on four blocks is applied to each subject. Figure 7 illustrates the average accuracy (A) and ITR (B) for supervised methods. The result shows that msTRCA outperforms other methods in data lengths less than 1.4 s and m-Extended CCA achieves the highest performance in data lengths from 1.6 s to 3 s. One-way repeated measures ANOVA reveals that there are significant differences between these methods in accuracy and ITR for all time windows. Specifically, for short time window at 0.6 s, post hoc paired t-tests show that msTRCA >TRCA >m-Extended CCA >Extended CCA >ITCCA >L1MCCA in accuracy and ITR. Here ’>’ indicates is less than 0.05 in ITR with Bonferroni correction for pairwise comparison between the two sides. For a medium-length time window at 1.4 s, post hoc paired t-tests show that m-Extended CCA >msTRCA >Extended CCA / TRCA >ITCCA >L1MCCA (Extended CCA vs TRCA: in ITR; Bonferroni corrected). The data length of highest ITR varies between different methods (msTRCA: 145.26 8.15 bpm at 0.6 s, TRCA: 139.58 8.52 bpm at 0.6 s, m-Extended CCA: 130.58 7.53 bpm at 0.8 s, Extended CCA: 119.17 6.67 bpm at 1 s, ITCCA: 88.72 6.75 bpm at 1 s, L1MCCA: 73.42 5.31 bpm at 1.4 s).
6.4.2 Training-free methods
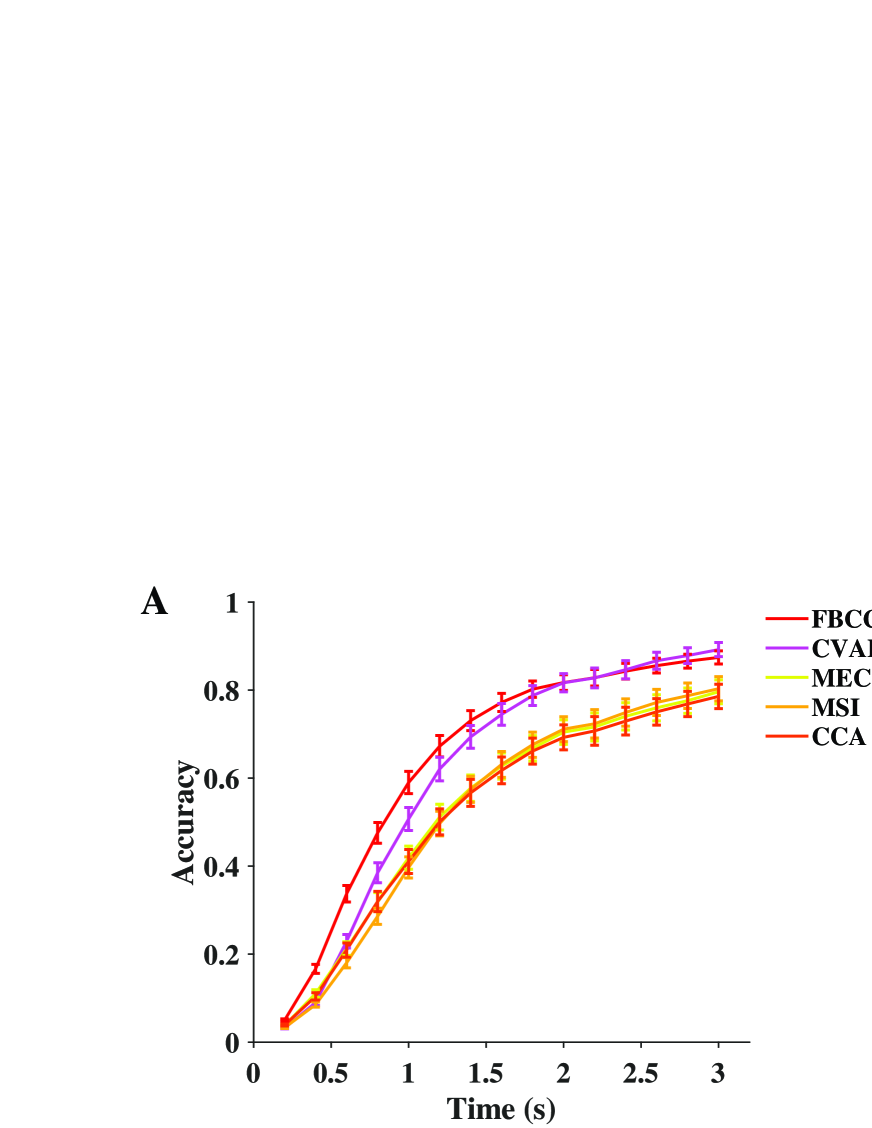
In this study, we compare five training-free methods, including minimum energy combination (MEC, Friman et al. (2007)), canonical correlation analysis (CCA, Bin et al. (2009)), multivariate synchronization index (MSI, Zhang et al. (2014)), filter bank canonical correlation analysis (FBCCA, Chen et al. (2015b)) and canonical variates with autoregressive spectral analysis (CVARS, Abu-Alqumsan and Peer (2016)). As illustrated in Figure 8, FBCCA is superior over other methods in data lengths less than 2 s and CVARS outperforms others from 2s to 3s. Significant differences are found between these methods in accuracy and ITR by one-way repeated measures ANOVA for all data lengths. Post hoc paired t-tests show that FBCCA >CVARS >CCA / MSI / MEC in ITR for medium data length at 1.4s, (Bonferroni corrected) for all pairwise comparisons except CCA vs MSI (), CCA vs MEC (), MSI vs MEC () in ITR. For training-free methods, the highest ITR is achieved after 1.2 s (FBCCA: 98.79 4.49 bpm at 1.4 s, CVARS: 93.08 4.39 bpm at 1.6 s, CCA: 72.54 4.54 bpm at 1.8 s, MSI: 74.54 4.46 bpm at 1.8 s, MEC: 73.23 4.43 bpm at 1.8 s).
Note that for TRCA and msTRCA, the ensemble and filter-bank scheme are employed as the default. For fair comparison, the number of harmonics is set 5 in all the methods with sinusoidal templates except the m-Extended CCA according to Chen et al. (2015a) (). For all the methods without filter bank scheme, trials are band-pass filtered between 6 Hz and 80 Hz in line with the previous study (Nakanishi et al. (2015)), except for the CVARS method.
6.5 Correlation between ITR and SNR
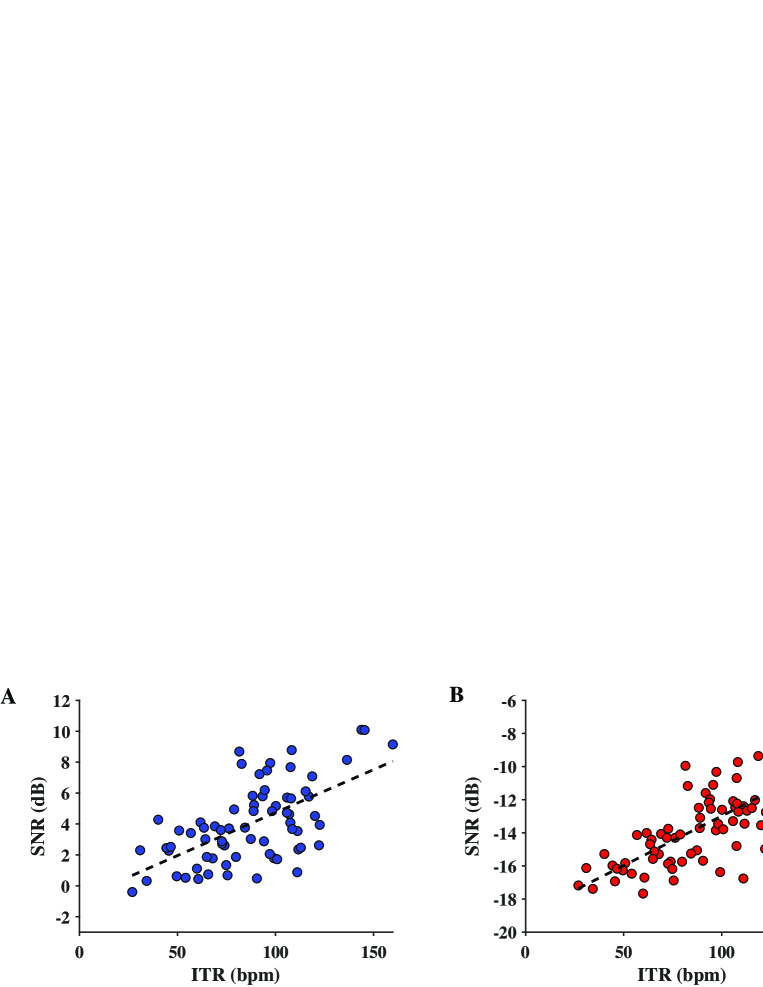
To investigate the relationship between the SNR and ITR metrics, we plot the scatter diagram of ITR with SNR for wide band and narrow band, respectively. The maximum ITR for each subject (after averaging by block) from the training-free FBCCA is chosen for analysis. Figure 9 illustrates the scatter plot of narrow-band SNR vs ITR (A) and wide-band SNR vs ITR (B). As can be seen from the figure, ITR is positively correlated with SNR, either narrow-band or wide-band. We further fit the data with a linear model and the adjusted R squared () that measures the goodness-of-fit can be obtained. The result reveals that an adjusted of 0.368 for the narrow-band SNR (p<0.001) and an adjusted of 0.531 for the wide-band SNR (p<0.001). This indicates that the metric of wide-band SNR is more correlated with and can better predict ITR than narrow-band SNR.
6.6 BCI quotient
Electroencephalographic signals including SSVEP show individual differences in population. In this study, we propose a BCI quotient to characterize the subject’s capacity to use SSVEP-BCI measured at a population level. Equivalent to the scoring procedure of intelligence quotient (IQ) (Wechsler (2008)), the (SSVEP-) BCI quotient is defined as follows
| (7) |
where SNR represents the wide-band SNR, mean and standard deviation in this study (Figure 10). The mean and standard deviation can be estimated more accurately for a larger database in the future. The BCI quotient rescales an individual’s SNR of SSVEP to a range of normal distribution . Since it is a relative value from SNR and SNR is correlated with ITR, the BCI quotient has the potential to measure signal quality and performance for individuals in SSVEP-BCI. Higher values of BCI quotient indicate a higher probability of good BCI performance. For instance, the BCI quotients of S20 and S23 are 74.62 and 139.25, respectively, which reveals a prior the individual level of ITR (59.91 bpm for S20 and 145.41 bpm for S23).
7 Discussion
7.1 Data quality and its applicability
Compared to the benchmark database (Wang et al. (2017)), the BETA database has lower SNR and corresponding ITR in classification (for benchmark database: FBCCA, 117.96 7.78 bpm at 1.2 s; m-Extended CCA, 190.41 7.90 bpm at 0.8 s; CCA, 90.16 6.81 bpm at 1.6s; 0.55-s rest time for comparison (Wang et al. (2017); Chen et al. (2015b))). This is reasonable since in BCI applications there is actually no electromagnetic shielding condition and neither can we ensure that each subject has a high SNR of SSVEP. The discrepancy in SNR is also due in part to the distinct stimulus duration, which is 2s or 3s for the BETA database and 5s for the benchmark database. But even taking the same stimulus duration in to consideration (3-s trial after stimulus onset for 55 subjects in the BETA and 35 subjects in the benchmark), the BETA database is also significantly lower in SNR (narrow-band SNR: BETA 4.3190.021 dB, benchmark 5.2390.020 dB, ; wide-band SNR: BETA -13.5100.015 dB, benchmark -12.6500.015 dB, ). Therefore, the present BETA database poses challenges for traditional frequency recognition methods and also opens up opportunities for the development of robust frequency recognition algorithms in real-world applications. A large number of subjects in BETA has the merit of reducing over-fitting and can provide an unbiased estimation in the evaluation of algorithms. Also, the large volume of BETA provides the substrate for the study of transfer learning to exploit the common discriminative patterns across subjects. Note that the number of blocks of each subject is smaller than that in the benchmark database. Since reducing the training and calibration time is critical for the BCI application, the proposed database can serve as the test-bed for the development of supervised frequency recognition methods based on smaller training samples or few-shot learning. It is noteworthy that the application scenario of BETA database is not limited to the 40-target speller in the study. Practitioners can select a subset of the 40 targets (e.g. 4, 8, 12 targets) and design customized paradigms to suit the need in a variety of real-world applications. With the advent of big data, the BETA has the potential to facilitate modeling the brain at a population level and help develop novel classification approaches or learning methodology, e.g. federated learning (McMahan et al. (2016)) based on the big data.
7.2 Supervised and training-free methods
In general, the state-of-the-art supervised frequency recognition methods have the advantage of higher performance in ITR and the training-free methods excel in ease of use. In this study, two of the supervised methods (m-Extended CCA, Extended CCA) outperform the five training-free algorithms for all data lengths. Specifically, for the short-time window (0.2-1 s) the supervised methods (msTRCA, TRCA, m-Extended CCA, Extended CCA) outperform the training-free methods by a large margin (Supplementary Figure 1). This is because the introduction of EEG training template and learned spatial filters facilitates SSVEP classification. For time window longer than 2 s (2.2-3 s), post hoc paired t-tests show that no significant difference is between m-Extended CCA and Extended CCA, between FBCCA and CVARS, and among ITCCA, CCA, MEC and MSI (p>0.05, Bonferroni corrected). This suggests some common mathematical grounds shared by these algorithms in principle (Wong et al. (2020)). Interestingly, the TRCA method drops in performance as reported in the previous study (Nakanishi et al. (2018)), presumably caused by the lack of sufficient training block for subjects with low SNR. As evidenced by the previous study (Nakanishi et al. (2018)), for TRCA the number of training data greatly affects classification accuracy ( 0.85 with 11 training blocks and 0.65 with two training blocks for 0.3-s time window). This implies that methods with a sinusoidal reference template (e.g. m-Extended CCA, Extended CCA and FBCCA etc.) may be more robust than methods without it. To sum up, the classification analysis in the present study demonstrates the utility of different competing methods on BETA. The comparison of different methods on a single database complements the previous work of Zerafa et al. (2018), where the performance of various methods is not compared on the same database.
7.3 SNR comparison
In the SNR analysis, we find the wide-band SNR more correlated with ITR compared to the narrow-band SNR. From Figure 4, it is worth noting that a transition from narrow-band SNR to wide-band SNR does not change the relative relationship between the SNRs of two databases. Nevertheless, the wide-band SNR metric reduces skewness of data distribution (from -0.719 to -0.096 for benchmark database; from -1.089 to -0.142 for BETA; narrow-band SNR followed by wide-band SNR), which renders the SNR statistic favorably more Gaussian in distribution. Since the spectral power of a signal is equal to its power in the time domain according to the Parseval’s Theorem, the formulated wide-band SNR has equivalent mathematical underpinning as the metric of temporal SNR counterpart. Apart from its expressive power of wide-band SNR, the metric is also intuitive in the description of signal and noise due to the frequency tagging attribute of SSVEP.
8 Concluding remark
Here we present a novel BEnchmark database Towards BCI Application (BETA) for the 40-target SSVEP-BCI paradigm. The BETA database is featured by its large number of subjects and its paradigm that is well-suited for real-world applications. The quality of the BETA is validated by the typical temporal, spectral and spatial profile of SSVEP, together with the SNR and the estimated visual latency. On the BETA database, we compared eleven frequency recognition methods, including 6 supervised methods and 5 training-free methods. The result of the classification analysis validates the data and demonstrates the performance of different methods in one arena as well. As for the metric to characterize SSVEP, we recommend adopting the wide-band SNR at the single-trial level and use the BCI quotient at the population level. We expect the BETA database would be a test-bed for the development of method and paradigm for practical BCI and push the boundary of BCI toward real-world application.
Conflict of Interest Statement
The authors declare that the research was conducted in the absence of any commercial or financial relationships that could be construed as a potential conflict of interest.
Author Contributions
B.L. conducted the data curation, analysis and wrote the manuscript. X.H. designed the paradigm and performed the data collection. Y.W and X.C. performed the data collection and revised the manuscript. X.G. supervised the study.
Funding
B.L is supported by the Doctoral BrainX Seed Grant Program of Tsinghua University. This research is supported by the National Natural Science Foundation of China under grant 61431007, and the National Key R&D Program of China under grant 2017YFB1002505, and Guangdong Province, China under grant 2018B030339001.
Acknowledgments
We would like to thank D.X., J.S., L.L., X.L. for providing support in the data collection.
References
- Wolpaw et al. (2002) Wolpaw JR, Birbaumer N, McFarland DJ, Pfurtscheller G, Vaughan TM. Brain–computer interfaces for communication and control. Clinical neurophysiology 113 (2002) 767–791.
- Ang and Guan (2013) Ang KK, Guan C. Brain-computer interface in stroke rehabilitation. Journal of computing science and engineering 7 (2013) 139–146.
- Lebedev and Nicolelis (2017) Lebedev MA, Nicolelis MAL. Brain-machine interfaces: From basic science to neuroprostheses and neurorehabilitation. Physiological Reviews 97 (2017) 767–837.
- Pandarinath et al. (2017) Pandarinath C, Nuyujukian P, Blabe CH, Sorice BL, Saab J, Willett FR, et al. High performance communication by people with paralysis using an intracortical brain-computer interface. Elife 6 (2017) e18554.
- Gao et al. (2003) Gao X, Xu D, Cheng M, Gao S. A bci-based environmental controller for the motion-disabled. IEEE Transactions on Neural Systems and Rehabilitation Engineering 11 (2003) 137–140.
- Norcia et al. (2015) Norcia AM, Appelbaum LG, Ales JM, Cottereau BR, Rossion B. The steady-state visual evoked potential in vision research: A review. Journal of Vision 15 (2015) 4–4.
- Cheng et al. (2002) Cheng M, Gao X, Gao S, Xu D. Design and implementation of a brain-computer interface with high transfer rates. IEEE Transactions on Biomedical Engineering 49 (2002) 1181–1186.
- Bin et al. (2009) Bin G, Gao X, Yan Z, Hong B, Gao S. An online multi-channel ssvep-based brain-computer interface using a canonical correlation analysis method. Journal of Neural Engineering 6 (2009) 046002.
- Chen et al. (2015a) Chen X, Wang Y, Nakanishi M, Gao X, Jung T, Gao S. High-speed spelling with a noninvasive brain-computer interface. Proceedings of the National Academy of Sciences of the United States of America 112 (2015a) 201508080.
- Nakanishi et al. (2018) Nakanishi M, Wang Y, Chen X, Wang Y, Gao X, Jung T. Enhancing detection of ssveps for a high-speed brain speller using task-related component analysis. IEEE Transactions on Biomedical Engineering 65 (2018) 104–112.
- Lee et al. (2019) Lee M, Kwon O, Kim Y, Kim H, Lee YE, Williamson J, et al. Eeg dataset and openbmi toolbox for three bci paradigms: an investigation into bci illiteracy. GigaScience 8 (2019).
- Zerafa et al. (2018) Zerafa R, Camilleri T, Falzon O, Camilleri KP. To train or not to train? a survey on training of feature extraction methods for ssvep-based bcis. Journal of neural engineering 15 (2018) 051001.
- Wong et al. (2019) Wong CM, Wan F, Wang B, Wang Z, Nan W, Lao KF, et al. Learning across multi-stimulus enhances target recognition methods in ssvep-based bcis. Journal of Neural Engineering (2019).
- Bin et al. (2011) Bin G, Gao X, Wang Y, Li Y, Hong B, Gao S. A high-speed bci based on code modulation vep. Journal of Neural Engineering 8 (2011) 025015.
- Zhang et al. (2013) Zhang Y, Zhou G, Jin J, Wang M, Wang X, Cichocki A. L1-regularized multiway canonical correlation analysis for ssvep-based bci. IEEE Transactions on Neural Systems and Rehabilitation Engineering 21 (2013) 887–896.
- Yin et al. (2015) Yin E, Zhou Z, Jiang J, Yu Y, Hu D. A dynamically optimized ssvep brain–computer interface (bci) speller. IEEE Transactions on Biomedical Engineering 62 (2015) 1447–1456.
- Nakanishi et al. (2014) Nakanishi M, Wang Y, Wang YT, Mitsukura Y, Jung T. A high-speed brain speller using steady-state visual evoked potentials. International Journal of Neural Systems 24 (2014) 1450019.
- Chen et al. (2015b) Chen X, Wang Y, Gao S, Jung T, Gao X. Filter bank canonical correlation analysis for implementing a high-speed ssvep-based brain–computer interface. Journal of Neural Engineering 12 (2015b) 046008.
- Friman et al. (2007) Friman O, Volosyak I, Graser A. Multiple channel detection of steady-state visual evoked potentials for brain-computer interfaces. IEEE Transactions on Biomedical Engineering 54 (2007) 742–750.
- Zhang et al. (2014) Zhang Y, Xu P, Cheng K, Yao D. Multivariate synchronization index for frequency recognition of ssvep-based brain–computer interface. Journal of Neuroscience Methods 221 (2014) 32–40.
- Abu-Alqumsan and Peer (2016) Abu-Alqumsan M, Peer A. Advancing the detection of steady-state visual evoked potentials in brain–computer interfaces. Journal of Neural Engineering 13 (2016) 036005.
- Bakardjian et al. (2010) Bakardjian H, Tanaka T, Cichocki A. Optimization of ssvep brain responses with application to eight-command brain–computer interface. Neuroscience letters 469 (2010) 34–38.
- Kołodziej et al. (2015) Kołodziej M, Majkowski A, Rak RJ. A new method of spatial filters design for brain-computer interface based on steady state visually evoked potentials. 2015 IEEE 8th International Conference on Intelligent Data Acquisition and Advanced Computing Systems: Technology and Applications (IDAACS) (IEEE) (2015), vol. 2, 697–700.
- Kalunga et al. (2016) Kalunga EK, Chevallier S, Barthélemy Q, Djouani K, Monacelli E, Hamam Y. Online ssvep-based bci using riemannian geometry. Neurocomputing 191 (2016) 55–68.
- Kwak et al. (2017) Kwak NS, Müller KR, Lee SW. A convolutional neural network for steady state visual evoked potential classification under ambulatory environment. PloS one 12 (2017) e0172578.
- İşcan and Nikulin (2018) İşcan Z, Nikulin VV. Steady state visual evoked potential (ssvep) based brain-computer interface (bci) performance under different perturbations. PloS one 13 (2018) e0191673.
- Wang et al. (2017) Wang Y, Chen X, Gao X, Gao S. A benchmark dataset for ssvep-based brain–computer interfaces. IEEE Transactions on Neural Systems and Rehabilitation Engineering 25 (2017) 1746–1752.
- Choi et al. (2019) Choi GY, Han CH, Jung YJ, Hwang HJ. A multi-day and multi-band dataset for a steady-state visual-evoked potential–based brain-computer interface. GigaScience 8 (2019) giz133.
- Russakovsky et al. (2015) Russakovsky O, Deng J, Su H, Krause J, Satheesh S, Ma S, et al. Imagenet large scale visual recognition challenge. International journal of computer vision 115 (2015) 211–252.
- Manyakov et al. (2013) Manyakov NV, Chumerin N, Robben A, Combaz A, Van Vliet M, Van Hulle MM. Sampled sinusoidal stimulation profile and multichannel fuzzy logic classification for monitor-based phase-coded ssvep brain-computer interfacing. Journal of Neural Engineering 10 (2013) 036011.
- Chen et al. (2014) Chen X, Chen Z, Gao S, Gao X. A high-itr ssvep-based bci speller. Brain-Computer Interfaces 1 (2014) 181–191.
- Brainard (1997) Brainard DH. The psychophysics toolbox. Spatial Vision 10 (1997) 433–436.
- Delorme and Makeig (2004) Delorme A, Makeig S. Eeglab: an open source toolbox for analysis of single-trial eeg dynamics including independent component analysis. Journal of Neuroscience Methods 134 (2004) 9–21.
- Nakanishi et al. (2017) Nakanishi M, Wang Y, Wang YT, Jung TP. Does frequency resolution affect the classification performance of steady-state visual evoked potentials? 2017 8th International IEEE/EMBS Conference on Neural Engineering (NER) (IEEE) (2017), 341–344.
- Xing et al. (2018) Xing X, Wang Y, Pei W, Guo X, Liu Z, Wang F, et al. A high-speed ssvep-based bci using dry eeg electrodes. Scientific Reports 8 (2018) 14708.
- Broek et al. (1998) Broek SPVD, Reinders F, Donderwinkel M, Peters MJ. Volume conduction effects in eeg and meg. Electroencephalogr Clin Neurophysiol 106 (1998) 522–534.
- Thorpe et al. (2007) Thorpe S, Nunez PL, Srinivasan R. Identification of wave-like spatial structure in the ssvep: comparison of simultaneous eeg and meg. Statistics in Medicine 26 (2007) 3911–3926.
- Liu et al. (2017) Liu B, Chen X, Yang C, Wu J, Gao X. Effects of transcranial direct current stimulation on steady-state visual evoked potentials. 2017 39th Annual International Conference of the IEEE Engineering in Medicine and Biology Society (EMBC) (IEEE) (2017), 2126–2129.
- Di Russo and Spinelli (1999) Di Russo F, Spinelli D. Electrophysiological evidence for an early attentional mechanism in visual processing in humans. Vision research 39 (1999) 2975–2985.
- Nakanishi et al. (2015) Nakanishi M, Wang Y, Wang YT, Jung TP. A comparison study of canonical correlation analysis based methods for detecting steady-state visual evoked potentials. PloS one 10 (2015).
- Wechsler (2008) Wechsler D. Wechsler adult intelligence scale–fourth edition (wais–iv). San Antonio, TX: NCS Pearson 22 (2008) 498.
- McMahan et al. (2016) McMahan HB, Moore E, Ramage D, Hampson S, et al. Communication-efficient learning of deep networks from decentralized data. arXiv preprint arXiv:1602.05629 (2016).
- Wong et al. (2020) Wong CM, Wang B, Wang Z, Lao KF, Rosa A, Wan F. Spatial filtering in ssvep-based bcis: Unified framework and new improvements. IEEE Transactions on Biomedical Engineering (2020).
Figure captions