ciamician]Dipartimento di Chimica “Giacomo Ciamician”, Università di Bologna, Via Selmi 2, I-40126 Bologna, Italy ciamician]Dipartimento di Chimica “Giacomo Ciamician”, Università di Bologna, Via Selmi 2, I-40126 Bologna, Italy toso]Dipartimento di Chimica Industriale “Toso Montanari”, Università di Bologna, Viale del Risorgimento 4, I-40136 Bologna, Italy observatory]National Radio Astronomy Observatory, Charlottesville, VA 22903, USA observatory]National Radio Astronomy Observatory, Charlottesville, VA 22903, USA observatory]National Radio Astronomy Observatory, Charlottesville, VA 22903, USA \alsoaffiliation[harvard]Center for Astrophysics Harvard & Smithsonian, Cambridge, MA 02138, USA
The Sub-millimeter Rotational Spectrum of Ethylene Glycol up to 890 GHz and Application to ALMA Band 10 Spectral Line Data of NGC 6334I
Abstract
The rotational spectrum of the most stable conformer of ethylene glycol (\ceHO(CH2)2OH) has been recorded between 360–890 GHz using a frequency-modulation sub-millimeter spectrometer. The refinement and extension of the spectroscopic parameters over previous efforts provides predicted catalog frequencies for ethylene glycol with sufficient accuracy for comparison to high-frequency astronomical data. The improvement in the cataloged line positions, and the need for improved accuracy enabled by high-frequency laboratory work, is demonstrated by an analysis of ethylene glycol emission at 890 GHz in the high-mass star-forming region NGC 6334I in ALMA Band 10 observations. The need for accurate rotational spectra at sub-millimeter wavelengths/THz frequencies is discussed.
keywords:
ISM: molecules; Methods: laboratory: molecular1 Introduction
Of the more than 200 molecules detected in the interstellar medium (ISM) to date, more than 80% were discovered through observations of their pure rotational transitions 1. With few exceptions2, 3, 4, the detection and characterization of molecules in the ISM is preceded by high-resolution spectroscopic investigations in the laboratory. Depending on the molecular structure, many thousands of line frequencies may be measured and fit using common software packages5, 6 to a Hamiltonian7, providing a set of rotational constants (, , ) as well as higher-order terms that account for the effects of centrifugal distortion, internal motion, fine and hyperfine coupling, etc. These constants can then be used together with the Hamiltonian to predict energy levels and associated transition frequencies not directly measured within the laboratory. The accuracy of these predictions outside the range of the laboratory measurements varies substantially depending on the structure of the molecule and the extent of the extrapolation8, 9.
Substantial laboratory efforts were undertaken about a decade ago to enable analysis of high-resolution spectra from the Heterodyne Instrument for the Far Infrared10 (HIFI) instrument on the Herschel Space Observatory11, which operated from 480–1910 GHz. While transformative, the observations obtained with Herschel/HIFI primarily contained spectra of either small molecules such as \ceHCl+12, 13 or of bright, abundant species such as \ceCH3OH14, 15, 16. In general, high-frequency laboratory spectra of larger, more complex species have not been a priority, as the observational tools needed to observe them at high frequencies have not been available.
Recent observations in Band 10 (787 – 950 GHz) with the Atacama Large Millimeter/sub-millimeter Array (ALMA) have demonstrated that these priorities must now shift to larger molecules. The small single-dish antennas on Herschel or the Stratospheric Observatory for Infrared Astronomy (SOFIA)17 result in large beams on the sky, heavily diluting the signal from compact star-forming regions such that (in general) the spectra are dominated by bright, abundant species like \ceCH3OH. Interferometric observations with ALMA, however, have beams well-matched to the molecular emission, and are producing line-confusion limited spectra that are rich with emission from large, complex species that are not yet well studied in the laboratory.18
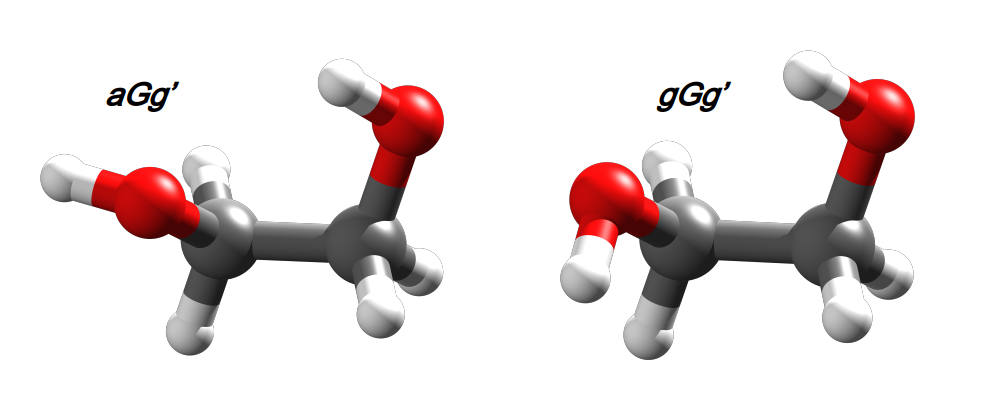
One such species is ethylene glycol (EG; \ceHO(CH2)2OH); prior laboratory work on the most stable conformer aGg’ of this species included spectra up to 370 GHz19, 20. Here, we extend this work to 890 GHz and show that not only is EG present and bright in our ALMA Band 10 spectra, but that identification of these lines would not be possible via extrapolation from the lower-frequency work.
2 Experimental Section
2.1 Laboratory Spectroscopy and Analysis
| Parameter | Present work | Previous[a] | Parameter | Present work | Previous[a] | ||
|---|---|---|---|---|---|---|---|
| Lines | 777 | ||||||
| rms | 0.064 | ||||||
| 0.86 | |||||||
-
•
Notes: Units are in MHz, except the dimensionless standard deviation . Values in parenthesis denote one standard deviation and apply to the last digits of the constants. Christen and Müller 20.
The rotational spectrum of the most stable conformer of EG has been recorded with a frequency-modulation sub-millimeter spectrometer 21. Spectral coverage between 360 and 890 GHz was attained by combination of a Gunn diode (J.E. Carlstrom Co22) emitting in the range 80–115 GHz and a number of passive multipliers (VDI, RPG)23 in cascade. The resulting output radiation power was ca. 1 mW, 0.1 mW, and 10 W at 360–390, 520–620, and 780–890 GHz, respectively. The Gunn’s radiation was phase-locked to a harmonic of a frequency synthesizer (Schomandl, ND 1000) and frequency modulated at = 48 kHz by the 75 MHz reference signal. A free-space glass absorption cell (3.25 m long, 5 cm in diameter) filled with EG vapors at a static pressure of ca. 15 mTorr was used for the measurements. Phase-sensitive detection at twice the modulation frequency was employed, so that the spectrum profile was observed. A liquid-helium-cooled InSb bolometer (QMC Instr. Ltd. type QFI/2) was used as detector. We estimate the measurement uncertainty on any given line to between 25 and 50 kHz, depending on the linewidth and the signal-to-noise ratio (SNR) of the spectrum at that frequency.
From a spectroscopic point of view, the aGg’ conformer of EG (shown in Fig. 1) is a nearly-prolate asymmetric-top rotor with an internal large amplitude motion. Because of the tunneling between two equivalent positions of the hydroxy groups, each rotational energy level is split into two sub-levels, labeled as 0 or 1. The state 1 is slightly higher in energy than the state 0. EG possesses a permanent electric dipole moment of 2.33 D, with components D, D, and D19. Since the inversion motion causes the change in sign of and , these two components allow transitions between the tunneling states 0 and 1; on the other hand, -type transitions take place within the states.
The rotational-torsional energy levels can be described using the formalism introduced by Christen and Müller 20. Rather than fitting two sets of spectroscopic constants (one for each tunneling state) along with the energy difference between levels 0 and 1, as is often performed for these types of analyses, Christen and Müller 20 have rearranged the Hamiltonian so that a unique set of rotational constants and the energy difference are fit along with their centrifugal dependencies. The latter (Reduced Axis System; RAS) and former (Internal Axis Method; IAM) approaches have been demonstrated to be equivalent; the use of RAS method has been preferred in this and previous works20, 25 because it is implemented in the SPFIT program5, 26. An extensive description of the RAS Hamiltonian is given in the original papers20, 25.
Based on the spectroscopic parameters reported previously20, the rotational spectrum of aGg’-EG were predicted and investigated at frequencies above 360 GHz. Mostly, rotational-torsional transitions have been recorded line-by-line, scanning a few MHz around the predicted position. Spectral predictions were continuously updated by refining the spectroscopic constants on the basis of our newly recorded transitions, in order to avoid possible misassignment. Indeed, discrepancies up to 36 MHz were found between older and actual line frequencies. The observed lineshapes were dominated by Doppler broadening; the pressure of EG vapors was maintained at a value which allowed the observation of spectra with good SNR without causing significant pressure broadening. The uncertainty in line center frequencies was evaluated on a line by line basis, accounting for the effects of Doppler broadening on the linewidths.
In total, 228 distinct frequencies111The list of newly observed transitions, along with their residuals from the final fit, is provided as supplementary material., corresponding to 370 transitions, have been added to the existing dataset and all the experimental data have been fitted together in a least-square procedure in which each datum was weighted accordingly to its uncertainty. We probed rotational energy levels up to and , thanks to which we were able to substantially improve the centrifugal analysis of aGg’-EG. For instance, the whole set of centrifugal distortion terms up to the 8th order of the rotational Hamiltonian ( and constants) has been determined for the first time with good accuracy. Some centrifugal dependencies of Coriolis ( and ) and energy difference () terms have also been included in the analysis. To limit strong correlations among the spectroscopic parameters, however, we tried to keep the number of floating constants low, as long as the standard deviation of the fit remained at values around 1. On the whole, our newly determined parameters agree well with those previously reported20 but their associated errors are slightly smaller in our work, as can be seen from Table 1. The overall standard deviation () seems to indicate that the analyzed data are well-reproduced within their expected accuracy. Our new spectral predictions offer a solid base to assist astronomical searches of aGg’-EG even at high frequencies.
Regrettably, a thorough knowledge of the rotational spectrum of EG is still a distant goal. This is because (i) the spectrum of the second most stable conformer gGg’ (which is estimated to be only 160–290 K more energetic than aGg’27, 24, 25) has been studied up to 579 GHz but extrapolations to higher frequencies were suggested to be not reliable 25 and (ii) transitions belonging to low-lying vibrational excited states remain completely unassigned. The potentially substantial impact of such vibrational states on the crowding of astronomical spectra has previously been demonstrated 28.
2.2 Observations and Analysis
The observations presented here are from ALMA projects #2017.1.00717.S, #2017.1.00661.S, and #2015.A.00022.T. The calibration and reduction are presented in detail elsewhere,29, 30, 31, 18 and will only be briefly discussed here. The observations were centered at (J2000) = 17:20:53.36, (J2000) = -35:47:00.0, and have been smoothed to provide a uniform angular resolution of across all datasets. More than a dozen portions of frequency coverage span the range from 130 – 898 GHz with velocity resolutions of 0.3 – 1.0 km s-1. The continuum has been identified from (relatively) line-free channels and subtracted from the spectra following the methods described in Brogan et al. 31.
We have simulated the spectrum of EG up to 900 GHz using both the new spectroscopic parameters derived here, and the literature values from which current database entries are derived.20 The spectra are simulated following the formalisms of Turner 32, which include corrections for optical depth based on the background continuum temperatures we have measured during the continuum subtraction. Intensities were converted to brightness temperature on the Planck scale, as errors introduced from the Rayleigh-Jeans approximation become large at high frequencies and small angular scales.
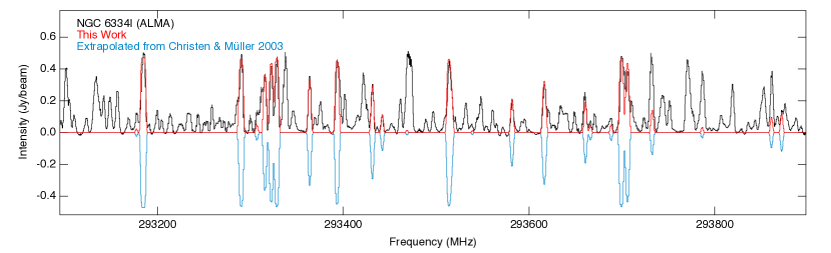
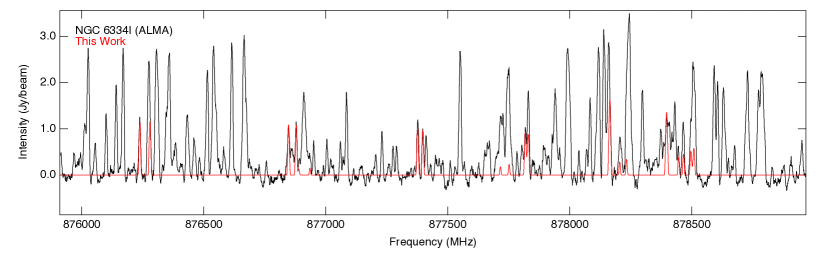
For complex molecules such as glycolaldehyde (\ceHOCH2CHO) with optically thin emission, we have found that a single column density with an excitation temperature of = 135 K, linewidth of = 3.2 km s-1, and = -7 km s-1 well reproduces the observed spectral profiles.18 For optically thick molecules, such as \ceCH3OH and EG however, the excitation temperature and column density can vary more significantly across the ALMA Bands due to varying penetration depths of the observations into the cloud.18 A complete treatment of these species is not only beyond the scope of this work, but would require a multidimensional radiative transfer model due to the spatial complexity of the region. Therefore, here we limit ourselves to only discussing the impact that the frequency accuracy of the predictions has on line identification in high frequency ALMA data. A comparison of EG emission simulated using the existing literature constants to those derived in this work is shown in Figure 2.
3 Discussion
In Band 7 (Fig. 2 Top), well within the frequency range of the previous laboratory work, there is, as expected, near perfect agreement between not only spectra simulated with our refined constants compared to those of Christen and Müller 20, but also between both simulations and the observations. The middle panel shows ALMA Band 10 data with only the newly measured lines overlaid. Both the top and middle panels demonstrate the need for robust line catalogs, as even relatively complex species such as EG contribute substantially to the total line density in ALMA observations of hot cores.
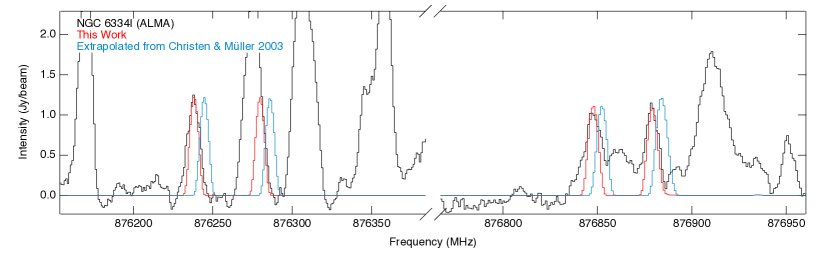
The bottom panel demonstrates the need for high frequency laboratory work. The simulation based on the prior work is significantly offset from the true line positions, as shown by the excellent agreement between our new predictions and the observations. This would result either in a faulty conclusion that EG is not present in the Band 10 spectra, or perhaps that it is velocity shifted to an incorrect .

Many of the lines in our Band 10 spectra are shifted by 5 MHz (2 km s-1 at 890 GHz). Yet, notably, stepping down in frequency to observations in ALMA Band 9 (602–720 GHz), the two datasets are once again in excellent agreement with each other and with the observations (Fig. 3). Indeed, because extrapolation errors are dependent on the quantum numbers and the accuracy with which the corresponding energy levels are known, rather than directly upon frequency, the situation can be quite challenging to assess. For example, higher-frequency transitions of one type, e.g. b-type transitions, arising between two energy levels that are well-characterized from lower-frequency measurements of a-type transitions may be accurately predicted. On the other hand, transitions very near in frequency but arising from poorly constrained energy levels might be highly inaccurate. Additionally, uncertainties in higher-order distortion terms scale non-linearly with increasing values of the quantum numbers,
As a result, it is often not clear the extent to which extrapolations become dangerous. Extrapolating a factor of 1.9 times higher in frequency (to 700 GHz) than the original work by Christen and Müller 20 results in predictions that can be used to accurately analyze observational data, because these energy levels are well-constrained by the laboratory measurements. A factor of 2.4 (to 875 GHz), however, is too far, as demonstrated by our Band 10 analysis.
Most spectral fitting programs, including SPFIT/SPCAT, provide estimated uncertainties on the line positions that could be used for a zeroth-order approximation of the safety of extrapolation. Yet, these are often statistical errors derived from the fit itself, and are not representative of the overall uncertainty of the prediction. For example, the EG signal just below 876250 MHz in Fig. 2 arises from the and transitions. Using the errors in the constants reported by Christen and Müller 20, SPCAT provides an uncertainty of 0.3 MHz for these line centers, a factor of 15 lower than the actual error. The most reliable and robust method for ensuring that sufficiently accurate data are available is to measure these species in the laboratory at the required frequencies.
4 Conclusions
Here, we have extended the investigation of the rotational spectrum of the lowest-energy conformer (aGg’) of ethylene glycol to 890 GHz. The analysis and assignment was significantly aided by prior lower-frequency work. Extrapolating frequencies based on that lower-frequency work proved robust for analyzing astronomical spectra from ALMA toward the high-mass star-forming region NGC 6334I up through 800 GHz. In ALMA Band 10, however, these predictions diverged substantially, requiring our new laboratory measurements to make a secure detection. This demonstrates the need for new high-frequency laboratory experiments to enable the robust analysis of data in corresponding ALMA observations.
5 Associated Content
Supporting Information. List of newly observed transitions and their residuals from the final fit, SPCAT input and output files (aGg.int, aGg.var, aGg.cat).
6 Acknowledgements
The authors thank the anonymous reviewers for helpful comments which have improved the quality of this manuscript. This work has been supported in Bologna by MIUR ‘PRIN 2015’ funds (project “STARS in the CAOS (Simulation Tools for Astrochemical Reactivity and Spectroscopy in the Cyberinfrastructure for Astrochemical Organic Species)” - Grant Number 2015F59J3R) and by the University of Bologna (RFO funds). This paper makes use of the following ALMA data: ADS/JAO.ALMA#2017.1.00717.S, #2017.1.00661.S, and #2015.A.00022.T. ALMA is a partnership of ESO (representing its member states), NSF (USA) and NINS (Japan), together with NRC (Canada) and NSC and ASIAA (Taiwan) and KASI (Republic of Korea), in cooperation with the Republic of Chile. The Joint ALMA Observatory is operated by ESO, AUI/NRAO and NAOJ. The National Radio Astronomy Observatory is a facility of the National Science Foundation operated under cooperative agreement by Associated Universities, Inc. Support for B.A.M. was provided by NASA through Hubble Fellowship grant #HST-HF2-51396 awarded by the Space Telescope Science Institute, which is operated by the Association of Universities for Research in Astronomy, Inc., for NASA, under contract NAS5-26555. This research made use of NASA’s Astrophysics Data System Bibliographic Services, Astropy, a community-developed core Python package for Astronomy 33, and APLpy, an open-source plotting package for Python hosted at http://aplpy.github.com.
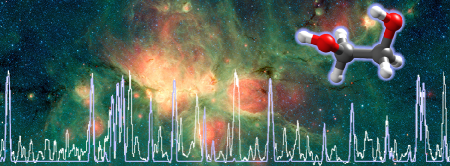
7 Table of Contents Graphic
References
- McGuire 2018 McGuire, B. A. 2018 Census of Interstellar, Circumstellar, Extragalactic, Protoplanetary Disk, and Exoplanetary Molecules. The Astrophysical Journal Supplement Series 2018, 239, 17
- Woods et al. 1975 Woods, R. C.; Dixon, T. A.; Saykally, R. J.; Szanto, P. G. Laboratory microwave spectrum of HCO+. Physical Review Letters 1975, 35, 1269–1272
- Cernicharo et al. 2008 Cernicharo, J.; Guélin, M.; Agúndez, M.; McCarthy, M. C.; Thaddeus, P. Detection of C5N- and vibrationally excited C6H in IRC+10216. The Astrophysical Journal 2008, 688, L83
- Pety et al. 2012 Pety, J.; Gratier, P.; Guzmán, V.; Roueff, E.; Gerin, M.; Goicoechea, J. R.; Bardeau, S.; Sievers, A.; Le Petit, F.; Le Bourlot, J. et al. The IRAM-30 m line survey of the Horsehead PDR. A&A 2012, 548, A68
- Pickett 1991 Pickett, H. M. The fitting and prediction of vibration-rotation spectra with spin interactions. Journal of Molecular Spectroscopy 1991, 148, 371–377
- Drouin 2017 Drouin, B. J. Practical uses of SPFIT. Journal of Molecular Spectroscopy 2017, 340, 1–15
- Watson 1977 Watson, J. K. G. In Vibrational Spectra and Structure; Durig, J. R., Ed.; 1977; pp 1–89
- Carroll et al. 2010 Carroll, P. B.; Drouin, B. J.; Widicus Weaver, S. L. The submillimeter spectrum of glycolaldehyde. The Astrophysical Journal 2010, 723, 845–849
- Melosso et al. 2017 Melosso, M.; Degli Esposti, C.; Dore, L. Terahertz Spectroscopy and Global Analysis of the Rotational Spectrum of Doubly Deuterated Amidogen Radical \ceND2. Astrophys. J. Suppl. S. 2017, 233
- de Graauw et al. 2010 de Graauw, T.; Helmich, F. P.; Phillips, T. G.; Stutzki, J.; Caux, E.; Whyborn, N. D.; Dieleman, P.; Roelfsema, P. R.; Aarts, H.; Assendorp, R. et al. The Herschel-Heterodyne Instrument for the Far-Infrared (HIFI). A&A 2010, 518, L6–7
- Pilbratt et al. 2010 Pilbratt, G. L.; Riedinger, J. R.; Passvogel, T.; Crone, G.; Doyle, D.; Gageur, U.; Heras, A. M.; Jewell, C.; Metcalfe, L.; Ott, S. et al. Herschel Space Observatory. A&A 2010, 518, L1–6
- De Luca et al. 2012 De Luca, M.; Gupta, H.; Neufeld, D.; Gerin, M.; Teyssier, D.; Drouin, B. J.; Pearson, J. C.; Lis, D. C.; Monje, R.; Phillips, T. G. et al. Herschel/HIFI Discovery of HCl+ in the Interstellar Medium. Astrophysical Journal Letters 2012, 751, L37
- Gupta et al. 2012 Gupta, H.; Drouin, B. J.; Pearson, J. C. The rotational spectrum of HCl+. The Astrophysical Journal 2012, 751, L38
- Crockett et al. 2014 Crockett, N. R.; Bergin, E. A.; Neill, J. L.; Favre, C.; Schilke, P.; Lis, D. C.; Bell, T. A.; Blake, G.; Cernicharo, J.; Emprechtinger, M. et al. Herschel observations of extraordinary sources: Analysis of the HIFI 1.2 THz wide spectral survey toward Orion KL. I. Methods. The Astrophysical Journal 2014, 787, 112
- Neill et al. 2014 Neill, J. L.; Bergin, E. A.; Lis, D. C.; Schilke, P.; Crockett, N. R.; Favre, C.; Emprechtinger, M.; Comito, C.; Qin, S.-L.; Anderson, D. E. et al. Herschel Observations of Extraordinary Sources: Analysis of the full Herschel/HIFI molecular line survey of Sagittarius B2(N). The Astrophysical Journal 2014, 789, 8
- Xu et al. 2008 Xu, L.-H.; Fisher, J.; Lees, R. M.; Shi, H. Y.; Hougen, J. T.; Pearson, J. C.; Drouin, B. J.; Blake, G. A.; Braakman, R. Torsion–rotation global analysis of the first three torsional states (t=0, 1, 2) and terahertz database for methanol. Journal of Molecular Spectroscopy 2008, 251, 305–313
- Temi et al. 2014 Temi, P.; Marcum, P. M.; Young, E.; Adams, J. D.; Adams, S.; Andersson, B. G.; Becklin, E. E.; Boogert, A.; Brewster, R.; Burgh, E. et al. The SOFIA observatory at the start of routine science operations: mission capabilities and performance. Astrophysical Journal Supplement Series 2014, 212, 24–13
- McGuire et al. 2018 McGuire, B. A.; Brogan, C. L.; Hunter, T. R.; Remijan, A. J.; Blake, G. A.; Burkhardt, A. M.; Carroll, P. B.; van Dishoeck, E. F.; Garrod, R. T.; Linnartz, H. et al. First Results of an ALMA Band 10 Spectral Line Survey of NGC 6334I: Detections of Glycolaldehyde (HC(O)CH2OH) and a New Compact Bipolar Outflow in HDO and CS. The Astrophysical Journal Letters 2018, 863, L35
- Christen et al. 1995 Christen, D.; Coudert, L.; Suenram, R. D.; Lovas, F. J. The Rotational/Concerted Torsional Spectrum of the g’Ga Conformer of Ethylene Glycol. J. Mol. Spectrosc. 1995, 172, 57–77
- Christen and Müller 2003 Christen, D.; Müller, H. S. The millimeter wave spectrum of aGg’ ethylene glycol: The quest for higher precision. Physical Chemistry Chemical Physics 2003, 5, 3600–3605
- Melosso et al. 2019 Melosso, M.; McGuire, B. A.; Tamassia, F.; Degli Esposti, C.; Dore, L. Astronomical search of vinyl alcohol assisted by submillimeter spectroscopy. ACS Earth and Space Chemistry 2019, 3, 1189–1195
- Carlstrom et al. 1985 Carlstrom, J. E.; Plambeck, R. L.; Thornton, D. D. A continuously tunable 65-115 GHz Gunn oscillator. IEEE Transactions on Microwave Theory and Techniques 1985, MTT-33, 610
- Crowe et al. 2007 Crowe, T. W.; Porterfield, D. W.; Hesler, J. L.; Bishop, W. L.; Schoenthal, G. S.; Kurtz, D. S.; Hui, K. Development of Multiplier Based Sources for Frequencies up to 2 THz. Eighteenth International Symposium on Space Terahertz Technology. 2007; p 66
- Christen et al. 2001 Christen, D.; Coudert, L. H.; Larsson, J.; Cremer, D. The Rotational–Torsional Spectrum of the g’Gg Conformer of Ethylene Glycol: Elucidation of an Unusual Tunneling Path. J. Mol. Spectrosc. 2001, 205, 185–196
- Müller and Christen 2004 Müller, H. S.; Christen, D. Millimeter and submillimeter wave spectroscopic investigations into the rotation-tunneling spectrum of gGg’ ethylene glycol, \ceHOCH2CH2OH. J. Mol. Spectrosc. 2004, 228, 298–307
- Pickett 1997 Pickett, H. M. Theoretical studies of internal rotation for an asymmetric top. The Journal of Chemical Physics 1997, 107, 6732–6735
- Kristiansen et al. 1987 Kristiansen, P.-E.; Marstokk, K.; Møllendal, H.; Parker, L. Microwave Spectrum of \ceHOCH2CD2OH and the Assignment of a Second Hydrogen-Bonded Conformation of Ethylene Glycol. Acta Chem. Scand. 1987, 41, 403–414
- Fortman et al. 2012 Fortman, S. M.; McMillan, J. P.; Neese, C. F.; Randall, S. K.; Remijan, A. J.; Wilson, T. L.; De Lucia, F. C. An analysis of a preliminary ALMA Orion KL spectrum via the use of complete experimental spectra from the laboratory. Journal of Molecular Spectroscopy 2012, 280, 11–20
- McGuire et al. 2017 McGuire, B. A.; Shingledecker, C. N.; Willis, E. R.; Burkhardt, A. M.; El-Abd, S.; Motiyenko, R. A.; Brogan, C. L.; Hunter, T. R.; Margules, L.; Guillemin, J.-C. et al. ALMA Detection of Interstellar Methoxymethanol (CH3OCH2OH). The Astrophysical Journal Letters 2017, 851, L46
- Hunter et al. 2017 Hunter, T. R.; Brogan, C. L.; MacLeod, G.; Cyganowski, C. J.; Chandler, C. J.; Chibueze, J. O.; Friesen, R.; Indebetouw, R.; Thesner, C.; Young, K. H. An Extraordinary Outburst in the Massive Protostellar System NGC 6334I-MM1: Quadrupling of the Millimeter Continuum. The Astrophysical Journal Letters 2017, 837, L29
- Brogan et al. 2018 Brogan, C. L.; Hunter, T. R.; Cyganowski, C. J.; Chibueze, J. O.; Friesen, R. K.; Hirota, T.; MacLeod, G. C.; McGuire, B. A.; Sobolev, A. M. The Extraordinary Outburst in the Massive Protostellar System NGC 6334I-MM1: Flaring of the Water Masers in a North–South Bipolar Outflow Driven by MM1B. The Astrophysical Journal 2018, 866, 87
- Turner 1991 Turner, B. E. A molecular line survey of Sagittarius B2 and Orion-KL from 70 to 115 GHz. II-Analysis of the data. The Astrophysical Journal Supplement Series 1991, 76, 617–686
- Astropy Collaboration et al. 2013 Astropy Collaboration,; Robitaille, T. P.; Tollerud, E. J.; Greenfield, P.; Droettboom, M.; Bray, E.; Aldcroft, T.; Davis, M.; Ginsburg, A.; Price-Whelan, A. M. et al. Astropy: A community Python package for astronomy. The Astrophysical Journal 2013, 558, A33